Changes in total and acylated ghrelin levels during mitotane treatment in patients with adrenocortical carcinoma
Key words: acylated ghrelin, adrenocortical carcinoma, mitotane, side effects, total ghrelin


 CC BY-NC-SA 4.0
Changes in total and acylated ghrelin levels during mitotane treatment in patients with adrenocortical carcinoma
Introduction: Adrenocortical carcinoma (ACC) is a highly aggressive cancer with poor prognosis. Mitotane is the only approved drug for ACC treatment. Tolerability and efficacy of mitotane is variable. There is evidence that ghrelin may affect cancer development and the occurrence of side effects.
Objectives: We examined the differences in plasma ghrelin concentrations between patients with benign adrenal tumors and adrenal carcinoma. We also investigated the effect of mitotane treatment on circulating plasma ghrelin levels in patients with ACC. Additionally, we assessed the relationship between ghrelin concentrations, mitotane levels, and side effects of mitotane treatment.
Patients and methods: We enrolled 26 patients with ACC and 42 controls with adrenocortical adenoma (ACA). Clinical and histopathologic features, hormonal secretion pattern, and plasma acylated and total ghrelin levels were measured in every patient. Serum mitotane levels, body mass index, and side effects of mitotane treatment were estimated every 3 to 12 weeks during follow‑up in patients with ACC.
Results: There was no significant difference in total and acylated ghrelin concentrations between ACC and ACA groups before mitotane introduction in ACC. We observed that during mitotane treatment, both total and acylated ghrelin levels became elevated in ACC compared with ACA. A positive correlation was found between circulating mitotane levels and acylated ghrelin as well as the ratio of acylated to total ghrelin levels in all patients treated with mitotane. Higher ghrelin levels were associated with increased risk of side effects.
Conclusions: Plasma ghrelin levels are changed during mitotane treatment. These changes may be connected with side effects of mitotane.
Introduction
Adrenal tumors are currently a relatively frequent disorder, affecting up to 4% to 10% of the population. A significant increase in their prevalence has been reported worldwide due to the wide availability of sensitive imaging techniques. Adrenal tumors comprise several types of neoplasms with different clinical manifestation and prognosis. Typically, small benign and hormonally inactive lesions are diagnosed that do not require treatment.1
Adrenocortical carcinoma (ACC) is a rare and highly aggressive cancer. Its clinical symptoms depend mainly on hormonal activity of the tumor. Histopathologic diagnosis of ACC is based on Weiss criteria.2 ACC forms a very heterogenous group of tumors with different biology, overall survival, and prognosis.3 The stages of ACC range from I to IV. Complete surgical resection constitutes the first essential step of treatment. Mitotane is a single drug approved for ACC treatment. It exerts antitumoral and antihormonal effects,4 and can be beneficial both as an adjuvant therapy and in metastatic spread. Its effect is maintained as long as the serum concentration of the drug remains between 14 and 20 mg/l; however, only about 40% to 50% of patients achieve serum mitotane levels within the therapeutic range. Moreover, mitotane can be poorly tolerated, especially due to severe neurotoxicity and gastrointestinal problems.5,6 Furthermore, the efficacy of mitotane is limited. The median progression‑free survival in advanced ACC on mitotane treatment is just about 2 months.7,8 On the other hand, every patient displays individual tolerability and efficacy of the drug. We observed that mitotane doses and treatment time needed to achieve the therapeutic range were difficult to predict and varied between patients. Even if high doses of mitotane are given, serum concentrations above 14 mg/l are only reached in half of the patients, while in some patients, the minimum effective serum concentration is not reached throughout the entire therapy. The reason for this remains unknown.9 Therefore, it is necessary to determine the factors responsible for mitotane tolerance and effectiveness. Such knowledge would help choose the most suitable treatment regimens and might indicate in which cases mitotane‑based therapy would be beneficial.10
Currently, there is some evidence demonstrating a significant role of ghrelin in cancer development. Higher serum ghrelin concentrations were found in patients with cancer compared with healthy controls.11 Additionally, ghrelin and its receptors are expressed in several types of tumors.12 It is suggested that ghrelin is a useful biomarker in some endocrine‑related cancers. However, due to inconclusive findings, the role of ghrelin in cancer development is still unclear. The results of some studies show a stimulatory effect, while others demonstrate the inhibitory effect of ghrelin on tumor progression and proliferation.12,13
In the current study, we examined the differences in plasma ghrelin concentrations between patients with benign adrenal tumors and ACC. We also investigated the effect of mitotane treatment on circulating plasma ghrelin levels in patients with ACC. Additionally, we assessed the relationship between ghrelin concentrations, mitotane levels, and side effects of mitotane treatment. This topic has not been studied before.
Patients and methods
The study protocol was approved by the local ethics committee (No. 255/15). A signed informed consent form was obtained from each enrolled patient.
Study patients
A total of 26 patients with ACC were included in this prospective study. The inclusion criteria were age above 18 years, histologic diagnosis of ACC based on Weiss criteria, eligibility for treatment with mitotane, no other active malignancy, and no concomitant ACC treatment such as radiotherapy or chemotherapy. Adrenalectomy was performed in 16 patients. Advanced ACC not amenable to radical resection was diagnosed in 10 cases.
Tumor size, tumor stage at diagnosis according to the European Network for the Study of Adrenal Tumors classification,14 Weiss score, Ki67 proliferation index, presence of distant metastases, body mass index (BMI), and hormonal secretion pattern were evaluated in every patient at baseline (Table 1). Total and active ghrelin levels were estimated before and during mitotane treatment. Serum mitotane levels, BMI, and side effects of the mitotane treatment were estimated every 3 to 12 weeks during follow‑up.
Parameter | ACC (n = 26) | ACA (n = 42) | P value | ||
Abbreviations: ACA, adrenocortical adenoma; ACC, adrenocortical carcinoma; BMI, body mass index; ENSAT, European Network for the Study of Adrenal Tumors; NA, not available | |||||
Age, y, median (Q1–Q3) | 57 (46–68) | 54 (44–63) | 0.36 | ||
Sex, n (%) | Female | 14 (53.85) | 20 (47.62) | 0.48 | |
Male | 12 (46.15) | 22 (52.38) | |||
Tumor size, mm, median (Q1–Q3) | 125 (82–170) | 42 (30–57) | <0.001 | ||
Hormone secretion, n (%) | Glucocorticoids | 5 (19.23) | 7 (16.67) | – | |
Androgens | 2 (7.69) | – | – | ||
Glucocorticoids and androgens, n (%) | 4 (15.38) | – | – | ||
Aldosterone | NA | – | – | ||
Inactive, n (%) | 13 (50) | – | – | ||
ENSAT tumor stage, n (%) | II | 8 (30.77) | – | – | |
III | 2 (7.69) | – | – | ||
IV | 16 (61.54) | – | – | ||
Ki67 index, median (Q1–Q3) | 25 (8–36.25) | – | – | ||
BMI, kg/m2, median (Q1–Q3) | 23.87 (22.53–28.30) | 26.25 (23.83–31) | 0.14 | ||
Follow‑up, mo, mean (SD) (min–max) | 10.63 (9.44) (1–36) | – | – | ||
The control group consisted of 42 patients with adrenocortical adenoma (ACA). In this group, BMI, hormonal secretion pattern, and plasma acylated and total ghrelin levels were measured.
Mitotane treatment
Patients received mitotane once the diagnosis of ACC was confirmed by an experienced pathologist. The therapy was introduced between 1 and 6 weeks after diagnosis. The initial dose was 2 g/d of mitotane and was titrated up to 6 g/d. The dose was reduced if unacceptable toxicity occurred or a patient refused further therapy.
All patients underwent regular follow‑up visits (every 2–3 weeks at the beginning of treatment and then every 8–12 weeks after 3 months of treatment).
Adverse events
All treatment‑related side effects were recorded during the follow‑up visits. The toxicities were graded using the Common Terminology Criteria for Adverse Events, version 5.0.
Changes in total and acylated ghrelin levels as well as in the acylated‑to‑total ghrelin ratio were measured and correlated with mitotane levels and side effects. We chose the most common side effects in our patients (vomiting, diarrhea, neurotoxicity from mitotane therapy). Differences in the concentration of acylated and total ghrelin between patients with ACA and ACC were assessed. Subsequently, ACC patients were divided into groups according to their serum mitotane concentrations. We used 14 mg/l as the cutoff value, because this concentration is considered a threshold for the therapeutic effect. The ghrelin level was also correlated with the occurrence of side effects.
Blood sampling
Fasting plasma levels of total and acylated ghrelin as well as fasting serum levels of cortisol, dehydroepiandrosterone sulfate, adrenocorticotropic hormone, aldosterone, renin plasma activity, total cholesterol, triglycerides, and glucose were evaluated. Aprotinin was added to samples collected for ghrelin assessment. Blood plasma was obtained through centrifugation and kept frozen at –70°C until hormone assays. Ghrelin was measured by a radioimmunoassay using a kit from Phoenix Pharmaceuticals (Cat. No. RK‑031‑30, Belmont, Massachusetts, United States). The kit contained 125I‑labeled bioactive ghrelin as a tracer and rabbit polyclonal antibodies directed against the C‑terminus of human ghrelin, which recognized both acylated and nonacylated forms of the peptide. Acylated ghrelin was measured by an enzyme‑linked immunosorbent assay using a kit from Sceti (Cat. No. 97751, Tokyo, Japan). The mitotane level was estimated by high‑performance liquid chromatography. Other hormonal and glucose assays were performed by electrochemiluminescence using electrochemiluminescence (Roche Diagnostics, Mannheim, Germany). Total cholesterol levels were measured by the enzymatic colorimetric method, and triglycerides, by the enzymatic colorimetric method with glycerophosphate oxidase and 4‑aminophenazon.
Statistical analysis
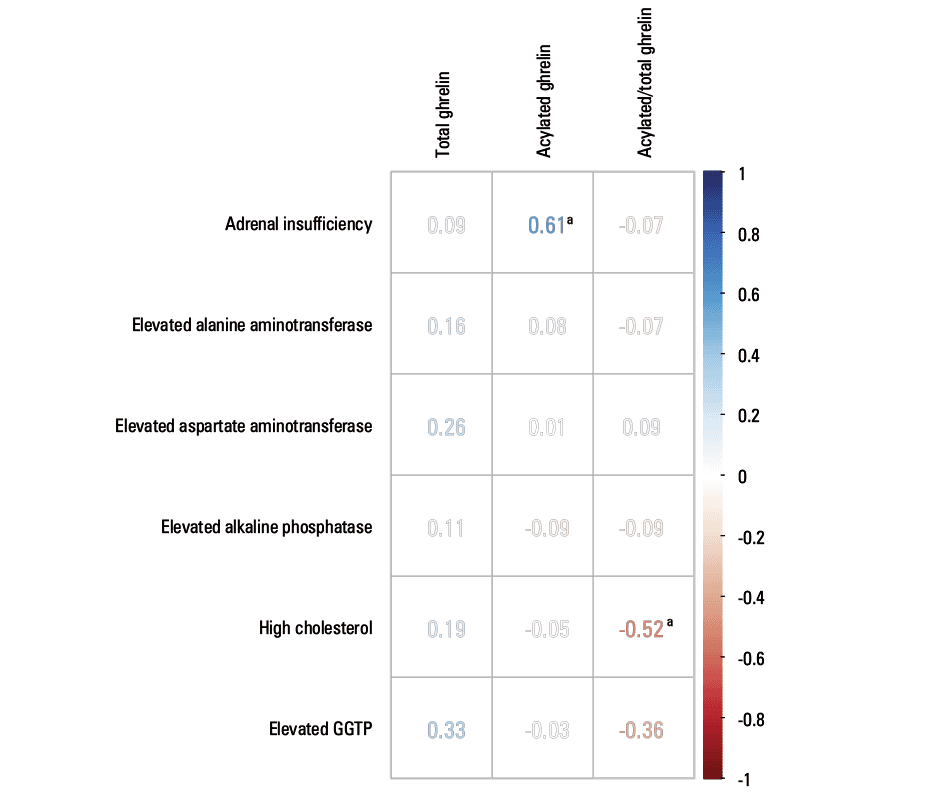
All statistical analyses were carried out in the R programming language and software environment supported by the ggplot2 library for graph drawing. The values of total and acylated ghrelin as well as the ratio of acylated to total ghrelin depending on the mitotane level in patients with ACC and ACA were displayed as a boxplot, where the median, interquartile range, minimum and maximum values, and outliers were presented. The Mann–Whitney test was used to determine whether the difference between the studied groups was significant. The resulting P values were adjusted for multiple testing using the Benjamini–Hochberg correction. The χ2 test was used to compare descriptive characteristics between groups. Corrected P values equal or lower than 0.05 were considered significant. Correlations of total ghrelin, acylated ghrelin, and the acylated‑to‑total ghrelin ratio with mitotane, BMI, Ki67, and tumor size were assessed using the Spearman rank‑order correlation test. Individual results were presented as scatter plots. The association of total ghrelin, acylated ghrelin, and the acylated‑to‑total ghrelin ratio with analyzed side effects observed during mitotane treatment was assessed using the tetrachoric correlation coefficient calculation. First, data were transformed to dichotomous scale. In ACC patients, the values for total ghrelin, acylated ghrelin, and the acylated‑to‑total ghrelin ratio were assigned to 2 categories: above and below the median (considered as a high and low level). Such data were divided between groups with or without the analyzed side effects. Obtained frequency tables were used to calculate the tetrachoric correlation coefficient by the R “polycor” package. Statistical significance was analyzed by the Fisher exact test for count data. The tetrachoric correlation coefficient and significantly different P values were presented as a correlation matrix (Figure 1). For significant comparisons, frequency tables with odds ratios were also presented in Table 2.
Adrenal insufficiency | ||
Acylated ghrelin | No side effect – N (%) | With side effect – N (%) |
Below median value – N | 39 (56) | 1 (11) |
Above median value – N | 31 (44) | 8 (89) |
Odds ratio, 10.06 (95% CI, 1.19–84.834) | ||
High cholesterol | ||
Acylated‑to‑total ghrelin ratio | No side effect – N (%) | With side effect – N (%) |
Below median value – N | 27 (44) | 12 (80) |
Above median value – N | 35 (56) | 3 (20) |
Odds ratio, 0.19 (95% CI, 0.05–0.75) | ||
Results
There were no significant differences between the ACC and ACA groups, except for tumor size. A comparison of clinical and biochemical characteristics of both groups are shown in Table 1.
There was no difference in total and acylated ghrelin concentrations between ACC and ACA groups (P = 0.34 and P = 0.47, respectively) before mitotane treatment in patients with ACC. However, we found that total ghrelin levels were significantly higher in the whole group of ACC patients (before and during mitotane treatment) than in patients with ACA (Figure 2).
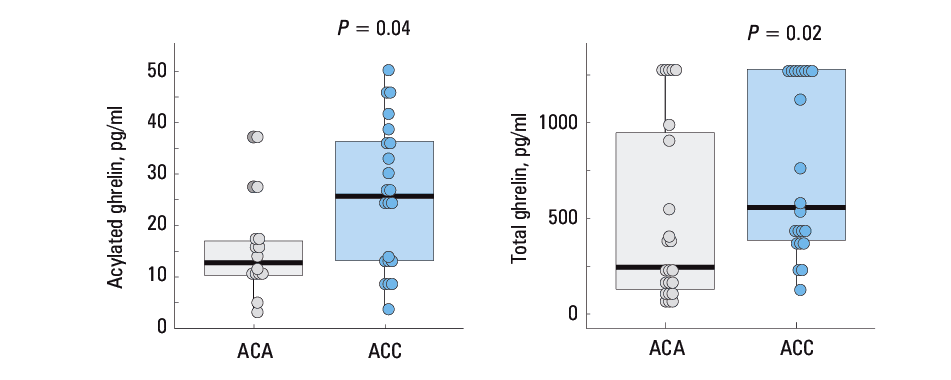
We observed that during mitotane treatment, both total and acylated ghrelin levels became elevated in the ACC group (both in patients who achieved and who did not achieve the therapeutic mitotane concentration) compared with ACA group. However, the difference was significant only in the group with therapeutic mitotane levels (Figure 2).
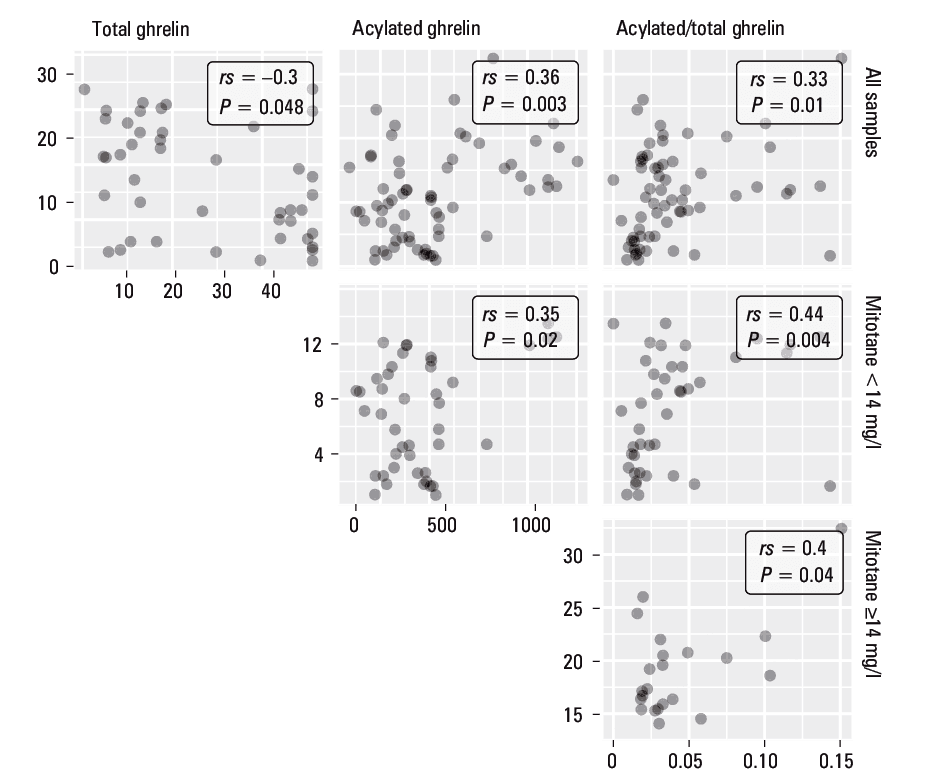
A positive correlation was found between the concentrations of circulating mitotane and acylated ghrelin levels as well as acylated‑to‑total ghrelin ratio in all patients treated with mitotane (Figure 3). In the group with mitotane levels of up to 14 mg/l, we observed a positive correlation of mitotane with acylated ghrelin levels and acylated‑to‑total ghrelin ratio, while a negative correlation was found for mitotane and total ghrelin levels (Figure 3). In the group with the therapeutic concentration, only a correlation between mitotane and the acylated‑to‑total ghrelin ratio was detected.
Both acylated (P = 0.015; rs = –0.31) and total ghrelin (P = 0.021; rs = –0.48) correlated with BMI. However, in our analysis, the change in ghrelin concentrations was not related to the change in BMI in individual patient. Likewise, there was no correlation between ghrelin and tumor size or Ki67.
The side effects that occurred in patients treated with mitotane are summarized in Table 3. The correlation of total ghrelin, acylated ghrelin, and the acylated‑to‑total ghrelin ratio with side effects observed during mitotane treatment is shown in Figure 1. We found a significant correlation between acylated ghrelin and adrenal insufficiency as well as between the acylated‑to‑total ghrelin ratio and increased cholesterol levels.
Adverse effect | Grade 1 | Grade 2 | Grade 3 | Total |
Data are presented as number (percentage) of patients.
Abbreviations: Figure 1 | ||||
Adrenal insufficiency | – | 9 (33.3) | – | 9 (33.3) |
Hypothyroidism | 1 (3.7) | 1 (3.7) | – | 2 (7.4) |
Diarrhea | 2 (7.4) | 2 (7.4) | – | 4 (14.8) |
Nausea | 3 (11.1) | 1 (3.7) | – | 4 (14.8) |
Vomiting | 1 (3.7) | – | – | 1 (3.7) |
Fatigue | 2 (7.4) | – | – | 2 (7.4) |
Elevated alanine aminotransferase | 13 (48.15) | 2 (33.3) | – | 15 (55.56) |
Elevated aspartate aminotransferase | 15 (55.56) | 2 (7.4) | – | 17 (62.96) |
Elevated alkaline phosphatase | 10 (37) | 2 (7.4) | – | 12 (44,4) |
High cholesterol | 9 (33.3) | 3 (11.1) | 1 (3.7) | 13 (48.15) |
Elevated GGTP | 4 (14.8) | 10 (37) | 7 (25.9) | 21 (77.8) |
Dysarthria | 3 (11.1) | 2 (7.4) | – | 5 (18.5) |
Discussion
Ghrelin levels are often elevated in patients with malignancies. However, in our study, we did not observe any changes in ghrelin concentrations between patients with ACC and those with benign adrenal tumors. Ghrelin was reported to affect the development and progression of various types of cancer.11-13 In our previous study, we showed higher concentrations of ghrelin in the ACC tissue compared with other adrenal tumors and healthy adrenal glands. We also demonstrated a positive effect of ghrelin on proliferation and migration of ACC cell lines in vitro. In the current study, we did not observe any differences in ghrelin levels between patients with ACC and ACA. We also found no correlation between tumor size and Ki67 index and circulating ghrelin levels. Hence, it seems that proliferation is not directly related to circulating ghrelin levels, but rather to its local expression level in the tissue. Literature review shows that the physiological concentration of total ghrelin in human serum ranges between 150 and 600 pg/ml.15,16 In fact, this is a lower concentration than that used in most in vivo experiments. However, it is worth noting that expression of ghrelin and its receptors occurs within the adrenal gland. A number of previous papers indicated that both ghrelin and its receptors are expressed in adrenocortical parenchymal cells.13,17-19 Therefore, we assume that ghrelin produced by the adrenal gland may also participate in the regulation of adrenal function in a para/autocrine manner. Local ghrelin concentrations within the adrenal glands alone may be higher than those in serum. The majority of studies showed no or a negative association of ghrelin with the risk and progression of cancer.11 Our research supports that the plasma ghrelin level does not affect the potential of ACC to grow and metastasize.
Elevated serum ghrelin levels in patients with malignant disease are usually explained by weight loss and cachexia.20 In our study, we showed a significant correlation between body weight and the concentration of total and acylated ghrelin in all patients, just as in the general population. Nonetheless, it should be noted that in the ACC group, we did not observe significant changes in body weight during treatment. Therefore, we assume that our findings were not related with changes in BMI in our patients.
Our results suggest that changes in ghrelin levels between ACC and ACA patients are connected with mitotane treatment. We found that in patients with ACC with therapeutic serum mitotane concentrations, both acylated and total ghrelin levels were higher than in those with ACA. Thus, the difference in ghrelin concentrations between these 2 groups might be explained by an increase in ghrelin concentrations caused by mitotane treatment.
We demonstrated a correlation between ghrelin and mitotane even in patients who had not reached the therapeutic mitotane levels. This might be attributed to the observed side effects. In this group, as the concentrations of mitotane and acylated ghrelin increased, the level of total ghrelin decreased. Those alterations led to a decrease in unacylated ghrelin. In the group with circulating therapeutic mitotane level, there was no such correlation. After reaching the therapeutic concentration, the situation stabilized and no further changes in the ghrelin concentration were observed. During mitotane therapy in ACC patients, the most common adverse effects observed mainly at the beginning of treatment were diarrhea and vomiting. The changes in ghrelin levels in this period might have been associated with these disturbances. A similar relationship was described by Malik et al.21 They demonstrated that cancer‑associated dyspepsia may influence ghrelin levels. They examined the effects of cisplatin treatment in the rat and found an increased proportion of acylated ghrelin in serum. In contrast, Hiura et al22 showed that total ghrelin levels decreased after chemotherapy with cisplatin. They found that the degree of ghrelin level reduction correlated with adverse events, especially anorexia and severe nausea in patients with esophageal cancer. It was even proposed that these patients should be treated with ghrelin or its agonists to prevent side effects. Still, total ghrelin decreased only in the first days after chemotherapy with cisplatin, to return to normal on day 8 after drug administration. The authors did not investigate changes in the concentration of acylated and unacylated ghrelin. Yanagimoto et al23 reported a negative correlation between acylated ghrelin and creatinine in patients treated with cisplatin. The authors hypothesized that elevated levels of acylated ghrelin may be associated with a lower risk of acute renal failure. They concluded that ghrelin may have a protective effect on kidney function.
Common side effects of mitotane other than diarrhea and vomiting are elevated levels of liver enzymes. Adrenal insufficiency and hypothyreosis resulting from treatment are substituted with exogenous hormones. The most serious complications are neurologic disorders that require dose reduction, or even interruptions in therapy. We observed that the ghrelin concentration was particularly high in patients with side effects of mitotane. However, we were only able to demonstrate a significant relationship between acylated ghrelin levels and adrenal insufficiency as well as between acylated‑to‑total ghrelin ratio and cholesterol levels (Figure 1). Possibly, the lack of associations between the ghrelin level and other adverse effects results from the moderate intensity of the latter and a rapid intervention in the form of inclusion of anti‑sickness and anti‑diarrheal drugs.
Our observations remain in line with those reported for other types of cancer. It seems that changes in ghrelin levels in patients during chemotherapy are associated with side effects. Moreover, some side effects seem to be correlated with an increase in ghrelin levels, while others, with reduced ghrelin levels. It is possible because ghrelin exerts various physiologic effects. However, the role of acylated and unacylated ghrelin has not been fully explained. Unacylated ghrelin (80%–90% of ghrelin in the bloodstream) used to be considered as inactive. However, recent data suggest that both ghrelin forms may actually exert biological functions. For example, they influence the cardiovascular system, adipogenesis, and cell proliferation. It was proved by Lear et al24 that in cardiomyocytes, des‑G binds to specific receptors and has effects on glucose and medium‑chain fatty acid uptake that are distinct from those of ghrelin. A cardioprotective effect of unacylated ghrelin in reperfusion process has recently been demonstrated.25 Unacylated ghrelin was also reported to promote adipogenesis.26 Dallak et al27 demonstrated that acylated and unacylated forms of ghrelin have a reverse effect on the development of insulin resistance and hepatic steatosis. Thus, some actions are shared by both unacylated and acylated forms, while others appear to be opposite.28 The reverse alterations in both circulating ghrelin forms in patients during mitotane therapy may suggest that their implications for chemotherapy‑related disturbances may be different. Studies have shown that ghrelin may be a potential therapeutic agent for cachexia associated with cancer. Different mechanisms of ghrelin action in cancer‑induced cachexia have been proposed. Nevertheless, the evidence is not sufficient to support or contradict the use of ghrelin in those patients.20 In this context, it seems reasonable to evaluate the levels of both plasma ghrelin forms. Perhaps the assessment of the ratio of acylated to total ghrelin or acylated to nonacylated ghrelin might be a more useful tool with regard to clinical outcomes.
In conclusion, we postulate that circulating ghrelin levels do not influence adrenocortical cancer cell proliferation. Higher ghrelin levels in patients with ACC are probably connected with mitotane treatment and its side effects. Further studies are warranted to explain the role of acylated and unacylated ghrelin. It is possible that changes in the ratio of acylated to unacylated ghrelin are more important than changes in the level of total ghrelin.
- Cyrańska‑Chyrek E, Grzymisławska M, Ruchała M. Diagnostic pitfalls of adrenal incidentaloma. Endokrynol Pol. 2017; 68: 360‑377.
- Aubert S, Wacrenier A, Leroy X, et al. Weiss system revisited: a clinicopathologic and immunohistochemical study of 49 adrenocortical tumors. Am J Surg Pathol. 2002; 26: 1612‑1619. | Crossref
- Nowak KM, Samsel R, Cichocki A, et al. Prognostic factors in adrenocortical carcinoma: data from a large Polish series. Pol Arch Intern Med. 2018; 128: 371‑378. | Crossref
- Paragliola RM, Torino F, Papi G, et al. Role of mitotane in adrenocortical carcinoma ‑ review and state of the art. Eur Endocrinol. 2018; 14: 62‑66. | Crossref
- Maiter D, Bex M, Vroonen L, et al. Efficacy and safety of mitotane in the treatment of adrenocortical carcinoma: a retrospective study in 34 Belgian patients. Ann Endocrinol (Paris). 2016; 77: 578‑585. | Crossref
ARTICLE INFORMATION