A retrospective study of risk factors for severe acute respiratory syndrome coronavirus 2 infections in hospitalized adult patients
Key words: coronavirus disease 2019, risk factors, severe acute respiratory syndrome coronavirus 2, severe infection


 CC BY-NC-SA 4.0
A retrospective study of risk factors for severe acute respiratory syndrome coronavirus 2 infections in hospitalized adult patients
Introduction: Coronavirus disease 2019 (COVID‑19) caused by severe acute respiratory syndrome coronavirus 2 (SARS‑CoV‑2) infection spread worldwide.
Objectives: The aim of the study was to identify the clinical characteristics and risk factors associated with severe incidence of SARS‑CoV‑2 infection.
Patients and methods: All adult patients (median [IQR] age, 52 [37–58] years) consecutively admitted to the Dabieshan Medical Center from January 30, 2020 to February 11, 2020 were collected and reviewed. Only patients diagnosed with COVID‑19 according to the World Health Organization interim guidance were included in this retrospective cohort study.
Results: A total of 108 patients with COVID‑19 were retrospectively analyzed. Twenty‑five patients (23.1%) developed severe disease, and of those 12 patients (48%) died. Advanced age, comorbidities (most commonly hypertension), higher blood leukocyte count, neutrophil count, higher C‑reactive protein level, D‑dimer level, Acute Physiology and Chronic Health Evaluation II (APACHE II) score, and Sequential Organ Failure Assessment (SOFA) score were associated with greater risk of COVID‑19, and so were lower lymphocyte count and albumin level. Multivariable regression showed increasing odds of severe COVID‑19 associated with higher SOFA score (odds ratio [OR], 2.45; 95% CI, 1.302–4.608; P = 0.005), and lymphocyte count less than 0.8 × 10⁹/l (OR, 9.017; 95% CI, 2.808–28.857; P <0.001) on admission. Higher SOFA score (OR, 2.402; 95% CI, 1.313–4.395; P = 0.004) on admission was identified as risk factor for in‑hospital death.
Conclusions: Lymphocytopenia and a higher SOFA score on admission could help clinicians to identify patients at high risk for developing severe COVID‑19. More related studies are needed in the future.
What's new?
Severe acute respiratory syndrome coronavirus 2 (SARS‑CoV‑2) can cause diseases ranging from the common cold to more severe and even fatal multiorgan dysfunction. Our study showed that the elderly with underlying disease were at high risk of SARS‑CoV‑2 infection. In particularly, the higher Sequential Organ Failure Assessment (SOFA) score and lymphocytopenia on admission were associated with greater risk of developing severe coronavirus disease 2019. Therefore, high‑risk patients should receive more attention, should be monitored more closely, and treated in a timely manner, which may help to improve their prognosis.
Introduction
The current outbreak of the novel coronavirus named severe acute respiratory syndrome coronavirus (SARS‑CoV‑2) has spread to more than 100 countries and regions around the world. The World Health Organization (WHO) declared the coronavirus disease 2019 (COVID‑19) outbreak a public health emergency of international concern on January 31, 2020. As of March 18, 2020, the WHO has reported a total of 207855 cases across 166 countries and areas with 8648 deaths.
Severe acute respiratory syndrome coronavirus is a new strain of coronavirus not previously identified in humans or animals.1 Coronaviruses are a large family of viruses including 4 subfamilies: alpha, beta, gamma, and delta. Severe acute respiratory syndrome coronavirus belongs to the B lineage of the Betacoronavirus genus and is closely related to the SARS‑CoV virus.2 Currently, SARS‑CoV‑2 appears to have a lower case‑fatality rate (3250 [4%] out of 81263) in China than either SARS‑CoV (774 [9.6%] out of 8096) or Middle East respiratory syndrome coronavirus (MERS‑CoV; 858 [34.4%] out of 2494).3 Despite the lower case‑fatality rate,4 COVID‑19 has so far resulted in more deaths (3056) than SARS and MERS combined (1632).
In concert with recent studies, the epidemiological and clinical characteristics of COVID‑19 have been reported.5-8 Most people infected with SARS‑CoV‑2 have mild disease and recover. Fever and dry cough are the dominant symptoms. Severe and critical illness occurred in approximately 20% of the patients after admission to the hospital. Currently available evidence suggests that elder age and coexisting medical condition is associated with a higher risk of poor outcome.9-11 The high Sequential Organ Failure Assessment (SOFA) score and increased D‑dimer levels were also identified as risk factors for COVID‑19 mortality.12 However, the studies looked mainly into patients from Wuhan in the early stage of the COVID‑19 outbreak. The proportion of severe patients was significantly higher than that in other areas in China, and the mortality was as high as 20% to 30%.9-11 Some studies have confirmed that the characteristics of patients with COVID‑19 outside of Wuhan differed from patients in Wuhan.7,8,13 Therefore, the clinical outcomes and risk factors associated with severe COVID‑19 remains to be determined. In this study, a total of 108 cases of Huanggang city from January 24, 2020 to February 8, 2020 were retrospectively analyzed. We aimed to compare the clinical characteristics, laboratory findings, treatment, and outcomes of patients with nonsevere or severe COVID‑19, to explore the risk factors associated with the severe incidence of SARS‑CoV‑2 infection.
Patients and methods
Study design and participants
All adult patients consecutively admitted to the Dabieshan Medical Center from January 30, 2020 to February 11, 2020 were collected and reviewed. Only patients diagnosed with COVID‑19 on admission according to the WHO interim guidance before admission were included in this retrospective cohort study. The Dabieshan Medical Center is the designated hospital for patients with COVID‑19 in Huanggang city, Hubei Province, China. It was affiliated to the Huanggang Central Hospital and has been entrusted by Shandong medical rescue team since February 2, 2020. As of March 3, all included patients were discharged or died.
The study was approved by the institutional review board of Shandong Provincial Hospital (SWYX: NO.2020–012) and Huanggang Central Hospital (HGYY‑2020‑009). The requirement for informed consent was waived by the ethics committee due to the urgent need to collect data on this emerging pathogen.
Data collection
Demographic, clinical, laboratory, imaging examination, treatment, and outcome data were collected using a standardized case‑report form. All data were checked by 2 physicians (QY and PW), and then a third researcher (YC) determined any differences in interpretation between the 2 primary reviewers. The Acute Physiology and the Chronic Health Evaluation (APACHE II) score, the SOFA score, National Early Warning Score (NEWS2) score, and the quick Sequential Organ Failure Assessment (qSOFA) score were calculated separately using the worst value of physiological variables within 24 hours of presentation.
Laboratory procedures
Throat‑swab or sputum specimens were collected from all patients before admission for SARS‑CoV‑2 detection, and the detection was repeated twice every 24 hours. Reverse transcriptase–polymerase chain reaction assays were performed in accordance with the protocol described previously.6
Laboratory and imaging examinations (chest X‑ray or computed tomography) were conducted for all patients with SARS‑CoV‑2 infection on admission. Routine blood examinations included: complete blood count, coagulation profile, serum biochemical tests (including renal and liver function, creatine kinase, lactate dehydrogenase, and electrolytes), myocardial markers, procalcitonin, and arterial blood gas analysis. The identification of other respiratory pathogens was also needed, including influenza A virus (H1N1, H3N2, h7n9), influenza B virus, respiratory syncytial virus, parainfluenza virus, and adenovirus. Frequency of examinations and treatment were all determined by the treating physician. Patients met the discharge criteria if they had no fever for at least 3 days, substantial improvement in both lungs on chest computed tomography, clinical remission of respiratory symptoms, and 2 throat‑swab samples negative for SARS‑CoV‑2 RNA obtained at least 24 hours apart.
Definitions
The degree of severity of COVID‑19 (severe vs nonsevere) was defined according to the American Thoracic Society guidelines for community‑acquired pneumonia.14 Briefly, severe COVID‑19 should reach either 1 major criterion or 3 or more minor criteria. Minor criteria included respiratory rate more than 30 breaths per minute, the ratio of oxygen arterial pressure to oxygen inspiratory fraction lower than 250, multilobar infiltrates confusion or disorientation, blood urea nitrogen level more than 7.1 mmol/l, white blood cell (WBC) count less than 4 × 10⁹/l, platelet count less than 100 × 1012/l, core temperature lower than 36 ºC, hypotension requiring aggressive fluid resuscitation. Major criteria included septic shock with need for vasopressors, or mechanical ventilation. Fever was defined as axillary temperature of at least 37.3 ºC. Sepsis and septic shock were defined according to the 2016 Third International Consensus Definition for Sepsis and Septic Shock.15 Acute kidney injury was diagnosed according to the Kidney Disease: Improving Global Outcomes clinical practice guidelines16 and acute respiratory distress syndrome (ARDS) was diagnosed according to the Berlin Definition.17 Acute cardiac injury was diagnosed if serum levels of cardiac biomarkers (eg, high‑sensitive cardiac troponin I) were above the 99th percentile upper reference limit, or if new abnormalities were shown on electrocardiography and echocardiography.6
Statistical analysis
Patients were divided into 3 groups, nonsevere, severe‑alive, and severe‑dead, according to the criteria mentioned above. All continuous variables are presented as mean (SD) or medians (interquartile range [IQR]), as appropriate. Categorical data were summarized as number and percentage. Patient characteristics across the degree of severity of COVID‑19 were compared using analysis of variance or the Kruskal–Wallis test for continuous variables and the χ2 or the Fisher exact test for categorical variables. To explore the risk factors associated with the risk of progression to severe disease or death, logistic regression analysis was conducted to estimate odds ratios (ORs) and 95% CI. Considering the total number of severe cases (n = 25) and deaths (n = 12) in this study and to avoid overfitting in the model, 2 variables were chosen for multivariable analysis on the basis of previous findings and clinical constraints.10,12,18,19 We excluded variables from the univariable analysis if their between‑group differences were not significant, if the number of events was too small to calculate odds ratios, and if they had collinearity with the SOFA score. A 2‑sided α of less than 0.05 was considered statistically significant. Statistical analyses were done using the SPSS software, version 22.0 (SPSS Inc. Chicago, Illinois, United States).
Results
A total of 109 adult patients with COVID‑19 were hospitalized in the Dabieshan Medical Center from January 30, 2020 to February 11, 2020. After excluding one pregnant patient without available key information in their medical records, we included 108 inpatients in the final analysis. The degree of severity of COVID‑19 was categorized as nonsevere in 83 patients (76.9%), severe‑alive in 13 patients (12%), and severe‑dead in 12 patients (11.1%). The median (IQR) age of 108 patients with COVID‑19 was 52 (37–58) years. The severe‑dead patients (median [IQR] age, 65 [51–73.5] years) were older than severe‑alive (median [IQR] age, 56 [50.5–63.5] years) or nonsevere patients ([IQR] age, 50 [34‑56]years). The proportion of patients older than 70 years was the highest in the severe‑dead group. The median (IQR) time from illness onset to admission of all patients was 6 (4–8) days, and there was no difference among the 3 groups. Comorbidities were present in 25 patients (23.1%), with hypertension being the most common comorbidity (14.8%), followed by diabetes (4.6%). The presence of any coexisting illness was more common among patients with severe disease than among those with nonsevere disease (14.5% vs 52%; Table 1). Additionally, the advanced age, comorbidities with hypertension, higher blood leukocyte count, neutrophil count, higher sensitive C‑reactive protein level, D‑dimer level, APACHE II score, and SOFA score were associated with the development of severe COVID‑19, and so were lower lymphocyte count and albumin level (shown in supplementary material, Tables S1 and S2).
Characteristics | All patients (n = 108) | Nonsevere (n= 83) | Severe‑alive (n = 13) | Severe‑dead (n = 12) | P value | |
Data are presented as number (percentage) unless otherwise indicated.
a Any patient with bronchiectasis, chronic obstructive pulmonary disease, or asthma
b Any patient with hyperlipemia, coronary heart disease, hemorrhagic stroke, or ischemic stroke
Abbreviations: APACHE II, Acute Physiology and Chronic Health Evaluation II; COVID‑19, coronavirus disease 2019; IQR, interquartile range; NEWS2, National Early Warning Score 2; SOFA, Sequential Organ Failure Assessment; qSOFA, quick SOFA | ||||||
Age, y | Median (IQR) | 52 (37–58) | 50 (34–56) | 56 (50.5–63.5) | 65 (51–73.5) | <0.001 |
≤18 | 1 (0.9) | 1 (1.2) | 0 | 0 | – | |
19–40 | 31 (28.7) | 30 (36.1) | 1 (7.7) | 0 | 0.006 | |
41–65 | 59 (54.6) | 44 (53) | 9 (69.2) | 6 (50) | 0.52 | |
66–70 | 7 (6.5) | 5 (6.0) | 1 (7.7) | 1 (8.3) | 0.941 | |
≥70 | 10 (9.3) | 3 (3.6) | 2 (15.4) | 5 (41.7) | 0.001 | |
Sex | Male | 43 (39.8) | 30 (36.1) | 6 (46.2) | 7 (58.3) | 0.307 |
Female | 65 (60.2) | 53 (63.9) | 7 (53.8) | 5 (41.7) | – | |
Comorbidity | Any | 25 (23.1) | 12 (14.5) | 5 (38.5) | 8 (66.7) | <0.001 |
Hypertension | 16 (14.8) | 7 (8.4) | 2 (15.4) | 7 (58.3) | 0.001 | |
Diabetes | 5 (4.6) | 2 (2.4) | 2 (15.4) | 1 (8.3) | 0.166 | |
Pulmonary diseasea | 3 (2.8) | 3 (3.6) | 0 | 0 | – | |
Cardiovascular diseaseb | 4 (3.7) | 2 (2.4) | 0 | 2 (16.6) | – | |
Chronic liver disease | 2 (1.9) | 1 (1.2) | 0 | 1 (8.3) | – | |
Cancer | 2 (1.9) | 0 | 1 (7.7) | 1 (1.9) | – | |
Current smoker | 4 (3.7) | 1 (1.2) | 0 | 3 (25) | – | |
Time from symptom onset to admission, d, median (IQR) | 6 (4–8) | 5 (4–8) | 6 (4–8) | 7 (6–9) | 0.581 | |
Fever | Any | 80 (74.1) | 61 (73.5) | 11 (84.6) | 8 (66.7) | 0.574 |
37.3–38 °C | 34 (31.5) | 26 (31.3) | 6 (46.2) | 2 (16.7) | 0.274 | |
38.1–39 °C | 34 (31.5) | 27 (32.5) | 4 (30.8) | 3 (25) | 0.865 | |
>39 °C | 10 (9.3) | 6 (7.2) | 1 (7.7) | 3 (25) | 0.222 | |
Dry cough | 84 (77.8) | 65 (78.3) | 9 (69.2) | 10 (83.3) | 0.678 | |
Expectoration | 34 (31.5) | 26 (31.3) | 3 (23.1) | 5 (41.7) | 0.606 | |
Myalgia or fatigue | 28 (25.9) | 20 (24.1) | 4 (30.8) | 4 (33.3) | 0.732 | |
Dyspnea | 15 (13.9) | 6 (7.2) | 3 (23.1) | 6 (50.0) | 0.001 | |
Headache | 1 (0.9) | 1 (1.2) | 0 | 0 | – | |
Diarrhea | 8 (7.5) | 6 (7.3) | 1 (7.7) | 1 (8.3) | 0.992 | |
Heart rate, bpm, median (IQR) | 86 (79–94) | 86 (80–97) | 86 (80–87) | 78 (75–90) | 0.136 | |
Respiratory rate, breaths per minute, median (IQR) | 20 (19–21) | 20 (18–21) | 20 (19–22) | 20 (19–22) | 0.364 | |
Mean arterial pressure <65 mm Hg | 0 | 0 | 0 | 0 | – | |
NEWS2, median (IQR) | 1 (0–3) | 1 (0–2) | 2 (1–3) | 3 (0–6) | 0.197 | |
APACHE II score, median (IQR) | 4 (3–7) | 4 (2–6) | 6 (4–8) | 10 (6–19) | <0.001 | |
qSOFA score, median (IQR) | 0 | 0 | 0 (0–0.5) | 0 (0–1) | 0.936 | |
SOFA score, median (IQR) | 1 (1–2) | 1 (1–1) | 2 (1–3) | 3 (2–8) | <0.001 | |
Laboratory findings on hospital admission are summarized in Table 2. With the illness deterioration, the WBC count and neutrophil count increased gradually in severe‑dead patients. Lymphocytopenia was present in 25% of the patients. The median (IQR) lymphoid count was 1.41(1.01–1.77) × 109/l in nonsevere patients, while it decreased to less than 0.8 × 10⁹/l in severe patients. Approximately 40% patients had an elevated D‑dimer concentration on admission. Compared with nonsevere patients, the levels of D‑dimer, high sensitivity C‑reactive protein, and procalcitonin were significantly higher in patients developing severe disease. There were no differences in the levels of alanine aminotransferase, bilirubin, serum creatinine, cystatin C, creatine kinase, and creatine kinase isoenzyme‑MB among 3 groups of patients. A total of 98 patients (90.7%) had findings of bilateral infiltrates on radiographic imaging, while 10 patients (9.3%) had unilateral infiltrates.
Characteristics | All patients (n = 108) | Nonsevere (n = 83) | Severe‑alive (n = 13) | Severe‑dead (n = 12) | P value | |
Characteristics | All patients (n = 108) | Nonsevere (n = 83) | Severe‑alive (n = 13) | Severe‑dead (n = 12) | P value | |
Data are presented as number (percentage) unless otherwise indicated.
a Any patient with a chest radiograph or computed tomography of pulmonary infections manifesting single lung shadowing
b Any patient with a chest radiograph or computed tomography of pulmonary infections manifesting double lung shadowing
Abbreviations: ALT, alanine aminotransferase; CK‑MB, creatine kinase isoenzyme‑MB; hsCRP, high‑sensitivity C‑reactive protein; others, see Table 1 | ||||||
White blood cell count, × 109/l | Median (IQR) | 4.83 (3.76–6.45) | 4.65 (3.72–5.68) | 5.57 (3–9.16) | 10.53 (6.57–11.9) | <0.001 |
<4 | 32 (29.6) | 27 (32.5) | 4 (30.8) | 1 (8.3) | 0.236 | |
4–10 | 64 (59.3) | 55 (66.3) | 7 (53.8) | 2 (16.7) | 0.005 | |
>10 | 12 (11.1) | 1 (1.2) | 2 (15.4) | 9 (75) | <0.001 | |
Neutrophil count, × 109/l, median (IQR) | 2.82 (1.93–4.47) | 2.53 (1.89–3.78) | 3.33 (1.99–5.07) | 6.55 (3.39–9.66) | 0.002 | |
Lymphocyte count, × 109/l | Median (IQR) | 1.26 (0.82–1.68) | 1.41 (1.01–1.77) | 0.79 (0.64–0.95) | 0.76 (0.63–1.58) | <0.001 |
<0.8 | 23 (21.7) | 10 (12.2) | 8 (61.5) | 5 (45.5) | <0.001 | |
>0.8 | 85 (77.4) | 72 (87.8) | 6 (46.2) | 7 (58.3) | <0.001 | |
Hemoglobin, g/l, median (IQR) | 125 (116–135) | 127 (116–136) | 117 (115–130) | 124 (122–133) | 0.278 | |
Platelet count, × 109/l | Median (IQR) | 187 (139–239) | 195 (148–239) | 145 (111–193) | 159 (137–200) | 0.225 |
<100 | 10 (9.3) | 6 (7.3) | 3 (23.1) | 1 (8.3) | 0.181 | |
Normal, 100–400 | 97 (90.7) | 76 (92.6) | 10 (76.9) | 11 (91.7) | 0.181 | |
>400 | 1 (0.9) | 0 | 0 | 1 (8.3) | – | |
D‑dimer, μg/ml | Median (IQR) | 1.55 (0.71–2.88) | 1.28 (0.61–2.69) | 2.16 (0.98–2.67) | 15.89 (2.75–81.59) | <0.001 |
>1 | 40 (37) | 26 (31.3) | 5 (38.5) | 9 (75) | 0.014 | |
<1 | 68 (63) | 57 (68.7) | 8 (61.5) | 3 (25) | – | |
ALT, U/l | Median (IQR) | 20 (14–29.5) | 20 (14–30) | 23 (17.8–27.5) | 21.5 (17.5–23) | 0.66 |
>50 | 6 (5.6) | 4 (4.8) | 0 | 2 (16.7) | – | |
Normal, 0–50 | 102 (94.4) | 79 (95.2) | 13 (100) | 10 (83.3) | – | |
Albumin, g/l, median (IQR) | 38.6 (35.5–41.4) | 39.5 (37.3–42.1) | 37.7 (34.5–39.3) | 31.6 (27.8–33.8) | <0.001 | |
Bilirubin, μmmol/l | Median (IQR) | 10.1 (7.6–14.3) | 9.7 (8–13.3) | 12.7 (8.4–15) | 9.9 (7.4–21.5) | 0.69 |
>20 | 13 (12) | 7 (8.4) | 2 (15.4) | 4 (33.3) | 0.028 | |
Normal, 0–20 | 95 (88) | 76 (91.6) | 11 (84.6) | 8 (66.7) | – | |
K+, mmol/l | Median (IQR) | 4.11 (3.8–4.6) | 4.2 (3.9–4.6) | 3.6 (3.5–4) | 4.3 (3.6–4.8) | 0.033 |
>5.4 | 9 (8.3) | 7 (8.4) | 0 | 2 (16.7) | – | |
Normal, 3.8–5.4 | 78 (72.2) | 67 (80.7) | 5 (38.5) | 6 (50) | 0.001 | |
<3.8 | 21 (19.4) | 9 (10.8) | 8 (61.5) | 4 (33.3) | <0.001 | |
Na+, mmol/l | Median (IQR) | 138 (136–141) | 138 (137–141) | 136 (133–139) | 138 (137–139) | 0.078 |
136–148 | 93 (86.1) | 76 (91.6) | 7 (53.8) | 10 (83.3) | 0.002 | |
<136 | 15 (13.9) | 7 (8.4) | 6 (46.2) | 2 (16.7) | – | |
Cl, mmol/l | Median (IQR) | 96.2 (95.3–100.5) | 96 (95.3–100.3) | 96.4 (95–100.5) | 98.4 (96.5–103) | 0.201 |
>106 | 5 (4.6) | 1 (1.2) | 1 (7.7) | 3 (25) | 0.004 | |
Normal, 96–106 | 53 (49.1) | 39 (47) | 7 (53.8) | 7 (58.3) | 0.714 | |
<96 | 50 (46.3) | 43 (51.8) | 5 (38.5) | 2 (16.7) | 0.064 | |
Creatinine, μmol/l | Median (IQR) | 79.6 (67.1–95.1) | 78.8 (68.4–94.3) | 60 (54.0–84.6) | 90.5 (74.7–110.6) | 0.243 |
>133 | 4 (3.7) | 3 (3.6) | 0 | 1 (8.3) | – | |
Cystatin C, mg/l | Median (IQR) | 1.42 (1.19–1.74) | 1.38 (1.19–1.71) | 1.43 (1.28–1.89) | 1.61 (1.25–4.8) | 0.843 |
>1.2 | 80 (74.1) | 59 (71.1) | 11 (84.6) | 10 (83.3) | 0.553 | |
Normal, 0.5–1.2 | 28 (25.9) | 24 (28.9) | 2 (15.4) | 2 (16.7) | – | |
Creatine kinase, U/l | Median (IQR) | 64 (43–105.5) | 60 (42–95) | 107 (54–157.5) | 103.9 (63.5–125.7) | 0.126 |
>190 | 19 (17.6) | 12 (14.5) | 4 (30.8) | 3 (25) | 0.252 | |
Normal, 0–190 | 89 (82.4) | 71 (85.5) | 9 (69.2) | 9 (75) | 0.252 | |
CK‑MB, U/l | Median (IQR) | 16 (12.3–21.8) | 16 (13–20.5) | 14 (11–16.5) | 23.2 (15.5–29) | 0.289 |
>25 | 16 (14.8) | 10 (12) | 0 | 6 (50) | – | |
Normal, 0–25 | 92 (85.2) | 73 (88) | 13 (100) | 6 (50) | 0.002 | |
hsCRP, mg/l | Median (IQR) | 11.8 (1.02–27.9) | 6.51 (0.59–22.7) | 25.9 (16–34.8) | 39.3 (30.5–45.2) | 0.004 |
>5 | 69 (63.9) | 46 (55.4) | 12 (92.3) | 11 (91.7) | 0.003 | |
Normal, 0–5 | 39 (36.1) | 37 (44.6) | 1 (7.7) | 1 (8.3) | 0.003 | |
Procalcitonin, ng/ml | Median (IQR) | 0.2 (0.09–0.4) | 0.2 (0.06–0.3) | 0.19 (0.13–0.43) | 2.06 (0.27–5.93) | 0.002 |
≥0.05 | 61 (56.5) | 41 (49.4) | 11 (84.6) | 9 (75) | 0.022 | |
Normal, 0–0.05 | 47 (43.5) | 42 (50.6) | 2 (15.4) | 3 (25) | 0.022 | |
Unilateral pneumoniaa | 10 (9.3) | 10 (9.3) | 0 | 0 | – | |
Bilateral pneumoniab | 98 (90.7) | 73 (67.6) | 13 (100) | 12 (100) | 0.293 | |
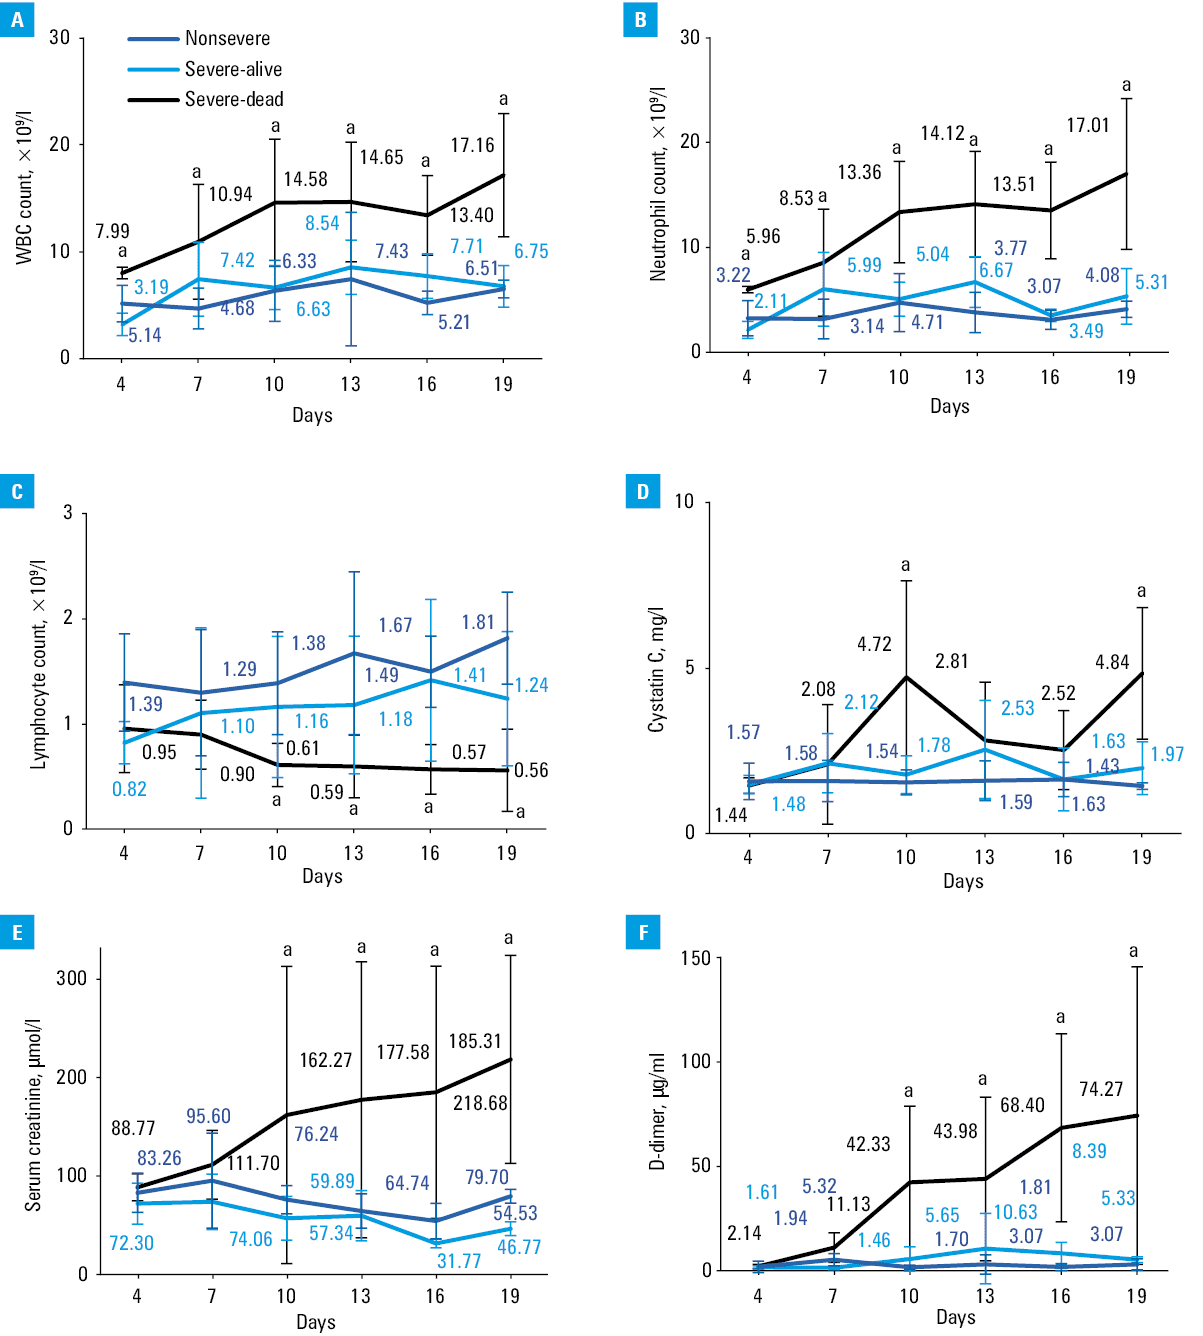
The main laboratory markers were tracked from day 4 to day 19 after the onset of disease at 2‑day intervals (Figure 1). Data from 65 patients (44 nonsevere, 11 severe‑alive, and 10 severe‑dead) with complete data were analyzed. The baseline lymphocyte count in nonsevere patients was significantly higher than severe‑alive and severe‑dead patients, and the lymphocyte count increased gradually in nonsevere patients and severe‑alive patients during hospitalization. However, the lymphocyte count decreased gradually in severe‑dead patients, which was significantly less than 0.8 × 10⁹/l from day 10 after illness onset and continued to decrease until death. The WBC count, neutrophil count, levels of D‑dimer and serum creatinine showed a significant rising trend during hospitalization in severe‑dead patients compared with nonsevere or severe‑alive patients. There were no differences between the levels of cystatin C in all 3 groups on admission, but it showed a significant increase in severe‑dead patients on 10 days and 19 days after the onset of COVID‑19.
All 108 patients received antivirals, which was single or combined used, including α-interferon (50 μg twice daily, atomize orally), abidol (0.2 g twice daily, orally), and lopinavir/ritonavir tablets (500 mg twice daily, orally). More patients received corticosteroids, immunoglobulins, and antibiotics in severe group than nonsevere group. The development of sepsis, septic shock, and ARDS in severe patients was higher than in nonsevere patients, and so were acute kidney injury and myocardial injury. The median (IQR) time from illness onset to discharge or death was 18 (16–21) days in nonsevere patients, 32 (28–33) days in severe‑alive patients, and 25 (22–31) days in severe‑dead patients (Table 3).
Treatments and prognosis | All patients (n = 108) | Nonsevere (n = 83) | Severe‑alive (n = 13) | Severe‑dead (n = 12) | P value | |
Data are presented as number (percentage) unless otherwise incidated.
Abbreviations: AKI, acute kidney injury; ARDS, acute respiratory distress syndrome; CRRT, Renal replacement therapy; ECMO, extracorporeal membrane oxygenation; HFNO, high‑flow nasal cannula oxygen; ICU, intensive care unit; MV, invasive mechanical ventilation; NIV, noninvasive mechanical ventilation; others, see Table | ||||||
Treatment | Antiviral treatment | 108 (100) | 83 (100) | 13 (100) | 12 (100) | – |
Corticosteroids | 30 (27.8) | 10 (12) | 10 (76.9) | 10 (83.3) | <0.001 | |
Intravenous immunoglobin | 12 (11.1) | 3 (3.6) | 6 (46.2) | 3 (25) | <0.001 | |
Antibiotics | 48 (44.4) | 26 (31.3) | 10 (76.9) | 12 (100) | <0.001 | |
Respiratory therapy | Nasal or mask oxygen | 27 (25) | 20 (24.1) | 7 (53.8) | 0 | 0.003 |
HFNO therapy | 4 (3.7) | 0 | 4 (30.8) | 0 | – | |
NIV | 4 (3.7) | 0 | 2 (15.4) | 2 (16.7) | – | |
MV | 10 (9.3) | 0 | 0 | 10 (83.3) | – | |
CRRT | 1 (0.9) | 0 | 0 | 1 (8.3) | – | |
ECMO | 0 | 0 | 0 | 0 | – | |
Prognosis | Sepsis | 35 (32.4) | 17 (20.5) | 7 (53.8) | 11 (91.7) | <0.001 |
Septic shock | 6 (5.6) | 0 | 0 | 6 (50) | – | |
ARDS | 45 (41.7) | 20 (24.1) | 13 (100) | 12 (100) | <0.001 | |
AKI | 16 (14.8) | 7 (8.4) | 2 (15.4) | 7 (58.3) | <0.001 | |
Acute cardiac injury | 8 (7.2) | – | 2 (15.4) | 6 (50) | – | |
ICU admission | 17 (15.7) | 0 | 5 (38.5) | 12 (100) | <0.001 | |
Time from symptom onset to septic shock, d, median (IQR) | 20 (17–24) | – | – | 20 (17–24) | – | |
Time from symptom onset to ARDS, d, median (IQR) | 7 (5–9) | 7 (4–8) | 8 (6–11) | 7 (4–7) | 0.176 | |
Time from symptom onset to MV, d, median (IQR) | 15 (11–18) | – | – | 15 (11–18) | – | |
Time from symptom onset to AKI, d, median (IQR) | 7 (6–8) | 6 (6–8) | 7 (7–8) | 7 (6–10) | 0.443 | |
Time from symptom onset to acute cardiac injury, d, median (IQR) | 12 (11–14) | – | – | 12 (11–14) | – | |
Time from symptom onset to ICU admission, d, median (IQR) | 13 (10–17) | – | 12 (8–13) | 16 (11–19) | 0.221 | |
Time from symptom onset to discharge or death, d, median (IQR) | 19 (16–25) | 18 (16–21) | 32 (28–33) | 25 (22–31) | <0.001 | |
Multivariable logistic regression analysis revealed that higher SOFA score (OR, 2.45; 95% CI, 1.302–4.608; P = 0.005) and lymphocyte count less than 0.8 × 10⁹/l (OR, 9.017; 95% CI, 2.808–28.857; P <0.001) on admission were associated with increased odds of severe COVID‑19 (Table 4). Additionally, higher SOFA score (OR, 2.402; 95% CI, 1.313–4.395; P = 0.004) on admission was the independent risk factor for death (Table 5).
Risk factors | OR | 95% CI | P value |
Abbreviations: OR, odds ratio; others, see Table 1 | |||
SOFA | 2.45 | 1.302–4.608 | 0.005 |
Lymphocyte count <0.8 × 10⁹/l | 9.017 | 2.808–28.957 | <0.001 |
Discussion
This is a retrospective cohort study focusing on the risk factors associated with severe COVID‑19. A total of 108 adults hospitalized with COVID‑19 from January 31, 2020 to March 10, 2020 were included in this retrospective cohort study. In particular, advanced age, comorbidities with hypertension, higher blood leukocyte count, neutrophil count, higher sensitive C‑reactive protein level, D‑dimer level, APACHE II score, and SOFA score were more commonly seen in patients with severe COVID‑19, and so were lower lymphocyte count and albumin level.
In the current study, higher SOFA scores at admission were also identified as an independent predictor for developing severe SARS‑CoV‑2 infection. The SOFA score was a morbidity severity score and was originally designed to focus on organ dysfunction and morbidity. It includes 6 variables, each representing an organ system.10 But now, many studies have found that SOFA score can well predict the severity and outcome of the disease.21,22 SOFA score is also used to be a good diagnostic marker for sepsis and septic shock.15 Of 108 patients, 35 (32.4%) developed sepsis, and 6 (5.6%) developed septic shock. Additionally, the incidence of septic shock was as high as 50% in those who died. The result suggested that early organ dysfunction may be related to poor prognosis. In Zhou et al,12 higher SOFA score was reported to be associated with increased odds of death. Therefore, the early organ dysfunction in patients with COVID‑19 should be considered with more attention and monitored closely. The APACHE II score is also an illness severity score and mortality estimation tool used widely in intensive care unit.23 In our study, the APACHE II score in severe group was higher than in the nonsevere group, and the difference was significant. Due to a small number of cases, the score was not included in the final multivariate regression analysis. Compared with the SOFA and APACHE II scores, the evaluation of NEWS and qSOFA was more convenient and fast,24 and indeed did not need laboratory examination. However, in our study, these 2 scores did not show their advantages, and there was no significant difference between the severe and nonsevere groups with COVID‑19 at the time of admission.
Lymphocytopenia on admission was another risk factor associated with severe COVID‑19 infection in this study. In the dynamic profile of laboratory markers as shown in Figure 1, we found that absolute lymphocyte counts decreased to similarly low levels in severe‑alive and severe‑dead patients at the onset of COVID‑19, while absolute lymphocyte counts in severe‑dead patients remained persistently low while severe‑alive patients experience lymphocyte recovery. Additionally, WBC and neutrophil counts were significantly higher in nonsurvival patients with COVID‑19. The findings were consistent with the results of 2 recent COVID‑19‑related studies.12,25 Lymphocytopenia is a common feature in patients with COVID‑19. In a recent study by Guan et al,5 lymphocytopenia was present in 147 patients (96.1%) with severe COVID‑19.Lymphocytopenia might serve as a biomarker for infection‑induced immunosuppression and was a critical factor associated with some disease severity and mortality. Studies have shown that persistent lymphocytopenia in sepsis predicts early and late mortality.26,27 The initial fall in circulating lymphocytes at the onset of SARS‑COV‑2 infection might be related to separate processes. Firstly, lymphocytes were recruited out of the peripheral circulation to areas of infection and inflammation. The autopsy report from patients with COVID‑19 showed the pathological changes of both lungs were interstitial exudation mainly composed of lymphocytes.28 And secondly, SARS‑CoV‑2 might, similarly to SARS and MERS, induced a number of stimuli that trigger lymphocyte apoptosis.18,29 The exact mechanism of lymphocytopenia warrants further studies.
In our study, patients with severe disease were significantly older than nonsevere patients, and had more comorbidities. This suggests that patients who were older and had underlying disease were at a higher risk of severe illness. This finding has been widely confirmed in several previous studies related to COVID‑19.9-11 In previous SARS and MERS studies, older age related to death may be due to less robust immune responses.30 Some animal studies also confirmed that older animals developed more severe responses to virus infections because of the senescence changes to the immune system.31 Further studies are needed to investigate how the immune system responds to viral attacks in the elderly.
In this study, more than 70% of patients had increased cystatin C levels on admission. There were no significant differences with regard to those levels among 3 groups on admission; however, they showed a significant increase in severe‑dead patients about 10 days after the onset of COVID‑19. Additionally, the level of cystatin C levels did not return to normal in most of the cured cases at the time of discharge. The cystatin C level was not affected by age, gender, muscle mass, inflammation, and other factors. As a result of good specificity and sensitivity, cystatin C appeared to be more reliable in predicting acute kidney injury (AKI) than serum creatinine.32-34 It suggested that the extensive renal damage may be present in patients with COVID‑19. Additionally, regular monitoring of renal function in discharged patients might be necessary. This would help us to fully evaluate the damage to the kidney caused by the virus.
In our cohort of 108 patients with COVID‑19, 14.8% of patients had AKI and 7.2% had acute cardiac injury. The incidence of complications in patients with COVID‑19 reported in several recently published clinical studies was different, ranging from 0.5% to 29% of AKI,5,12,25,35 1% to 17% of acute cardiac injury,12,25 and the incidence was significantly higher in severe or dead patients than nonsevere patients. The currently available evidence revealed that 2019‑nCoV receptor‑binding domain has a stronger interaction with angiotensin converting enzyme 2 (ACE2).36 In addition to pulmonary AT2 cells and respiratory epithelial cells, which exhibit high ACE2 expression, also AT2 cells, proximal tubule cells of kidney, myocytes, vascular endothelial cells, and gastrointestinal system also have high ACE2 expression.37 In addition to the direct attack on the target organ by SARS‑CoV‑2, immune mediated organ injury was also one of the main causes of multiple organ dysfunction, including ARDS, acute cardiac injury, acute kidney injury and gastrointestinal injury.
This study has some notable limitations. First, since the retrospective study design, not all patients could have been continuously tested. Since the whole course of illness could not be evaluated dynamically, we could not find the effect of changes of some important indexes with time on the prognosis of COVID‑19. Unfortunately, dynamic monitoring is more meaningful for disease assessment and prediction. Second, this is a single‑center study with limited sample size. To avoid overfitting in the multivariable logistic regression models, only 2 variables were chosen for the analysis. A global multicenter study of patients with COVID‑19 would help to fully understand the new disease in humans. And last but not least, there is no assessment of the effect of SARS‑CoV‑2 on discharged patients during follow‑up, although patients in this study were thought to have definite outcomes. So far, the duration of SARS‑CoV‑2 RNA shedding has not been well characterized. Therefore, a further follow‑up study is needed.
In conclusion, the higher SOFA score and lymphocyte count less than 0.8 × 10⁹/l on admission were associated with greater risk of developing severe COVID‑19. Therefore, high‑risk patients should receive more attention, should be monitored more closely, and treated in a timely manner, which may help to improve the prognosis.
- Gao Y, Li T, Han M, et al. Diagnostic utility of clinical laboratory data determinations for patients with the severe COVID‑19. J Med Virol. 2020 Mar 17. . | Crossref
- Lu R, Zhao X, Li J, et al. Genomic characterisation and epidemiology of 2019 novel coronavirus: implications for virus origins and receptor binding. Lancet. 2020; 395: 565‑574.
- Zumla A, Hui DS, Perlman S. Middle East respiratory syndrome. Lancet. 2015; 386: 995‑1007. | Crossref
- Baud D, Qi X, Nielsen‑Saines K, et al. Real estimates of mortality following COVID‑19 infection. Lancet Infect Dis. 2020 Mar 12. . | Crossref
- Guan WJ, Ni ZY, Hu Y, et al. Clinical characteristics of coronavirus disease 2019 in China. N Engl J Med. 2020; 382: 1708‑1720.
SUPPLEMENTARY MATERIAL
ARTICLE INFORMATION