Efficacy of family history, genetic risk score, and physical activity in assessing the prevalence of type 2 diabetes
Key words: genetic risk, physical activity, type 2 diabetes


 CC BY-NC-SA 4.0
Efficacy of family history, genetic risk score, and physical activity in assessing the prevalence of type 2 diabetes
Introduction: Environmental and genetic factors play an important role in the development of type 2 diabetes (T2D). One of the most important lifestyle factors is a low level of physical activity (PA), but no studies have explicitly compared the amount of variation in diabetes prevalence explained by variation in PA compared with the amount explained by genetic variation.
Objectives: We examined associations between PA and patients stratified by the levels of genetic susceptibility to T2D and the prevalence of the disease.
Patients and methods: We assessed the level of PA and family history (FH) of T2D in first‑degree relatives as well as calculated the genetic risk score (GRS). We examined associations of PA, GRS, and FH with the prevalence of T2D among 1195 individuals enrolled in the 1000 Polish Longitudinal University Study (1000‑PLUS) by stratifying the sample according to GRS, FH, and PA.
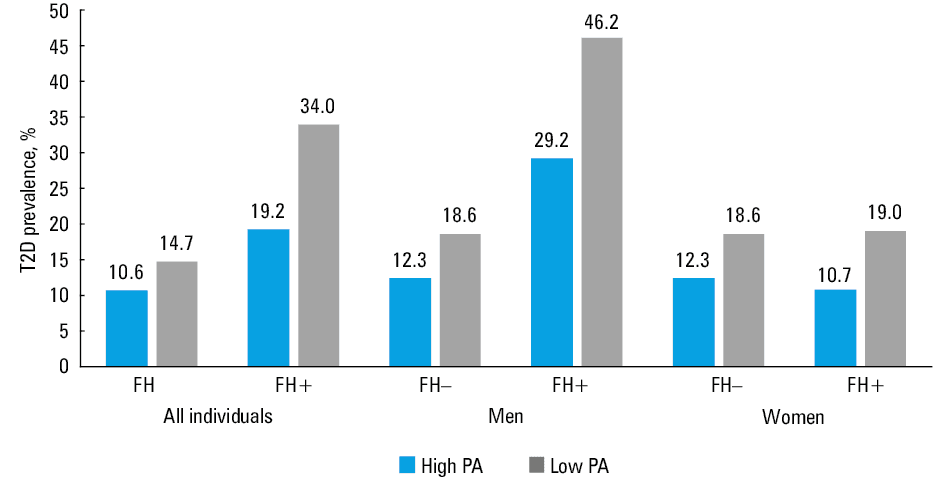
Results: We found that FH, in contrast to GRS, was positively associated with a higher prevalence of T2D (23.4% in patients with positive FH [FH+], 11.6% in those with negative [FH–]; P <0.001), with the association being stronger in men than in women. The prevalence of T2D was slightly lower among physically active individuals in the FH– group (10.6% in high PA vs 14.7% in low PA) as well as in the FH+ group (19.2% in high PA vs 34.0% in low PA), but the differences were not significant. Similar results were found for high and low GRSs.
Conclusions: We confirmed that PA is significantly associated with glucose homeostasis parameters and T2D prevalence, and that this association may be stronger in individuals who are more genetically predisposed to diabetes.
Introduction
Diabetes, called the epidemic of the 21st century, is one of the major health challenges in modern medicine. According to current estimates, the number of people affected by this disease reaches 425 million worldwide, and it is expected to increase to 629 million by 2045.1 The International Diabetes Federation reported that diabetes is among the top 10 causes of death globally and estimated that the total healthcare expenditure on diabetes in 2017 reached 727 billion USD.1 About 85% to 95% of all diabetes cases are type 2 diabetes (T2D), closely related to obesity and insulin resistance. The exact pathogenesis of T2D is still unclear; however, it is known that both environmental and genetic factors are involved.
The rapid development of genome‑wide association studies in the last decade has facilitated the identification of more than 100 susceptibility loci for T2D.2 These discoveries resulted in dissemination of the genetic risk scores (GRSs), combining information from multiple single nucleotide polymorphisms (SNPs) into a summary measure of a genetic risk, as a tool for identifying individuals at high risk of developing T2D. Despite that, the identified loci explain less than 20% of the observed heredity,3 thus questioning the usefulness of the GRS in predicting the risk of T2D.4
Family history (FH) of diabetes is a common genetic risk predictor comprising both genetic and environmental components contributing to T2D risk. It can be easily assessed as part of the medical history and used in clinical practice as a parameter reflecting, even partially, individual genetic predisposition to T2D. People with the first‑degree family history of T2D have a higher risk of developing the disease compared with those without T2D in the family, and present reduced basal energy expenditure and decreased insulin sensitivity long before developing signs of clinical diabetes.5,6
One of the best‑known environmental factors predisposing to the development of the disease is a low level of physical activity (PA). Numerous studies have confirmed that increased PA is associated with a lower risk of T2D and has positive therapeutic effects in diabetic patients.7 It has been shown that lifestyle interventions such as PA can reduce the risk of T2D development in high‑risk patients by 50% or more.8,9 Moreover, PA also positively impacts glycemic control in type 1 diabetes, which results in improving multiple comorbid complications, for example, by benefiting diferrent central nervous system functions, such as olfaction.10 However, it is still unknown whether lifestyle interventions for T2D prevention are more effective if implemented on the basis of underlying genetic risk.
Since the etiology of T2D is known to involve both environmental and genetic factors, the central aim of this study was to compare the prevalence of T2D between subgroups of individuals with high and low levels of PA and genetic predisposition among the population of the 1000 Polish Longitudinal University Study (1000‑PLUS). Here, we captured genetic predisposition in 2 ways: 1) by evaluating FH and 2) by calculating the GRS. We then looked for significant associations between PA, GRS, and FH and the prevalence of T2D.
Patients and methods
Study design and population
We used data from a cross‑sectional study, 1000‑PLUS, described in detail previously.11 Briefly, the studied sample comprised 2000 Caucasian individuals aged 18 to 78 years and randomly selected from the general population of Białystok municipality (Poland). The study was conducted at Clinical Research Centre, Medical University of Bialystok (Poland). In the present analysis, we included 1192 individuals with complete baseline information and available genotyping data. Patients with previously diagnosed diabetes were excluded from the study to avoid confounding the cross‑sectional association between the presence of diabetes and the level of PA. Individuals were classified as having T2D only if diagnosed during an oral glucose tolerance test (OGTT), without previous history of diabetes and medication use. All participants provided written informed consent, and the study was conducted in accordance with the ethical standards of the institutional research committee and with the 1964 Declaration of Helsinki and its later amendments. The study was approved by the local ethics committee of the Medical University of Bialystok (No.: R‑I‑002/290/2008/2009 and R‑I‑002/35/200).
Phenotyping
Assessing glucose homeostasis and lipid profiling
All individuals underwent a 75‑gram OGTT, with plasma glucose (PG) and insulin concentrations measured at 0, 30, 60, and 120 minutes, as well as fasting measurements of total cholesterol, triglycerides, high‑density lipoprotein cholesterol (HDL‑C), and low‑density lipoprotein cholesterol (LDL‑C). To exclude type 1 diabetes or latent autoimmune diabetes of adults, antibodies against glutamic acid decarboxylase, tyrosine phosphatase, and zinc transporter 8 were measured using an enzyme‑linked immunosorbent assay (EUROIMMUN AG, Lübeck, Germany), and antibodies against insulin were measured using a radioimmunoassay (EUROIMMUN AG). In all diabetic patients, the results of antibody testing were negative, confirming T2D. Plasma insulin levels were measured in duplicate with an immunoradiometric assay (DIAsource ImmunoAssays SA, Nivelles, Belgium). Plasma glucose, serum triglycerides, total cholesterol, HDL‑C, and LDL‑C concentrations were measured using the colorimetric method with Cobas c111 (Roche Diagnostics, Basel, Switzerland). The concentration of glycated hemoglobin A1c (HbA1c) was measured by high‑performance liquid chromatography (Bio‑Rad VARIANT, Bio‑Rad Laboratories, Hercules, United States).
Type 2 diabetes was diagnosed based on glucose concentrations during the OGTT, according to the Diabetes Poland criteria: 120‑minute PG ≥200 mg/dl (11.1 mmol/l) and/or fasting PG ≥126 mg/dl (7.0 mmol/l).12 To evaluate insulin resistance, the homeostatic model assessment for insulin resistance (HOMA‑IR) was calculated: HOMA‑IR = fasting insulin (μU/ml) × fasting glucose (mmol/l)/22.5. To evaluate β-cell function, the homeostatic model assessment of β-cell function (HOMA-β) was calculated: HOMA-β = (20 × fasting insulin [μU/ml])/(fasting glucose [mmol/l]) – 3.5).13
Anthropometric measurements
We collected anthropometric data using standard methods. Body height and weight were measured using a column scale with a stadiometer, and body composition was determined using a multi‑frequency bioelectrical impedance analyzer (InBody 220, Biospace, Seoul, South Korea). The following parameters were estimated and included in the analyses: body fat mass, percent body fat, skeletal muscle mass (SMM), and skeletal muscle percentage (SM% = SMM/weight). Body mass index (BMI) was calculated as weight in kilograms divided by the square of height in meters.
Physical activity
Physical activity was assessed using the Polish version of the International Physical Activity Questionnaire – Long Form (IPAQ‑LF),14 one of the most common PA questionnaires worldwide, suitable for PA surveillance within a study population. It was developed and validated internationally, demonstrating good test‑retest reliability (approximate level of the Spearman coefficient at 0.8). This questionnaire assesses PA of moderate and vigorous intensity in metabolic equivalents (MET) × minutes per week in various domains of everyday life: at work, while traveling, doing housework or leisure activities, and sports. All individuals taking part in our present study completed a paper version of the IPAQ‑LF during a visit to our center. Completed questionnaires were processed in accordance with the guidelines provided by the authors of the IPAQ‑LF.15
Due to the limited validation of the IPAQ categorization of PA based on the results of the questionnaire in the Polish population and evidence that the original classification of PA does not meet the requirements for countries with a higher level of PA among citizens,16 we decided to classify individuals as presenting “high” or “low” PA by using quartiles of the PA (MET × min/wk). The first quartile was classified as “low PA”; the second and third quartiles, as “average PA”; and the fourth quartile, as “high PA.”
Diet assessment
Participants were asked to keep a detailed record of their diet for a “typical” and continuous 3‑day period. They were instructed not to change their dietary patterns during the monitored period and to provide as much information about meals as possible. Diet records were then analyzed using the Dieta 4.0 software (National Food and Nutrition Institute, Warsaw, Poland).17 Collected data included an average daily intake of proteins, carbohydrates, and fat (both mass and percent of macronutrient intake), as well as an average daily energy intake (DEI).
Family history of diabetes
Family history of diabetes was determined by a questionnaire in the assistance of trained research technicians. All participants were asked to answer questions about any cases of diabetes in their family, relatives’ age at diagnosis, as well as treatment and type of diabetes (if known). Individuals with a diabetic mother, father, or sibling who was diagnosed when 30 years or older (or younger but with confirmed T2D history) were considered to have a positive family history of T2D (FH+). Patients without a first‑degree relative with T2D were classified as presenting a negative family history of T2D (FH–).
Genotyping
Genetic risk score calculation
In the studied 1000‑PLUS population,11 the set of 100 SNPs associated with features of metabolic syndrome were genotyped, selected on the basis of available data by September 2018. In the present study, we selected all available top‑ranked SNPs from loci reaching genome‑wide significance in association with T2D in European‑descent populations (GoT2D18 and DIAGRAM19,20 consortia data) genotyped in the 1000‑PLUS population, including TCF7L2, KCNJ11, PROX1, MC4R, SLC30A8, and FTO loci (detailed information about selected SNPs are provided in Supplementary material, Table S1).
DNA was extracted from peripheral blood leukocytes using the high‑salt method. SNPs were genotyped using TaqMan SNP technology from human assay libraries (Applied Biosystems, Foster City, United States) and from high throughput genotyping – OpenArray from Life Technologies (Carlsbad, United States). The alleles were determined using the OpenArray sequence detection system. Negative control samples without template were used to measure the false‑positive rate. All samples were genotyped twice for quality‑control purposes. Ambiguous genotypes were regenotyped using the same genotypic system and conditions. To maximize the sample size, missing genotypes were imputed using the mean value based on the overall risk allele frequency for the respective SNPs. We examined all SNPs that contributed to the GRS to determine any significant linkage disequilibrium (LD) using the D’ measure. After taking the distance threshold equal to 500 kb, we found 3 candidate pairs of SNPs. The cutoff threshold was implemented as in a study by Gabriel et al,21 with D’ exceeding 0.98 considered to identify LD. However, in our case, no LD was detected. The studied genotype distributions were in Hardy–Weinberg equilibrium (P >0.05).
Individual SNP genotypes were coded 0, 1, or 2 according to the number of T2D risk alleles for that particular SNP. The unweighted GRS (uGRS) for each individual was constructed by summing the number of risk alleles (in case of nonmissing values) and imputed values. The weighted GRS (wGRS) was calculated as a weighted sum of risk alleles (or imputed values), with weights corresponding to the respective SNP effect size as estimated in previous meta‑analyses18,20 (Supplementary material, Table S1). Nineteen SNPs were included in the calculation of both types of GRS. Since GRS is a continuous measure, to classify individuals as being “genetically susceptible” and “genetically nonsusceptible,” the sample was divided into the high‑GRS group (fourth quartile of GRS) and low‑GRS group (first quartile of GRS).
Statistical analyses
Descriptive statistics including median and interquartile ranges were calculated for selected clinical measurements, hereafter called “features,” since many exhibited leptokurtic departures from normality. To determine whether the distributions of features significantly differed between the defined groups, either the 1‑way analysis of variance model22 was fitted or the nonparametric Wilcoxon rank‑sum test23 was applied. The choice of an appropriate method was made upon fulfilling the normality and the homogeneity of variance assumptions, and in case of violation of at least one of the conditions, the nonparametric approach was employed. The normality of features’ distribution was confirmed with the Shapiro–Wilk test,24 and the homogeneity of variances, with the Levene test.25 Due to multiple testing, obtained P values were subjected to a false discovery rate (FDR) P value adjustment procedure.26 Generalized linear models with the logit link function were constructed to determine the dependency between selected features and chosen outcome variable (eg, T2D). A contingency analysis was performed, which consisted of constructing exact confidence intervals and associated P values, both obtained with the use of the mid-P method,27 and used to assess whether there was a significant relationship between selected categorical variables. Also, median unbiased estimator (mid-P) of odds ratios was calculated. All calculations were carried out in the R software environment (RStudio, Boston, United States).28 An α significance level equal to 0.05 was set for all calculations.
Results
Effects of physical activity on metabolic parameters
We compared patients with high and low level of PA (Table 1). Participants with high PA had lower BMI and body fat content, lower fasting and 2‑hour PG, lower fasting insulin and triglyceride concentrations, higher HDL‑C concentrations and lower HOMA‑IR, as well as higher skeletal muscle content. We found no significant differences in HOMA-β, HbA1c, total cholesterol and LDL‑C concentrations between groups.
Parameter | Low PA (n = 298) | High PA (n = 298) | P valuea | ||
Median | IQR | Median | IQR | ||
a Wilcoxon rank‑sum test
SI conversion factors: to convert glucose to mmol/l, multiply by 0.0555; insulin to pmol/l, multiply by 6.0; TC to mmol/l, multiply by 0.0259; HDL‑C to mmol/l, multiply by 0.0259; LDL‑C to mmol/l, multiply by 0.0259; and TG to mmol/l, multiply by 0.0113.
Abbreviations: BFM, body fat mass; BMI, body mass index; FPG, fasting plasma glucose; HbA1c, glycated hemoglobin A1c; HDL‑C, high‑density lipoprotein cholesterol; HOMA-β, homeostatic model assessment of β-cell function; HOMA‑IR, homeostatic model assessment of insulin resistance; IQR, interquartile range; LDL‑C, low‑density lipoprotein cholesterol; PA, physical activity; PBF, percent body fat; PG, plasma glucose; SMM, skeletal muscle mass; SM%, skeletal muscle percentage; TG, triglycerides; wGRS, weighted genetic risk score | |||||
Age, y | 40.13 | 27.39–56.13 | 37.97 | 26.59–51.13 | 0.06 |
BMI, kg/m2 | 29.91 | 24.80–33.38 | 26.47 | 23.90–29.85 | 0.002 |
BFM, kg | 26.43 | 19.74–37.67 | 20.52 | 13.43–29.19 | <0.001 |
PBF, % | 32.1 | 25.8–40.1 | 26.5 | 19.3–34.9 | <0.001 |
SMM, kg | 31.45 | 24.80–37.7 | 34.55 | 26.98–38.88 | 0.003 |
SM% | 37.5 | 32.9–41.2 | 41.3 | 35.6–45.7 | <0.001 |
FPG, mg/dl | 96 | 88–107 | 93 | 86–100 | 0.005 |
2‑hour PG, mg/dl | 96 | 81.50–116.5 | 88 | 74–108 | <0.001 |
Fasting insulin, μU/ml | 11.1 | 7.54–17.53 | 9.32 | 6.94–14.51 | 0.002 |
HOMA-β, % | 128 | 78.8–210.1 | 114.4 | 83.0–172.3 | 0.21 |
HOMA‑IR | 2.62 | 1.76–4.43 | 2.15 | 1.46–3.48 | 0.001 |
HbA1c, % | 5.5 | 5.1–5.9 | 5.4 | 5.0–5.7 | 0.06 |
TC, mg/dl | 188 | 164.8–218 | 182 | 155.0–215 | 0.10 |
LDL‑C, mg/dl | 108.4 | 85.35–133.4 | 101.8 | 79.90–131.7 | 0.13 |
HDL‑C, mg/dl | 55 | 45–67 | 58 | 50.30–67 | 0.02 |
TG, mg/dl | 112 | 74–163 | 85 | 59–132 | <0.001 |
wGRS | 20.53 | 18.33–22 | 20.11 | 18.49–22.18 | 0.27 |
Association between family history of type 2 diabetes and clinical characteristics
The characteristics of the study group after classification into FH+ and FH– of T2D are shown in Table 2. The median age of T2D diagnosis in first‑degree relatives was 57 years (interquartile range, 49–68 years). We observed differences in almost all tested features of glucose homeostasis and metabolic syndrome. The FH+ group had significantly higher body fat mass and percent body fat, higher fasting and 2‑hour PG concentrations, fasting insulin, HOMA‑IR, and HbA1c, and lower SM%. There were no significant differences in HOMA-β, total cholesterol, LDL‑C, HDL‑C, and triglyceride levels, average daily energy intake, average daily intake of proteins, fat, and carbohydrates, as well as PA measured as MET × min/wk.
Parameters | FH– (n = 858) | FH+ (n = 334) | P valuea | ||
Median | IQR | Median | IQR | ||
a Wilcoxon rank‑sum test
SI conversion factors: see Table 1
Abbreviations: DEI, daily energy intake; FH, family history; MET, metabolic equivalents; T2D, type 2 diabetes; others, see Table 1 | |||||
Age, y | 46.31 | 26.29–53.6 | 49.38 | 34.59–57.13 | 0.05 |
BMI, kg/m2 | 27.87 | 23.93–30.66 | 28.59 | 24.62–32.34 | 0.18 |
BFM, kg | 25.60 | 15.32–31.21 | 27.27 | 19.35–34.45 | 0.02 |
PBF, % | 31.4 | 21.1–37.6 | 33.4 | 26.7–39.9 | 0.01 |
SMM, kg | 31.20 | 25.10–38.4 | 30.5 | 24.75–37.7 | 0.30 |
SM% | 38.1 | 34.2–44.1 | 36.6 | 33.2–41 | 0.01 |
FPG, mg/dl | 97 | 86–103 | 100 | 90–108 | 0.01 |
2‑hour PG, mg/dl | 96 | 75–110 | 100 | 83–118 | 0.02 |
Fasting insulin, μU/ml | 9.66 | 6.87–14.74 | 11.72 | 8.07–16.63 | 0.002 |
HOMA-β, % | 110.8 | 80.3–187.7 | 113.2 | 78.8–179.5 | 0.77 |
HOMA‑IR | 2.31 | 1.52–3.53 | 2.95 | 1.84–4.28 | <0.001 |
HbA1c, % | 5.5 | 5.0–5.7 | 5.7 | 5.2–6 | 0.003 |
TC, mg/dl | 195 | 160.3–216 | 192 | 167–221 | 0.72 |
LDL‑C, mg/dl | 113.20 | 81.95–131.65 | 112.2 | 84.40–139.2 | 0.99 |
HDL‑C, mg/dl | 58 | 49–68 | 54 | 48–67 | 0.14 |
TG, mg/dl | 99.50 | 64–132.5 | 108 | 73–151 | 0.05 |
Average DEI, kcal/d | 1662.76 | 1352–2297 | 1570.61 | 1273–2165 | 0.18 |
Protein intake, g/d | 79.65 | 61.96–103.96 | 75.67 | 60.19–93.73 | 0.32 |
Fat intake, g/d | 59.50 | 42.79–81.02 | 54.09 | 42.12–75.55 | 0.21 |
Carbohydrate intake, g/d | 214.69 | 173.4–285.0 | 217.05 | 166.4–271.5 | 0.41 |
Physical activity, MET × min/wk | 7413 | 3468–13979 | 7470 | 3780–13801 | 0.67 |
T2D prevalence, % | 11.6 | – | 23.4 | – | <0.001 |
wGRS | 20.45 | 18.51–21.92 | 20.63 | 19.31–22.16 | 0.27 |
We also compared the prevalence of T2D between the FH+ and FH– groups and found that it was higher in the FH+ group (23.4% vs 11.6%; odds ratio [OR], 2.32; 95% CI, 1.53–3.48l; P <0.001). Interestingly, after analyzing the prevalence in men and women separately, we observed a greater difference in men compared with women (for men: 32.6% in FH+ and 14.4% in FH–; OR, 2.86; 95% CI, 1.65–4.92; P <0.001; for women: 15.7% in FH+ and 8.8% in FH–; OR, 1.94; 95% CI, 1.09–3.68; P = 0.05).
Generalized linear models were used to test for significant associations between FH and T2D prevalence, with T2D set as the dependent variable. Our results showed a significant association between FH and T2D (OR, 4.81; 95% CI, 1.81–13.50; P = 0.002 after adjustment), both in the simple model without adjustment for other potentially important predictors (OR, 1.79; 95% CI, 1.17–2.75; P = 0.01) and in the model adjusted for independent variables such as age (OR, 1.09; 95% CI, 1.05–1.14; P <0.001), sex (OR, 7.61; 95% CI, 2.64–24.48; P <0.001), BMI (OR, 1.09; 95% CI, 1.02–1.17; P = 0.01), kcal (OR, 0.996; 95% CI, 0.992–0.998; P = 0.02), and PA (OR, 0.89; 95% CI, 0.57–1.37; P = 0.59).
Association between genetic risk scores and clinical characteristics
As shown in Table 3, none of the tested parameters showed significant differences between the low- and high‑wGRS groups, except fasting PG and HOMA-β. Individuals with high wGRS had significantly higher concentrations of fasting PG, with the mean within the reference range (<100 mg/dl), and lower HOMA-β. Similar results were obtained for uGRS (Supplementary material, Table S2), except that no difference in HOMA-β was found between the low- and high‑uGRS groups.
Parameters | Low wGRS (n = 298) | High wGRS (n = 298) | P value | ||
Median | IQR | Median | IQR | ||
a Wilcoxon rank‑sum test
SI conversion factors: see Table 1
Abbreviations: see Table 1 | |||||
Age, y | 36.81 | 27.10–52.88 | 37.85 | 27.52–53.51 | 0.69 |
BMI, kg/m2 | 26.8 | 23.98–31.78 | 27.16 | 24.29–31.55 | 0.49 |
BFM, kg | 21.23 | 15.20–34.13 | 24 | 16.89–32.09 | 0.26 |
PBF, % | 28.7 | 20.9–36.5 | 30 | 22.6–37.8 | 0.19 |
SMM, kg | 33.1 | 25.35–38.75 | 31 | 25.40–38.7 | 0.36 |
SM% | 39.7 | 34.5–44.5 | 38.9 | 34.1–43.2 | 0.19 |
FPG, mg/dl | 91 | 84–99.5 | 94 | 88–104 | 0.002 |
2‑hour PG, mg/dl | 86.7 | 74–106.75 | 91 | 74–110 | 0.13 |
Fasting insulin, μU/ml | 9.63 | 6.93–15.77 | 9.81 | 7.15–15.71 | 0.94 |
HOMA-β, % | 128.1 | 82.3–215.6 | 115.5 | 80.1–172.7 | 0.04 |
HOMA‑IR | 2.19 | 1.51–3.79 | 2.3 | 1.64–3.74 | 0.36 |
HbA1c, % | 5.4 | 5.1–5.7 | 5.4 | 5.1–5.8 | 0.3 |
TC, mg/dl | 188 | 159–218.5 | 186 | 165–211 | 0.88 |
LDL‑C, mg/dl | 105.76 | 81.45–136 | 106.50 | 82.88–129.25 | 0.58 |
HDL‑C, mg/dl | 57 | 49–67 | 58 | 49–68 | 0.55 |
TG, mg/dl | 89 | 65.25–138.2 | 94.5 | 68–135.25 | 0.50 |
Average DEI, kcal/d | 1734.80 | 1402–2349 | 1607.09 | 1319–2152 | 0.13 |
Protein intake, g/d | 81.04 | 63.88–105.69 | 82.64 | 60.19–95.44 | 0.47 |
Fat intake, g/d | 58.94 | 45.25–83.04 | 57.18 | 43.41–79.32 | 0.32 |
Carbohydrate intake, g/d | 223.32 | 170.3–287.1 | 219.04 | 169.5–280.7 | 0.54 |
Physical activity, MET × min/wk | 7621 | 3389–14771 | 7587 | 3522–13122 | 0.68 |
The prevalence of T2D was similar between the high- and low‑wGRS groups (12.5% vs 10.9%; OR, 1.17; 95% CI, 0.65–2.11; P = 0.6). We also analyzed the prevalence of T2D separately for men and women. The prevalence was slightly higher in men, but the difference was not significant (for men: 16.5% in high wGRS and 12.3% in low wGRS; OR, 1.41; 95% CI, 0.67–2.98; P = 0.37; for women: 8.3% in high wGRS and 7.5% in low wGRS; OR, 1.11; 95% CI, 0.39–3.19; P = 0.84). Similar trends were observed for uGRS.
Generalized linear models were used to test for significant associations between wGRS and T2D prevalence, with T2D set as the dependent variable. The results revealed that the association between wGRS and T2D was not significant (OR, 1.04; 95% CI, 0.87–1.26; P = 0.63 before adjustment; OR, 1.21; 95% CI, 0.83–1.80; P = 0.32 after adjustment) either for the simple model without adjustment for other potentially important predictors or for the model adjusted for independent variables such as age (OR, 1.08; 95% CI; 1.04–1.13; P <0.001), sex (OR, 6.51; 95% CI, 2.36–19.79; P <0.001), BMI (OR, 1.11; 95% CI, 1.04–1.19; P = 0.002), kcal (OR, 1.00; 95% CI, 0.9–1.11; P = 0.4), and PA (OR, 0.87; 95% CI, 0.57–1.34; P = 0.54).
Association between family history, level of physical activity, and prevalence of type 2 diabetes
The prevalence of T2D in 4 groups of patients defined by the PA level (high and low) and FH status (FH+ and FH–) is shown in Figure 1. The prevalence among physically active individuals was lower than among inactive participants in both FH groups, with the steepest decrease in the FH+ group, although the difference was not significant (FH–, P = 0.3; FH+, P = 0.11). Interestingly, when analyzing the prevalence of T2D separately for men and women, we observed that in women it was similar in the FH+ and FH– groups, with the protective effect of high PA, but the differences were not significant (for men: FH–, P = 0.26; FH+, P = 0.25; for women: FH–, P = 0.26; FH+, P = 0.44).
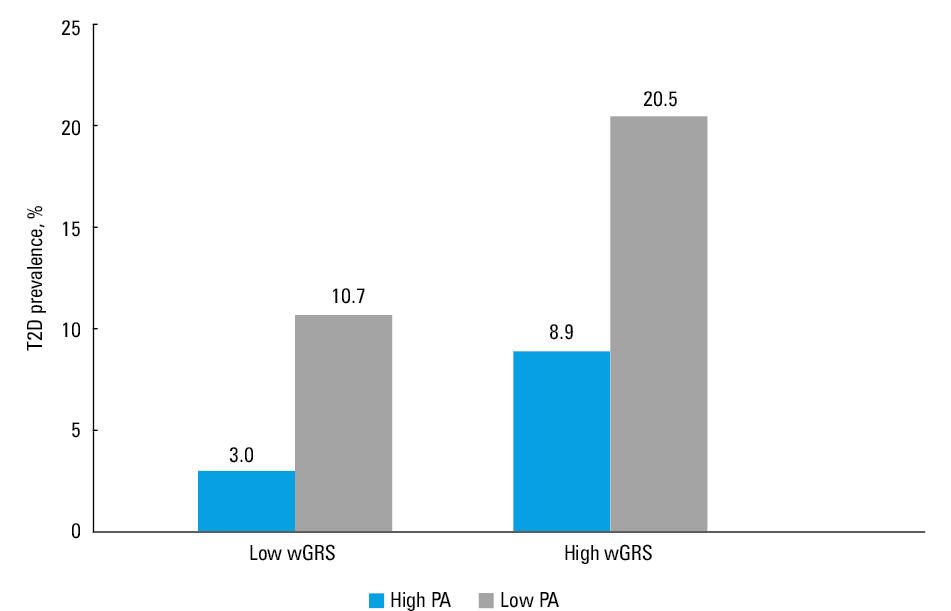
Association between genetic risk scores, level of physical activity, and prevalence of type 2 diabetes The prevalence of T2D in 4 groups of patients defined by wGRS (high and low) and PA (high and low) is shown in Figure 2. The prevalence was lower in active individuals in both wGRS groups, with the steepest decrease in the high wGRS group, but the difference was not significant. When the data were analyzed separately for men and women, the trends and differences were the same as for the whole group. We also performed the analysis for uGRS, which yielded similar results (Supplementary material, Figure S1).
Discussion
In this study, we showed that PA plays an important role in the improvement of glucose homeostasis parameters and other features of metabolic syndrome, including insulin resistance, lipid profile, and body composition. The estimated level of PA in our population was higher than that obtained in another study of the Polish population.29 However, that study also showed substantial intrapopulation variation, with the total weekly PA ranging from 700 to 800 MET × min/wk to 13700 MET × min/wk. This may indicate that our study population was slightly more physically active than a typical Polish sample. However, there is an ongoing debate concerning the interpopulation differences in PA measured by the IPAQ‑LF, as observed in Polish studies, which may result from differences between respondents who completed the questionnaire on their own and those who were interviewed.30 However, we controlled for this potential confounder by interviewing all study participants by trained personnel.
We also showed that the FH of T2D was positively associated with a higher prevalence of T2D, as well as with higher values of metabolic parameters including PG concentrations (fasting and 2‑hour), insulin resistance, BMI, body fat, and skeletal muscle content. Interestingly, the correlation between FH and T2D prevalence was more notable in men than in women. In contrast, the GRS (both weighted and unweighted) was not associated with any of the above parameters. This finding shows that FH remains a better parameter for selecting patients at high risk of T2D development than GRS. There are 2 possible explanations for this finding. First, our current knowledge of the genetic background of T2D still does not allow the development of a tool that could be used in clinical practice to predict the genetic risk of T2D. In the last decade, the expansion of genome‑wide association studies on T2D, involving an increasing number of patients from different populations and a deeper coverage of the genome, has resulted in the identification of more than 100 common variants associated with the development of the disease, but together they capture only 10% of the estimated heritability in T2D.18 This gap in knowledge, called “missing heritability,” has led to forming several novel hypotheses for the presence of other genetic determinants or the interplay of different factors, such as epigenetic interactions (especially DNA methylation and chromatin modifications) to account for the missing heritability of T2D.31 So far, studies have shown that GRSs constructed with the use of the common genetic variants still offer little improvement in T2D risk prediction compared with established T2D risk factors, including FH.32-34 The second reason might be that FH is not solely a genetic factor, as it represents a combination of shared genetic and environmental factors. However, these 2 mechanisms are the subject of an ongoing investigation in diabetes research. Based on the results from the Nurses’ Health Study and Health Professionals Follow‑up Study, Cornelis et al35 showed that shared environmental factors are responsible for 32% of the association between parental history and T2D, with the remainder due to shared genetic factors. Interestingly, also epigenetic modifications mentioned above represent an interplay between genes and the environment as these heritable changes in gene function might be modified by environmental factors, such as diet, PA, or smoking, which was shown for T2D,36,37 obesity,37 and other chronic immunometabolic diseases.38,39
It is generally known that PA protects against T2D, but it is still a matter of debate whether the effectiveness of exercise is dependent on the genetic background of patients, especially in terms of T2D development. The Diabetes Prevention Program40—one of the largest intervention studies in T2D development—has shown that there is no significant interaction between the treatment group and the genetic risk, expressed as GRS of T2D loci. These findings suggest that there is no difference in the effectiveness of treatment between individuals at high and low genetic risk,41 which is consistent with our findings. Similar results were observed in the InterAct study,42 which showed that knowing the genetic predisposition to T2D, assessed on the basis of 49 established loci for T2D, provides no indication for prescribing an intensive lifestyle intervention in high‑risk individuals.42 Conversely, Ekman et al,43 in their exercise intervention study, showed that healthy individuals with a first‑degree FH of T2D were less responsive to exercise in terms of weight, waist circumference, and VO2peak, indicating that FH background may limit the beneficial effects of exercise.
We found no differences in the prevalence of T2D between groups with high and low levels of PA in patients with or without genetic predisposition (with the use of 2 measures of genetic predisposition: GRS and FH). We observed positive effects of exercise on the prevalence of T2D even in patients with high genetic predisposition; however, the correlation was not significant. However, when comparing the effectiveness of high PA, measured as the prevalence of T2D, between FH+ and FH– (but not between low and high GRS), we found that FH+ with high PA had lower prevalence of T2D.
The strengths of our study include the use of a well clinically characterized population (including OGTT, lipid profile, and body composition analyses in all individuals), exclusion of non‑T2D cases, and detailed FH records. The limitations of our study include its cross‑sectional design, a relatively small number of individuals, the subjective measurement of PA, and the use of GRS as an indicator of genetic predisposition to T2D development.
To conclude, our finding that PA is associated with a lower prevalence of T2D, even in patients with high genetic predisposition, suggests that PA may serve as a protective factor against T2D. The present study also shows that FH of T2D in first‑degree relatives might be a useful tool in the prediction of T2D development, in contrast to GRS. The cross‑sectional design of this study limits our ability to conclude how PA and FH affect T2D progression over time, but rather our results implicate their importance for predicting the diabetic burden of a particular subpopulation of patients. This implicates the need for studies on larger samples, with a prospective design and a more objective measurement of PA aimed at a better understanding of how genetic background affects the effectiveness of lifestyle interventions. The current state of knowledge emphasizes the importance of universal rather than targeted approaches to lifestyle intervention, and this study indicates that the effectiveness of such an intervention may depend on intrinsic factors, such as genetic predisposition of patients.
- International Diabetes Federation. IDF Diabetes atlas, 8th ed. Brussels, Belgium: International Diabetes Federation, 2017; Chapter 3: The global picture: 40‑65.
- Scott RA, Scott LJ, Mägi R, et al. An expanded genome‑wide association study of type 2 diabetes in Europeans. Diabetes. 2017; 66: 2888‑2902. | Crossref
- Groop L, Pociot F. Genetics of diabetes – are we missing the genes or the disease? Mol Cell Endocrinol. 2014; 382: 726‑739. | Crossref
- Lyssenko V, Laakso M. Genetic screening for the risk of type 2 diabetes: worthless or valuable? Diabetes Care. 2013; 36 Suppl 2: S120‑S126. | Crossref
- Russell RD, Kraemer RR, Nelson AG. Metabolic dysfunction in diabetic offspring: deviations in metabolic flexibility. Med Sci Sports Exerc. 2013; 45: 8‑15. | Crossref
SUPPLEMENTARY MATERIAL
ARTICLE INFORMATION