The evolution of electrocardiographic signs of right ventricular overload after balloon pulmonary angioplasty in chronic thromboembolic pulmonary hypertension
Key words: balloon pulmonary angioplasty, chronic thromboembolic pulmonary hypertension, electrocardiography


 CC BY-NC-SA 4.0
The evolution of electrocardiographic signs of right ventricular overload after balloon pulmonary angioplasty in chronic thromboembolic pulmonary hypertension
Introduction: Balloon pulmonary angioplasty (BPA) is a treatment option for a patient with chronic thromboembolic pulmonary hypertension.
Objectives: We aimed to investigate the evolution of electrocardiographic (ECG) markers of right ventricular hypertrophy (RVH) after BPA.
Patients and methods: Standard 12‑lead ECG was performed in 41 patients with chronic thromboembolic pulmonary hypertension before the first BPA and after completion of treatment.
Results: In the whole study group, the percentage change in the pulmonary vascular resistance (PVR) after BPA correlated with the percentage change in the values of the following ECG parameters (P <0.05): axis of the QRS (rho = 0.530) and T wave (rho = 0.372); P wave in leads II (rho = 0.340) and III (rho = 0.430); S wave in lead V5 (rho = 0.634); R/S ratio in lead V5 (rho = –0.636); S wave in lead V6 (rho = 0.508); S wave in lead I (rho = 0.496). Then, the group was divided into 2 subgroups: group A, defined as a drop in PVR greater than the median value (49%) for the whole study population; and group B, defined as a drop in PVR below the median value. In group A, the following parameters changed after BPA: T‑wave axis (P <0.001), P wave in lead II (P <0.001), S wave in lead V5 (P <0.001), R/S ratio in lead V5 (P <0.001). In group B, despite some hemodynamic and functional improvement, there were no differences in ECG markers of RVH after BPA.
Conclusions: An improvement in RVH parameters can be observed on ECG after a hemodynamically effective BPA.
Introduction
Chronic thromboembolic pulmonary hypertension (CTEPH) is characterized by the presence of chronic thromboembolic material in the pulmonary arteries.1 Pulmonary endarterectomy (PEA) is the first‑line treatment in operable patients.2,3 Patients with a distal location of clots and those with persisting pulmonary hypertension after PEA can benefit from percutaneous balloon pulmonary angioplasty (BPA).3-8 Successful BPA procedures lead to relief of the right ventricle, whose normal function is an essential prognostic factor in patients with pulmonary hypertension.9 Previous studies showed improvement in the right ventricular morphology and function after BPA as assessed with echocardiography.10,11 There are scarce data on electrocardiographic (ECG) changes in patients with CTEPH undergoing BPA.12 The main aim of our study was to assess the correlations between the hemodynamic parameters of the pulmonary circulation and ECG parameters of the right ventricular hypertrophy (RVH) following BPA procedures to conduct a preliminary evaluation of the clinical usefulness of ECG in monitoring the efficacy of percutaneous interventional treatment of patients with CTEPH.
Patients and methods
The analysis was performed in patients with CTEPH hospitalized at the European Health Centre in Otwock between 2013 and 2018. All enrolled patients were diagnosed with CTEPH and were qualified for treatment with BPA in accordance with the current guidelines of the European Society of Cardiology for the diagnosis and treatment of pulmonary hypertension.13 Out of 41 patients, 7 patients were diagnosed with persistent pulmonary hypertension following unsuccessful cardiosurgical treatment. The analysis did not include patients with coronary heart disease or significant cardiac arrhythmias, for example, atrial fibrillation, which made it difficult to analyze the ECG curve. The institutional ethics committee approved the study protocol (decision no. 88/PB/2015), and informed consent was obtained from each patient before the study.
Right heart catheterization and balloon pulmonary angioplasty
The right heart catheterization was performed using the access via the internal jugular vein or femoral vein with the use of the Swan–Ganz catheter (Argon Critical Care Systems Singapore Pte Ltd, Yishun, Singapore) in accordance with current standards.14 The following hemodynamic parameters were measured or calculated: mean right atrial pressure, mean pulmonary arterial pressure (mPAP), systolic pulmonary arterial pressure, pulmonary artery wedge pressure, pulmonary vascular resistance (PVR), total pulmonary resistance, cardiac index, stroke volume index, right ventricular stroke work index, and cardiac output. Cardiac output was measured with the thermodilution method. The mean pulmonary arterial pressure in each patient was greater than 25 mm Hg, and the wedge pressure was 15 mm Hg or less.
The BPAs were performed by 2 interventional cardiologists and an interventional radiologist experienced in percutaneous vascular procedures in accordance with the previously described protocol.15
Six‑minute walk test and laboratory tests
A 6‑minute walk test was performed by qualified medical personnel in accordance with the American Thoracic Society guidelines.16
Myocardial necrosis was assessed with plasma measurement of highly sensitive troponin concentration with the use of the Elecsys Troponin T high‑sensitivity assay (Roche, Mannheim, Germany; normal values <0.003 ng/ml). Biochemical assessment of the degree of cardiac failure was performed with serum measurement of N‑terminal pro‑B‑type natriuretic peptide concentration with the use of the Elecsys NT‑proBNP assay (Roche; normal values <125 pg/ml).
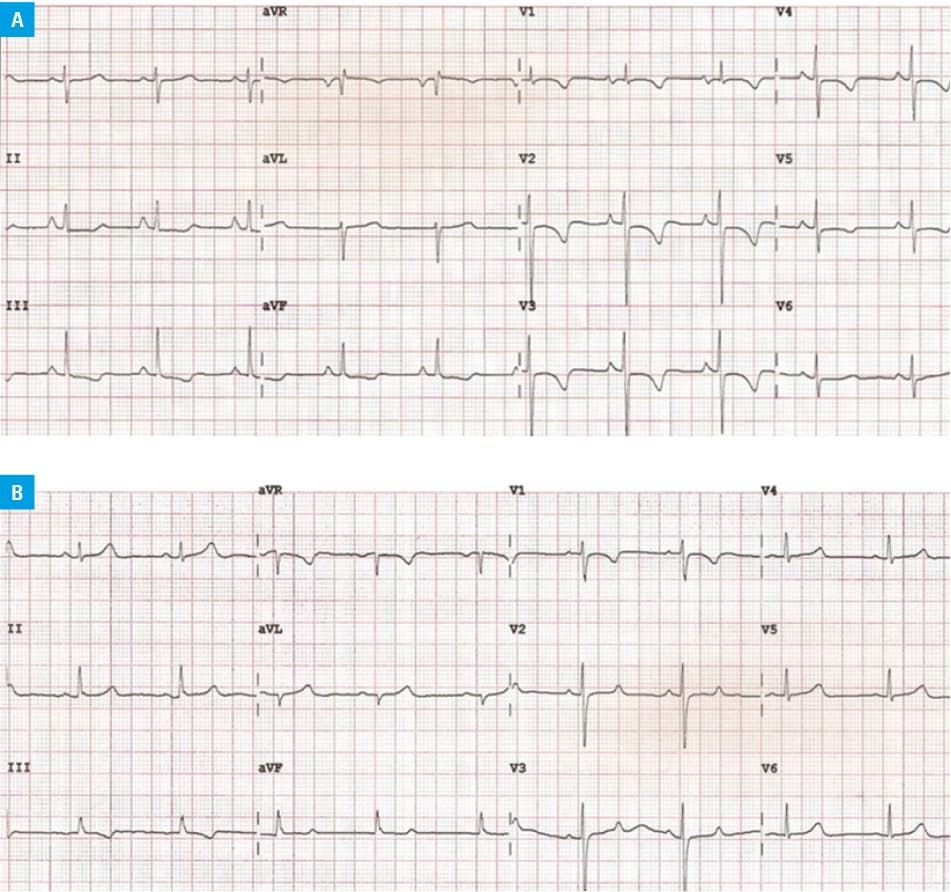
Electrocardiogram
Standard 12‑lead ECG was performed in each patient during calm breathing in a supine position with a commercially available ECG apparatus (Philips PageWriter TC50, Andover, Massachusetts, United States). Paper speed was 25 mm/s (1 mV = 10 mm). The baseline ECG was performed 1 day before the first BPA and a control measurement was done at 3 to 6 months after the last BPA procedure (Figure 1A and 1B). The analysis included ECG signs of RVH, such as the T‑wave axis (°); P‑wave amplitude in lead II (μV); S‑wave amplitude in lead V5 (μV); R/S ratio in lead V5; R‑wave amplitude in lead V6 (μV); QRS axis (°); right bundle branch block (RBBB); rSR’ complex in lead V1 with R’ higher than 10 mm (QRS <120 ms); qR complex in lead V1; SIQIII pattern; R‑wave amplitude in lead V1 + S‑wave amplitude in leads V5 through V6 higher than 10.5 mm; R‑wave amplitude in lead aVR higher than 4 mm; R‑wave amplitude in lead V1 higher than 6 mm; S wave amplitude in lead V1 less than 2 mm; ST‑T segment depression by at least 1 mm in more leads than leads V1 through V3; ST‑T segment depression by at least 1 mm in leads V1 thorugh V3; ST‑T segment depression by at least 1 mm in leads: II, III, aVF; negative T wave in leads V1 though V3; negative T wave in precordial leads in more leads than leads V1 through V3; negative T wave in leads: II, III, aVF.
Statistical analysis
Statistical analyses were performed with the Statistica PL software (version 13, STATSOFT, Tulsa, Oklahoma, United States). Continuous variables with normal distribution were presented as mean (SD). Variables with non‑normal distribution were presented as median and interquartile range. Nominal variables were presented as numbers and percentages. The t test or Mann–Whitney test (depending on the distribution of the analyzed variable assessed with the Shapiro–Wilk test) was used to compare the continuous variables obtained from the data before and after the interventional treatment (BPA). The Bonferroni correction was used for the comparison of ECG variables; the significance level was set at P value of less than 0.0025 (0.05/20 = 0.0025) and for the comparison of the right heart catheterization variables at P value of less than 0.005 (0.05/10 = 0.005). The McNemar test was used to compare the nominal variables. To examine the correlation between ECG and hem0odynamic parameters, the Spearman rank correlation analysis (with P <0.05) was performed.
Results
Patient characteristics
The study included 41 patients with CTEPH (mean [SD] age of patients, 58.6 [17.4] years). A total of 196 BPA sessions were performed in the study group (mean [SD] number of BPA sessions, 4.8 [2.1]).
The general characteristics of the population enrolled in the study are presented in Table 1.
Parameter | Value | ||
Abbreviations: ERA, endothelin receptor antagonists; PDE5i, phosphodiesterase type 5 inhibitors; PGI2, prostacyclin E2 analogs; sGC, soluble guanylate cyclase stimulators; WHO FC, World Health Organization functional class | |||
Sex, female, n (%) | 20 (48.8) | ||
Age, y, mean (SD) | 58.6 (17.4) | ||
WHO FC, n (%) | I | 0 | |
II | 4 (9.7) | ||
III | 30 (73.2) | ||
IV | 7 (17.1) | ||
Treatment with pulmonary vasodilators, n (%) | |||
Any therapy | 29 (70.7) | ||
Monotherapy | Total number of monotherapies | 27 (93.1) | |
PDE5i | 21 (77.8) | ||
ERA | 0 | ||
sGCs | 6 (22.2) | ||
PGI2 | 0 | ||
Dual combination therapy | PDE5i + PGI2 | 2 (6.9) | |
The correlation between the electrocardiographic and hemodynamic parameters
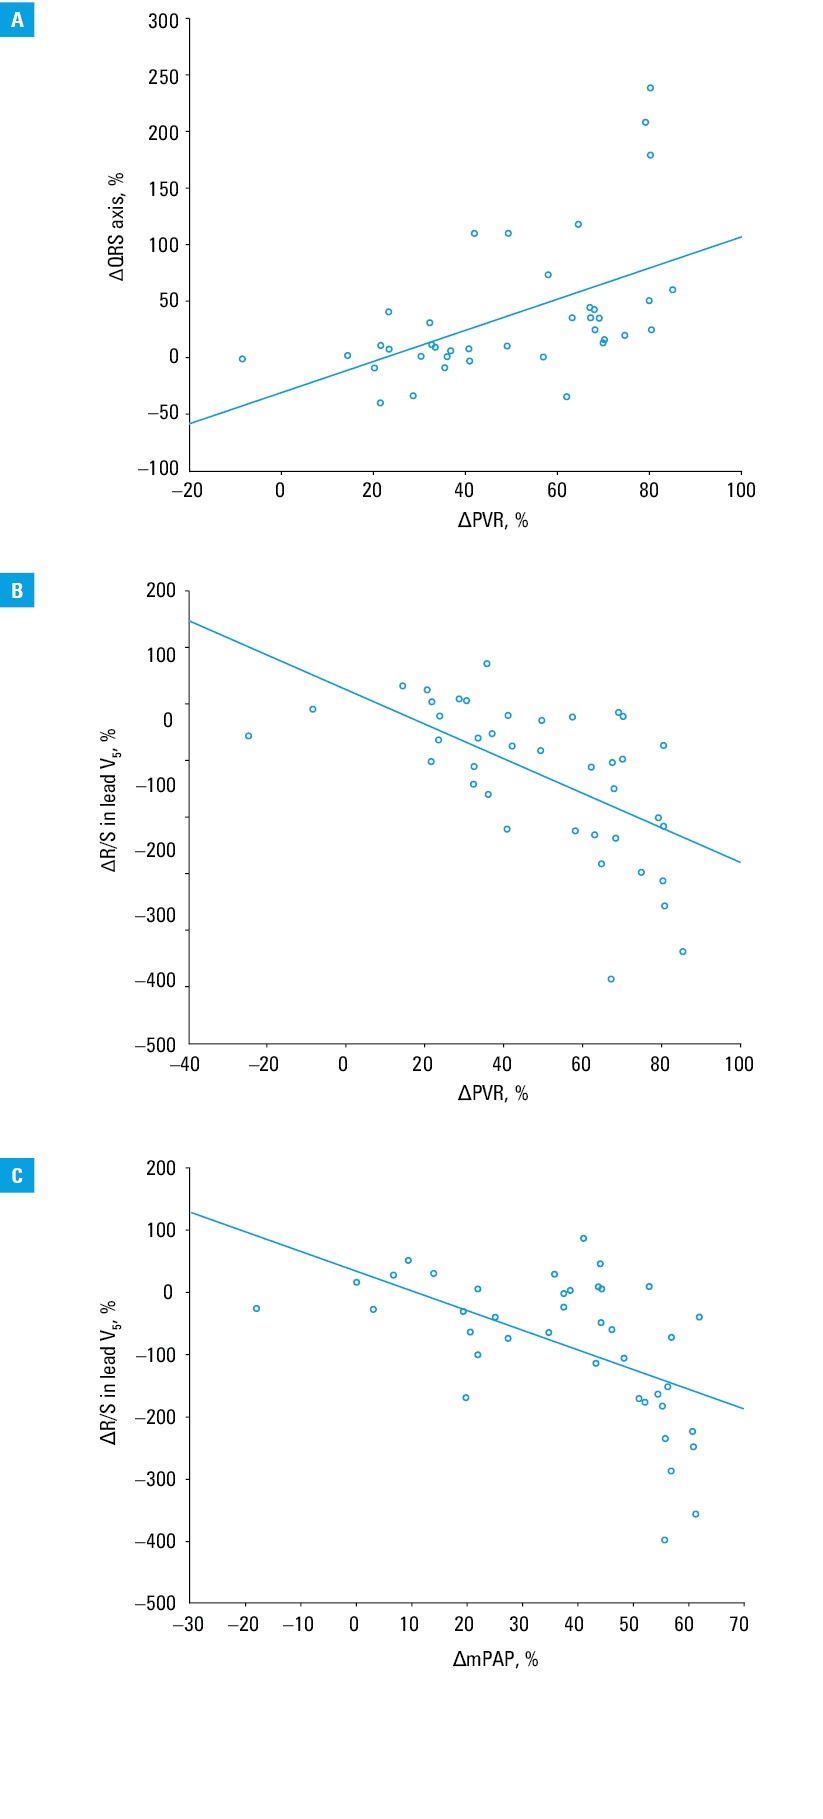
The percentage change in the values of the following ECG parameters of RVH was correlated with the percentage change in the PVR in the whole study group subject to BPA: axis of the QRS (rho = 0.530) and T waves (rho = 0.372); P‑wave amplitude in leads II (rho = 0.340) and III (rho = 0.438); S‑wave amplitude in lead V5 (rho = 0.634); R/S ratio in lead V5 (rho = –0.636); S‑wave amplitude in lead V6 (rho = 0.508); S‑wave amplitude in lead I (rho = 0.496). Regarding the percentage change in mPAP, the above correlation was observed for the percentage change in the following ECG parameters: axis of the QRS (rho = 0.425) and P waves (rho = –0.497); S‑wave amplitude in lead V5 (rho = 0.612); R/S ratio in lead V5 (rho = –0.611); S‑wave amplitude in lead V6 (rho = 0.408); S‑wave amplitude in lead I (rho = 0.474) (Figure 2A–2C).
Electrocardiographic, hemodynamic, and functional data
A comparison of hemodynamic, functional, and ECG parameters was performed in the whole study group before and after BPA (Table 2).
Parameter | Before BPA | After BPA | P valuea |
a P values were adjusted using Bonferroni correction for multiple comparisons (for the comparison of ECG variables, P <0.0025 was considered significant; for the comparison of right heart catheterization variables, P <0.005)
Abbreviations: 6MWT, 6‑minute walk test; BPA, balloon pulmonary angioplasty; CI, cardiac index; IQR, interquartile range; mPAP, mean pulmonary arterial pressure; NT‑proBNP, N‑terminal pro‑B‑type natriuretic peptide; PVR, pulmonary vascular resistance; RAP, right atrial pressure; RBBB, right bundle branch block; RVSWI, right ventricular stroke work index; sPAP, systolic pulmonary arterial pressure; SVI, stroke volume index; TPR, total pulmonary resistance; others, see Table 1 | |||
Hemodynamic parameters | |||
RAP, mm Hg, median (IQR) | 10 (6–11) | 5 (4–6) | <0.001 |
sPAP, mm Hg, median (IQR) | 86 (72–95) | 46 (41–55) | <0.001 |
mPAP, mm Hg, median (IQR) | 50 (43–56) | 27 (24–35) | <0.001 |
PVR, Wood units, median (IQR) | 9.02 (6.65–11.69) | 3.88 (2.93–5.15) | <0.001 |
TPR, Wood units, median (IQR) | 11.71 (9.06–14.29) | 5.79 (4.50–7.31) | <0.001 |
CI, l/min/m2, mean (SD) | 2.42 (0.61) | 2.71 (0.61) | 0.0049 |
SVI, ml/m2, mean (SD) | 33.42 (9.84) | 39.82 (9.58) | <0.001 |
RVSWI, gm‑m/m2/beat, mean (SD) | 17.69 (5.62) | 12.93 (3.64) | <0.001 |
Functional parameters, median (IQR) | |||
NT‑proBNP, pg/ml | 1014 (328–2947) | 130 (66–457) | <0.001 |
WHO FC | 3 (3–3) | 2 (1–2) | <0.001 |
6MWT, min | 354 (222–431) | 438 (351–548) | <0.001 |
Troponin, ng/ml | 0.011 (0.006–0.019) | 0.006 (0.004–0.014) | 0.002 |
Electrocardiographic parameters | |||
T‑wave axis, degrees, median (IQR) | 0.5 (–43.5 to 29.5) | 28 (–6 to 41) | <0.001 |
P‑wave amplitude in lead II, µV, median (IQR) | 140 (100–200) | 110 (80–120) | <0.001 |
S‑wave amplitude in lead V5, µV, mean (SD) | 683 (348) | 520 (265) | 0.005 |
R/S ratio in lead V5, n, median (IQR) | 1.55 (0.91–2.62) | 2.25 (1.37–3.10) | 0.003 |
R‑wave amplitude in lead V6, µV, mean (SD) | 7.84 (3.63) | 9.73 (3.56) | <0.001 |
QRS axis, °, median (IQR) | 90 (54.5–123.5) | 79 (47–100) | 0.02 |
RBBB, n (%) | 8 (20) | 12 (29.3) | 0.51 |
rSR’ complex in lead V1 with R’ >10 mm (QRS <120 ms), n (%) | 1 (2.5) | 1 (2.4) | 0.48 |
qR complex in lead V1, n (%) | 8 (20) | 3 (7.3) | 0.07 |
R‑wave amplitude in lead V1 >6 mm, n (%) | 6 (15) | 3 (7.3) | 0.37 |
R‑wave amplitude in lead V1 + S‑wave amplitude in leads V5 through V6 >10.5 mm, n (%) | 23 (57.5) | 12 (29.3) | 0.01 |
R‑wave amplitude in lead aVR >4 mm, n (%) | 3 (7.5) | 2 (4.9) | 1.0 |
SIQIII pattern, n (%) | 11 (27.5) | 10 (24.4) | 1.0 |
S‑wave amplitude in lead V1 <2 mm, n (%) | 10 (25) | 4 (9.8) | 0.08 |
ST‑T segment depression by at least 1 mm in more leads than leads V1 through V3, n (%) | 12 (30) | 5 (12.2) | 0.07 |
ST‑T segment depression by at least 1 mm in leads V1 through V3, n (%) | 11 (27.5) | 5 (12.2) | 0.05 |
ST‑T segment depression by at least 1 mm in leads: II, III, aVF, n (%) | 8 (20) | 1 (2.4) | 0.002 |
Negative T wave in leads V1 through V3, n (%) | 22 (55) | 9 (22) | 0.002 |
Negative T wave in precordial leads in a larger number of leads than V1 through V3, n (%) | 20 (50) | 7 (17.1) | <0.001 |
Negative T wave in leads: II, III, aVF, n (%) | 14 (35) | 3 (7.3) | 0.003 |
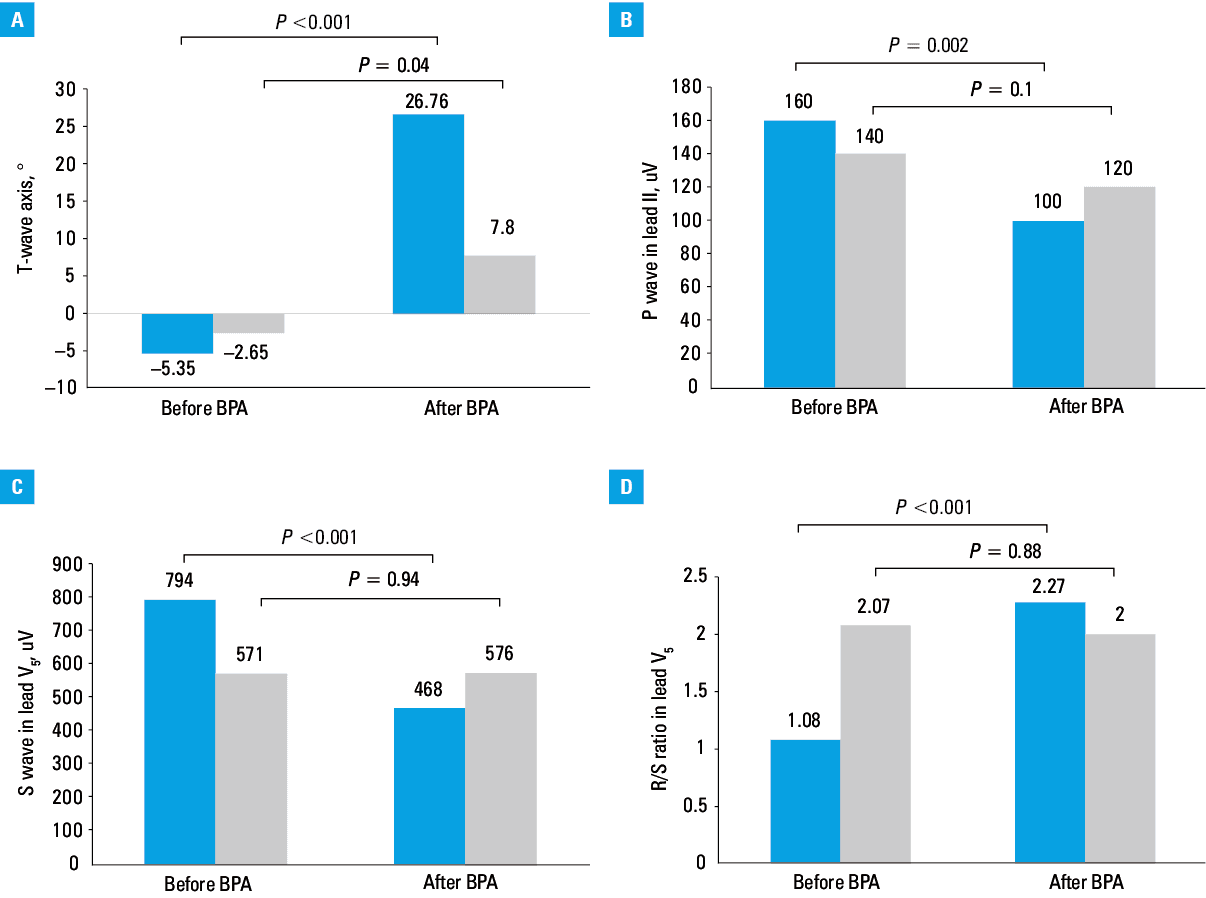
The whole study group was divided into 2 subgroups according to the efficacy of the interventional procedure defined as the percentage decrease in the PVR against the baseline measurement. Group A was defined as patients with a PVR decrease greater than the median value of the whole study population, that is, patients with an excellent hemodynamic effect following interventional treatment, and group B was defined as patients with a PVR decrease lower than the median value for the whole study population, that is, patients with a worse hemodynamic effect. The median value of PVR drop for the entire population was 49%.
In group A, there were changes in the values of the ECG parameters of the RVH, as shown in Table 3 and Figure 3A–3D. In group B, despite the observed hemodynamic and functional improvement following pulmonary angioplasty, none of the ECG parameters of the RVH found in group A was different.
ECG variables of the right ventricular hypertrophy | PVR reduction above the median value (group A) | PVR reduction below the median value (group B) | ||||
Before BPA | After BPA | P valuea | Before BPA | After BPA | P valuea | |
a P values were adjusted using Bonferroni correction for multiple comparisons (for the comparison of ECG variables, P <0.0025 was considered significant; for the comparison of right heart catheterization variables, P <0.005)
Abbreviations: see Table 2 | ||||||
T‑wave axis, degrees, mean (SD) | –5.35 (49.88) | 26.76 (30.69) | <0.001 | –2.65 (43.79) | 7.80 (38.90) | 0.04 |
P‑wave amplitude in lead II, µV, median (IQR) | 160 (110–200) | 100 (80–120) | <0.001 | 140 (100–180) | 120 (80–120) | 0.01 |
S‑wave amplitude in lead V5, µV, mean (SD) | 794 (320) | 468 (232) | <0.001 | 571 (446) | 576 (291) | 0.94 |
R/S ratio in lead V5, n, median (IQR) | 1.08 (0.84–1.85) | 2.27 (1.96–3.1) | <0.001 | 2.07 (1.32–3.59) | 2.00 (1.11–3.22) | 0.88 |
R‑wave amplitude in lead V6, µV, mean (SD) | 8.17 (3.83) | 9.59 (3.65) | 0.06 | 7.50 (3.49) | 9.88 (3.54) | 0.02 |
QRS axis, degrees, median (IQR) | 92.5 (48.5–128) | 66 (29–88) | 0.03 | 90 (62–115.5) | 88.5 (64.5–106.5) | 0.25 |
RBBB, n (%) | 3 (15) | 3 (15) | 0.48 | 5 (25) | 8 (40) | 0.45 |
rSR’ complex in lead V1 with R’ >10 mm (QRS <120 ms), n (%) | 1 (5) | 0 (0) | 1.00 | 0 (0) | 1 (5) | 1.00 |
qR complex in lead V1, n (%) | 2 (10) | 0 (0) | 0.48 | 6 (30) | 3 (15) | 0.25 |
R‑wave amplitude in lead V1 >6 mm, n (%) | 3 (15) | 0 (0) | 0.25 | 3 (15) | 3 (15) | 0.48 |
R‑wave amplitude in lead V1 + S wave amplitude in leads V5 through V6 >10.5 mm, n (%) | 11 (55) | 4 (20) | 0.07 | 8 (40) | 7 (35) | 1.00 |
R‑wave amplitude in lead aVR >4 mm, n (%) | 1 (5) | 2 (10) | 1.00 | 3 (15) | 2 (10) | 1.00 |
SIQIII pattern, n (%) | 5 (25) | 5 (25) | 0.72 | 6 (30) | 5 (25) | 1.00 |
S‑wave amplitude V1 <2 mm, n (%) | 1 (5) | 0 (0) | 1.00 | 6 (30) | 3 (15) | 0.37 |
ST‑T segment depression by at least 1 mm in a larger number of leads than V1 through V3, n (%) | 7 (35) | 1 (5) | 0.04 | 5 (25) | 4 (25) | 1.00 |
ST‑T segment depression by at least 1 mm in leads V1 through V3, n (%) | 8 (40) | 1 (5) | 0.02 | 5 (25) | 5 (25) | 0.48 |
ST‑T segment depression by at least 1 mm in leads: II, III, aVF, n (%) | 5 (25) | 0 (0) | 0.07 | 3 (15) | 1 (5) | 0.48 |
Negative T wave in leads V1 through V3, n (%) | 12 (60) | 2 (10) | 0.004 | 10 (50) | 7 (35) | 0.37 |
Negative T wave in precordial leads in a larger number of leads than V1 through V3, n (%) | 11 (55) | 2 (10) | 0.008 | 9 (45) | 5 (25) | 0.13 |
Negative T wave in leads: II, III, aVF, n (%) | 8 (40) | 0 (0) | 0.01 | 6 (30) | 3 (15) | 0.25 |
NT‑proBNP, pg/ml, median (IQR) | 1486 (652–3369) | 90 (68–167) | <0.001 | 710 (236–2364) | 434 (66–670) | 0.008 |
WHO FC, n (IQR) | 3 (3–3) | 2 (1–2) | <0.001 | 3 (3–3) | 2 (1–2) | 0.003 |
6MWT, m, median (IQR) | 354 (222–384) | 458 (408–555) | <0.001 | 348 (240–483) | 422 (342–534) | 0.002 |
Troponin, ng/ml, median (IQR) | 0.012 (0.006–0.015) | 0.006 (0.004–0.014) | 0.008 | 0.009 (0.006–0.021) | 0.007 (0.005–0.017) | 0.09 |
RAP, mm Hg, median (IQR) | 10 (6–12) | 5 (3–6) | <0.001 | 8 (5.5–11) | 5 (4–6.5) | 0.02 |
sPAP, mm Hg, median (IQR) | 93 (86–100) | 41 (36–52) | <0.001 | 73 (60.5–86.5) | 50 (41.5–71) | <0.001 |
mPAP, mm Hg, median (IQR) | 53 (51–61) | 24 (22–30) | <0.001 | 43 (33.5–50) | 30.5 (26–38) | 0.001 |
CI, l/min/m2, median (IQR) | 2.33 (1.90–2.54) | 2.77 (2.50–3.08) | 0.002 | 2.57 (2.15–3.10) | 2.63 (2.20–2.97) | 0.97 |
SVI, ml/m2, mean (SD) | 29.13 (8.84) | 40.34 (8.24) | <0.001 | 37.93 (8.92) | 39.26 (11) | 0.38 |
RVSWI, gm‑m/m2/beat, mean (SD) | 17.93 (5.8) | 11.92 (2.76) | <0.001 | 17.44 (5.55) | 13.99 (4.18) | 0.01 |
Discussion
The above results show a correlation between the improvement of the hemodynamic parameters of pulmonary circulation in patients with CTEPH who underwent percutaneous treatment and resolution of specific ECG variables of the RVH.
Hemodynamic decompression of the right ventricle, leading to improvement of its function, is an important predictive factor for the survival of patients with pulmonary hypertension.17
Several previous studies showed that the regression of specific ECG signs of the right ventricular strain or RVH was observed in survivors of acute pulmonary embolism but also in patients with CTEPH after successful PEA and those with pulmonary arterial hypertension treated with specific pharmacotherapy.18-20
It was shown that the presence of the qR complex in lead V1, R/S ratio in lead V1, and P‑wave amplitude in lead II had significant prognostic value in the population of patients with pulmonary hypertension, and some of them might be used to assess the efficacy of the therapy applied.18,21-23 It has been proved that the said presence of qR complex in lead V1 reflects the midsystolic dilation and flattening of the right ventricle very well and is an important predictor of mortality in the population of patients with pulmonary hypertension.23 Therefore, the presence of qR complex was used in our analysis. However, based on the correlations performed and the comparative analysis, no difference was shown in the spreading of qR complex in lead V1 in patients with CTEPH before and after BPA treatment.
Other studies also showed a close correlation between the P wave amplitude and the PVR value, which was related to the change in the QRS complex axis.18 The analysis of the changes in the above ECG values was aimed at assessing the response of patients with pulmonary hypertension to the applied form of therapy. In our studies, the change in the P‑wave amplitude in lead II was also correlated with the change in PVR. Also, the QRS axis was correlated with the change in the PVR and, as one of a few parameters, the change in the mPAP.
Previous studies also proved that the S‑wave amplitude in lead V1, the R/S ratio in lead V6, and the spreading of the SIQIII complex were changed after PEA, together with the observed reverse right ventricular remodeling assessed on echocardiography.19 It was also proved that the degree of the right ventricular size reduction was correlated with the change in the cardiac axis and geometry observed on ECG examination.22,24 Nishiyama et al12 showed that the treatment of patients with CTEPH with BPA caused the withdrawal of certain ECG signs of RVH, which is manifested as a significant improvement in the right ventricular systolic function. The receiver operating characteristic analysis in the above study confirmed, for example, that the value of the S‑wave amplitude in lead V5, sum of amplitude of R wave in lead V1 and S wave in lead V5, S‑wave amplitude in lead I, and QRS axis were important predictors of the mPAP of 30 mm Hg or higher. Moreover, a correlation was found with regard to the observed changes in the mPAP and in the values of the following ECG parameters: S wave in lead I, sum of amplitude of R wave in lead V1 and S wave in lead V5, as well as P‑wave amplitude in lead II.12 The above study also showed that the R/S ratio in lead V1 of 1 or higher might be observed with a higher frequency in patients with CTEPH whose hemodynamic parameters were improved following treatment with BPA.12
Our study also confirmed the clinical significance of the amplitude of R and S waves in lead V5 in the assessment of reverse ECG right ventricular remodeling. Concerning P wave, its assessment was significant not only in lead II but also in lead III. Both previous studies and the present study confirmed the significance of the S wave in lead I, whose amplitude change in our study was correlated with the change in the PVR and mPAP.12,19
In patients with CTEPH, RBBB associated with RVH is usually related to right ventricle enlargement and a lengthening of the conduction pathway. It should be kept in mind that the size of the right ventricle cavity may be subject to certain dynamics. Therefore, even hemodynamically effective BPA may not cause resolution of RBBB. Nevertheless, the differences before and after BPA procedures for the occurrence of RBBB were insignificant both in the whole group and subgroups with good and moderate hemodynamic effects.
Dysfunction of the right ventricle in the course of chronic pulmonary hypertension results in a significant decrease in pulmonary and systemic flow, including coronary flow. The observed changes in ST‑T and T waves on ECG in patients with CTEPH, called “pseudoinfarction pattern”, are most likely caused by ischemia of overloaded right ventricle myocardium. We have shown that such changes are reversible as a result of BPA treatment and appear to be related to the effectiveness of the treatments used.
In the other innovative part of our study, we attempted to show that only hemodynamically effective pulmonary angioplasty enables regression of individual ECG variables, which, in turn, contributes to a significant decompression of the right cardiac chambers, which is safe for the patient. Identifying the most powerful ECG parameters (T wave axis, P wave in lead II, S wave in lead V5, R/S ratio in lead V5) defined as a significant hemodynamic improvement enables their potential future use in monitoring the efficacy and effectiveness of serial BPA sessions with the use of a cheap, noninvasive, repeatable, and easily available test, that is, resting ECG, which will also be useful in making decisions about termination of the interventional treatment.
Study limitations
The limitation of this study is the relatively small number of patients participating in the analysis and the retrospective design of the study. The evaluation of the right ventricular morphology and function with imaging studies, such as magnetic resonance imaging or 3‑dimensional echocardiography, has also not been carried out. The current data are insufficient to determine which ECG changes are predominantly related to the thickening of the right ventricular free wall, right‑sided cardiac chamber enlargement, mutual relationships and geometry of both ventricles, and ischemia and injury of the right ventricle.25
Conclusions
BPA used in patients with CTEPH results in an improvement in the ECG parameters of RVH if it effectively improves the hemodynamics of the pulmonary circulation. Whether it has a prognostic significance and can contribute to the assessment of success defined with BPA in individual patients requires further studies.
- Riedel M, Stanek V, Widimsky J, Prerovsky I. Longterm follow‑up of patients with pulmonary thromboembolism. Late prognosis and evolution of hemodynamic and respiratory data. Chest. 1982; 81: 151‑158. | Crossref
- Mayer E, Jenkins D, Lindner J, et al. Surgical management and outcome of patients with chronic thromboembolic pulmonary hypertension: results from an international prospective registry. J Thorac Cardiovasc Surg. 2011; 141: 702‑710. | Crossref
- Freed DH, Thomson BM, Berman M, et al. Survival after pulmonary thromboendarterectomy: effect of residual pulmonary hypertension. J Thorac Cardiovasc Surg. 2011; 141: 383‑387. | Crossref
- Kopec G, Stepniewski J, Magon W, et al. Prolonged catheter balloon inflation for the treatment of hemoptysis comlicating balloon pulmonary angioplasty. Pol Arch Intern Med. 2017; 127: 129‑130. | Crossref
- Mizoguchi H, Ogawa A, Munemasa M, et al. Refined balloon pulmonary angioplasty for inoperable patients with chronic thromboembolic pulmonary hypertension. Circ Cardiovasc Interv. 2012; 5: 748‑755. | Crossref
ARTICLE INFORMATION