A panel of urinary biochemical markers for the noninvasive detection of kidney dysfunction in HIV-infected patients
Key words: chronic kidney disease, combined antiretroviral therapy, HIV, urinary parameters


 CC BY-NC-SA 4.0
A panel of urinary biochemical markers for the noninvasive detection of kidney dysfunction in HIV-infected patients
Introduction: The use of antiretroviral therapy in HIV‑infected patients can lead to disturbances in kidney function. Renal dysfunction can also be caused by the direct effects of HIV on the kidneys. The assessment of renal function is needed to monitor these patients for the development of chronic kidney disease.
Objectives: The aim of this study was to identify urinary biochemical parameters for the assessment of kidney dysfunction in HIV‑infected patients.
Patients and methods: The study included 86 patients with HIV and 34 healthy controls. Spectrophotometry was used to measure the activity of the following enzymes: N‑acetyl-β-D‑glucosaminidase (NAG), NAG isoenzyme B (NAG‑B), galactosidase, β-glucuronidase, alanyl aminopeptidase, and γ-glutamyltransferase. An enzyme‑linked immunosorbent assay was used to assess the urinary concentrations of low‑molecular‑weight proteins: kidney injury molecule 1 (KIM‑1), neutrophil gelatinase–associated lipocalin, α-glutathione S‑transferase, π-glutathione S‑transferase, neopterin, β2-microglobulin (β2M), and retinol‑binding protein (RBP).
Results: The urinary levels of all parameters except alanyl aminopeptidase were significantly higher in HIV‑infected patients than in the control group. The statistical analysis revealed the following 4 parameters to have the best diagnostic value in: β2M, NAG, KIM‑1, and RBP.
Conclusions: Our results indicate that among selected enzymes and low‑molecular proteins, β2M, NAG, KIM‑1, and RBP are the best in assessing renal dysfunction in patients with HIV.
Introduction
At the 2014 International AIDS Conference in Melbourne, the United Nations Joint Program on HIV/AIDS proposed 4 major strategies to speed up efforts to end the AIDS epidemic as a public health threat by 2030: 1) prevention of new HIV infections; 2) getting people tested and diagnosed, treating everyone immediately, and keeping patients under care; 3) issues around the best possible choice and efficacy of antiretroviral therapy (ART) and possible toxicities of ART are not to be underestimated; and 4) comorbidities associated with HIV must not be forgotten.1 In this aspect, monitoring of the function of some organs, especially those vulnerable to damage during the treatment and course of disease, is important. It has long been recognized that patients with HIV infection are at particular risk of renal disease, although the pattern of disease has changed significantly over time. The risk of acute and chronic kidney disease (CKD) remains higher in HIV‑infected individuals than in the general population. It was reported that kidney disease in these patients is associated with poor outcomes, including increased mortality.2
In recent years, a steady increase in the number of HIV‑infected patients with CKD as a comorbid complication has been observed. It is estimated that up to 30% of people with HIV infection may have kidney function disorders.3,4 HIV‑associated nephropathy (HIVAN) was considered to be one of the main causes of CKD in these patients. Currently, even though HIVAN occurs less frequently in the era of effective antiretroviral therapy (ART), HIV‑associated immune complex kidney disease has been diagnosed more frequently. The introduction of effective ART has led to a reduction in the incidence of HIV‑related end‑stage kidney disease.2,5,6 Other nephropathies related to HIV infection are thrombotic microangiopathy and IgA nephropathy (a kidney disease associated with immune complexes).7 On the other hand, ART was also reported as an important factor connected with the risk of kidney injury, including interstitial nephritis, severe proximal tubulopathy, crystalluria, mitochondrial toxicity, and Fanconi syndrome.8
It is highly probable that CKD will become an increasing medical problem in HIV‑infected patients. It has been found that both glomerular mesangial cells and tubular epithelial cells are not only susceptible to HIV invasion but are also capable of supporting virus replication. It is assumed that kidney damage results directly from HIV infection and is associated with the expression of viral genes, especially Nef and Vpr in kidney epithelial cells, leading to their apoptosis.9-12 It has also been proved that the virus can survive in renal epithelial cells despite the use of ART.2,3 Other important factors affecting the development of CKD include frequent coinfections with hepatitis B or C virus, intravenous use of narcotic drugs, and the presence of opportunistic pathogens, among which cytomegalovirus, Epstein–Barr virus, and Varicella zoster virus are most often associated with renal pathology.13,14 The nephrotoxic action of antiretroviral drugs and those used in the treatment of opportunistic infections should also be considered.15 There are also significant comorbidities that are not a direct consequence of HIV infection, such as diabetes, hyperlipidemia and dyslipidemia, atherosclerosis, and high blood pressure.16
The complex clinical picture of HIV infection along with applied multidirectional therapy requires constant monitoring for CKD and its progression, especially in the subclinical state. Clinical need prompts researchers to look for methods facilitating the early identification of HIV‑infected patients at risk of renal failure. The best solution seems to be the determination of a panel of specific parameters to detect even the smallest kidney dysfunction as soon as possible, and to additionally indicate the lesion sites (glomerulus, tubules proximal, distal). A recent report has indicated a considerable interest in the problem of CKD in HIV‑infected population.17
In March 2017, a multidisciplinary panel of clinical and scientific experts was convened by Kidney Disease: Improving Global Outcomes to identify and discuss key issues relevant to the optimal diagnosis and management of kidney disease in HIV‑positive individuals. The experts clearly indicated that renal function in this population needs to be extensively monitored in order to diagnose kidney disease and disturbances in kidney function, especially during the early stages.17 In this light, to meet the needs of clinicians, we attempted to develop a broad panel of noninvasive biochemical parameters indicating kidney dysfunction that could be measured in the urine of HIV‑infected patients.
We selected 6 enzymes and 7 low‑molecular‑weight proteins (LMWPs) for the study. The enzymes included N‑acetyl-β-D‑glucosaminidase (NAG), NAG isoenzyme B (NAG‑B), β-glucuro- nidase (β-GR), and galactosidase (GAL), found in renal lysosomes, as well as alanyl aminopeptidase (AAP) and γ-glutamyltransferase (GGT), present in the microvilli of the brush border. Low‑molecular‑weight proteins included α-glutathione S‑transferase (α-GST) isoenzyme, located in the proximal tubules; π-glutathione S‑transferase (π-GST) isoenzyme, found in the distal tubules and Henle loop; neutrophil gelatinase–associated lipocalin (NGAL) and kidney injury molecule 1 (KIM‑1), reflecting ischemic kidney damage; proteins β2-microglobulin (β2M) and retinol‑binding protein (RBP), assessing renal tubular resorption; and neopterin (NPT) as an indicator of cellular immunity.
The aim of the study was to assess the utility of selected biochemical parameters measured in urine and indicating both structural and functional disorders of the kidneys in HIV‑infected patients. Using a wide selection of indicators, we attempted to assess the status of each part of the nephron and identify the degree of kidney damage. We also examined correlations between the parameters and identified those with the best diagnostic value.
Patients and methods
The study group consisted of 86 HIV‑positive patients (66 men [77%], 20 women [23%]; mean [SD] age, 42 [10] years; range, 28–61 years) treated at the HIV/AIDS Outpatient Clinic in Wrocław, Poland. Information on the HIV status, serum creatinine concentration, and ART was obtained from medical records. The duration of HIV infection ranged from 15 to 25 years, while combined ART (cART) lasted from 3 to 15 years. Most patients (77%) were treated with cART; the remaining 23% of patients were cART naive. The majority of patients on cART had an undetectable viral load in blood, but 8% of patients had a viral load in the range of 88 to 347000 copies/ml. In cART‑naive patients, the viral load was in the range of 340 to 224000 copies/ml. The actual CD4+ lymphocyte count in patients on cART ranged from 55 to 1156 cell/µl, and in cART‑naive patients, from 30 to 679 cell/µl. The nadir CD4+ lymphocyte count ranged from 15 to 671 cell/µl in patients on cART and from 30 to 554 cell/µl in cART‑naive patients. Coinfections with hepatitis C virus were detected in 48% of patients. Among patients on cART, 53% were treated with tenofovir and 24% with other drugs.
The control group included 34 healthy volunteers (25 men [74%], 9 women [26%]; mean [SD] age, 39 [9] years; range, 25–60 years). All controls were negative for HIV and did not have kidney dysfunction, as confirmed by normal estimated glomerular filtration rate (≥90 ml/min). Moreover, they had no significant comorbidities such as hypertension, diabetes mellitus, or hepatitis B or C virus infection. There were no significant differences between HIV‑infected patients and the control group in terms of age or sex.
All participants were informed about the aim of the study and provided their written consent. The study was approved by the Ethics Committee of Wrocław Medical University (no. KB‑658/2012 and no. KB‑12/2018).
Morning urine samples were collected in polystyrene containers (Nuova Aptaca, Canelli, Italy) and centrifuged by an MPW‑350 laboratory centrifuge (MPW Med. Instruments, Warsaw, Poland) for 15 minutes (1438 × g). The obtained supernatant was removed, placed in Eppendorf tubes, and stored at a temperature of –80°C until further analysis.
The urine activity of NAG, NAG‑B, GAL, β-GR, AAP, and GGP was determined using spectrophotometry, with appropriate substrates according to the method described by Jung et al.18 Determination of NAG and NAG‑B isoenzyme activity is based on a spectrophotometric measurement of 4‑nitrophenol released from the substrate (4‑nitrophenyl‑N‑acetyl-β-D‑glucosaminide, Sigma, Saint Louis, Missouri, United States, Cat. No. 9376) by the enzyme present in urine. The thermostable form of NAG‑B was determined after prior urine incubation at 50°C for 120 minutes. Similarly, β-GR (4‑nitrophenyl-β-D‑glucuronide, Sigma, Cat. No. N01627) and GAL (4‑nitrophenyl‑b‑D‑galactopyranoside, Calbiochem, San Diego, California, United States, Cat. No. 48712) were assayed spectrophotometrically. Reactions were carried out at 37°C for 45 minutes. Absorbance was read at a wavelength of 405 nm.
The activity of AAP was determined by a spectrophotometric measurement of β-naphthylamine formed from the alanine-β-naphthylamide substrate (Sigma, Cat. No. A2628) after converting it into a color complex with p‑dimethylbenzaldehyde (Sigma, Cat. No. D3259). The reaction was carried out at 25°C for 120 minutes. Absorbance was read at a wavelength of 450 nm.
γ-Glutamyltransferase catalyzes the transfer of γ-glutamyl residue from the substrate molecule (L‑glutamic acid γ-p‑nitroanilide, Sigma, Cat. No. G‑1135) to glycylglycine (Reanal Laboratory Chemicals, Budapest, Hungary, Cat. No. 07029). The reaction was carried out at 37°C for 1 hour. The absorbance of the released p‑nitroaniline was read at a wavelength of 405 nm.
Low‑molecular‑weight protein concentrations were measured in urine by immunoenzymatic enzyme‑linked immunosorbent assay kits according to the manufacturers’ instructions: KIM‑1 (BioAssay Works, Ijamsville, Maryland, United States, Cat. No. H‑RENA‑E‑001), NGAL (BIOPORTO Diagnostics, Hellerup, Denmark, Cat. No. 036CE), α-GST (Nephkit Alpha, Argutus Medical Ltd., Dublin, Ireland, Cat. No. BIO66NEPHA), π-GST (Pi GST EIA, Argutus Medical Ltd., Cat. No. BIO85), NPT (IBL International GmbH, Hamburg, Germany, Cat. No. RE59321), B2M (Demeditec, Kiel, Germany, Cat. No. DE7610), and RBP (Immundiagnostik AG, Bensheim, Germany, Cat. No. K6110).
Enzyme activity and LMWP concentrations were calculated in relation to the creatinine concentration in urine estimated by the routine Jaffe’s method (the reaction of picric acid [Sigma, Cat. No. 319287] and creatinine under acidic conditions) and expressed as mg/ml of urine creatinine.
Statistical analysis
Statistical analysis was conducted with the Statistica PL software, v 13.3 (StatSoft, Kraków, Polska). Normality of distribution was checked using the Kolmogorov–Smirnov test with Lilliefors correction. The Mann–Whitney test was used for nonparametric data. The associations between continuous variables were analyzed by the nonparametric Spearman test. The area under the curve (AUC) and the cutoff points were calculated using a receiver operating characteristic (ROC) analysis, which evaluates the relationship between the sensitivity and specificity of the examined parameters. The ROC curves for parameters were presented along with the optimal cutoff points (the Youden method). Additionally, a logistic regression analysis was performed for each parameter separately, and the odds ratios (ORs) and 95% confidence intervals were determined. A multifactor model was created using a forward stepwise logistic regression analysis, and the Hosmer–Lemeshow and Wald tests were used to evaluate the model. A P value of less than 0.05 was considered significant.
Results
The comparison of mean enzyme activities and mean LMWP concentrations between HIV‑infected patients and the control group is presented in Tables 1 and 2, respectively. The urine activity of all enzymes, except AAP, was significantly higher in HIV‑infected patients than in the control group. The most significant difference was revealed for NAG (about 2.2‑fold higher activity in patients vs controls), followed by NAG‑B (1.5‑fold higher), β-GR and GGT (1.4‑fold higher), and GAL (1.3‑fold higher) (Table 1).
Parameter | HIV‑infected patients | Controls | P valuea | ||
Median | IQR | Median | IQR | ||
a Mann–Whitney test
Abbreviations: β-GR, β-glucuronidase; AAP, alanyl aminopeptidase; cr., creatinine; GAL, galactosidase; GGT, γ-glutamyltransferase; IQR, interquartile range; NAG, N‑acetyl-β-D‑glucosaminidase; NAG‑B, N‑acetyl-β-D‑glucosaminidase B | |||||
NAG, mU/mg cr. | 1.75 | 1.10–2.41 | 0.89 | 0.63–1.22 | <0.001 |
NAG‑B, mU/mg cr. | 0.65 | 0.31–0.93 | 0.38 | 0.24–0.59 | 0.01 |
β-GR, mU/mg cr. | 0.48 | 0.35–0.83 | 0.40 | 0.21–0.64 | 0.04 |
GAL, mU/mg cr. | 0.27 | 0.18–0.37 | 0.18 | 0.08–0.31 | 0.01 |
GGT, mU/mg cr. | 15.85 | 11.46–28.78 | 13.87 | 8.29–20.34 | 0.03 |
AAP, mU/mg cr. | 2.92 | 1.41–5.33 | 1.94 | 1.34–3.99 | 0.09 |
Parameters | HIV‑infected patients | Controls | P valuea | ||
Median | IQR | Median | IQR | ||
a Mann–Whitney test
Abbreviations: β2M, β2-microglobulin; α-GST, α-glutathione S‑transferase; π-GST, π-glutathione S‑transferase; KIM‑1, kidney injury molecule 1; NGAL, neutrophil gelatinase–associated lipocalin; NPT, neopterin; RBP, retinol‑binding protein; others, see Table 1 | |||||
KIM‑1, ng/mg cr. | 0.10 | 0.04–0.17 | 0.03 | 0.02–0.08 | <0.001 |
NGAL, ng/mg cr. | 20.90 | 10.96–39.54 | 7.57 | 3.65–14.57 | <0.001 |
α-GST, ng/mg cr. | 2.67 | 1.78–4.89 | 1.72 | 1.07–2.80 | 0.003 |
π-GST, ng/mg cr. | 3.64 | 2.47–7.15 | 3.24 | 2.18–4.12 | 0.04 |
NPT, ng/mg cr. | 101.52 | 31.39–353.54 | 59.76 | 30.95–115.15 | 0.04 |
β2M, µg/mg cr. | 0.38 | 0.24–0.67 | 0.19 | 0.12–0.24 | <0.001 |
RBP, µg/mg cr. | 0.14 | 0.08–0.36 | 0.10 | 0.07–0.11 | 0.002 |
Serum creatinine, mg/dl | 0.88 | 0.79–0.97 | 0.77 | 0.69–0.85 | <0.001 |
The urinary concentrations of all LMWPs were significantly higher in HIV‑infected patients than in the control group. The most significant difference was noted for β2M (about 3.8‑higher concentration in patients vs controls; Table 2). Moreover, the NGAL concentration was about 2.7‑fold higher and the KIM‑1 concentration was about 1.9‑fold higher in patients than in controls. Correlations between all examined parameters are presented in Table 3. The strongest correlations were revealed for the following parameters: α-GST vs GGT, AAP vs GGT, α-GST vs π-GST, NAG vs NAG‑B, and β-GR vs GGT.
Parameter | NAG | NAG‑B | β-GR | GAL | GGT | AAP | KIM | NGAL | α-GST | π-GST | NPT | β2M | RBP |
a Significant correlations between parameters
| |||||||||||||
NAG | – | 0.70a | 0.58a | 0.54a | 0.49a | 0.35a | 0.33a | 0.47a | 0.35a | 0.21a | 0.27a | 0.42a | 0.17a |
NAG‑B | 0.70a | – | 0.43a | 0.50a | 0.39a | 0.20 | 0.28a | 0.28a | 0.27a | 0.18a | 0.23a | 0.34a | 0.06 |
β-GR | 0.58a | 0.43a | – | 0.57a | 0.81a | 0.56a | –0.02 | 0.28a | 0.58a | 0.47a | –0.08 | 0.15 | –0.08 |
GAL | 0.54a | 0.50a | 0.57a | – | 0.55a | 0.39a | 0.14 | 0.20a | 0.38a | 0.23a | 0.14 | 0.06 | –0.04 |
GGT | 0.49a | 0.39a | 0.81a | 0.55a | – | 0.64a | –0.12 | 0.38a | 0.62a | 0.58a | –0.11 | 0.04 | –0.12 |
AAP | 0.35a | 0.20a | 0.56a | 0.39a | 0.64a | – | –0.02 | 0.21a | 0.49a | 0.55a | –0.08 | –0.04 | –0.16 |
KIM | 0.33a | 0.28a | –0.02 | 0.14 | –0.12 | –0.02 | – | 0.33a | 0.01 | –0.06 | 0.33a | 0.25a | 0.30a |
NGAL | 0.47a | 0.28a | 0.28a | 0.20a | 0.38a | 0.21 | 0.33a | – | 0.28a | 0.21a | 0.16 | 0.31a | 0.24a |
α-GST | 0.35a | 0.27a | 0.58a | 0.36a | 0.62a | 0.49 | 0.01 | 0.28a | – | 0.69a | 0.02 | 0.18 | –0.11 |
π-GST | 0.21a | 0.18a | 0.47a | 0.23a | 0.58a | 0.55 | –0.06 | 0.21a | 0.69a | – | –0.10 | 0.02 | –0.14 |
NPT | 0.27a | 0.23a | –0.08 | 0.14 | –0.11 | –0.08 | 0.33a | 0.16 | 0.02 | –0.10 | – | 0.39a | 0.10 |
β2M | 0.42a | 0.34a | 0.15 | 0.06 | 0.04 | –0.04 | 0.25a | 0.31a | 0.18 | 0.02 | 0.39a | – | 0.50a |
RBP | 0.17 | 0.06 | –0.08 | –0.04 | –0.12 | –0.16 | 0.30a | 0.24a | –0.11 | –0.14 | 0.10 | 0.50a | – |
Correlations between the urinary levels of the examined enzymes and LMWPs with the serum creatinine concentration in HIV‑infected patients were also examined. Moderate positive correlations with serum creatinine were shown only for NPT (R = 0.41, P <0.001) and β2M (R = 0.33, P <0.001). A correlation with the age of HIV‑infected patients was demonstrated only for KIM‑1 (R = 0.23, P = 0.03).
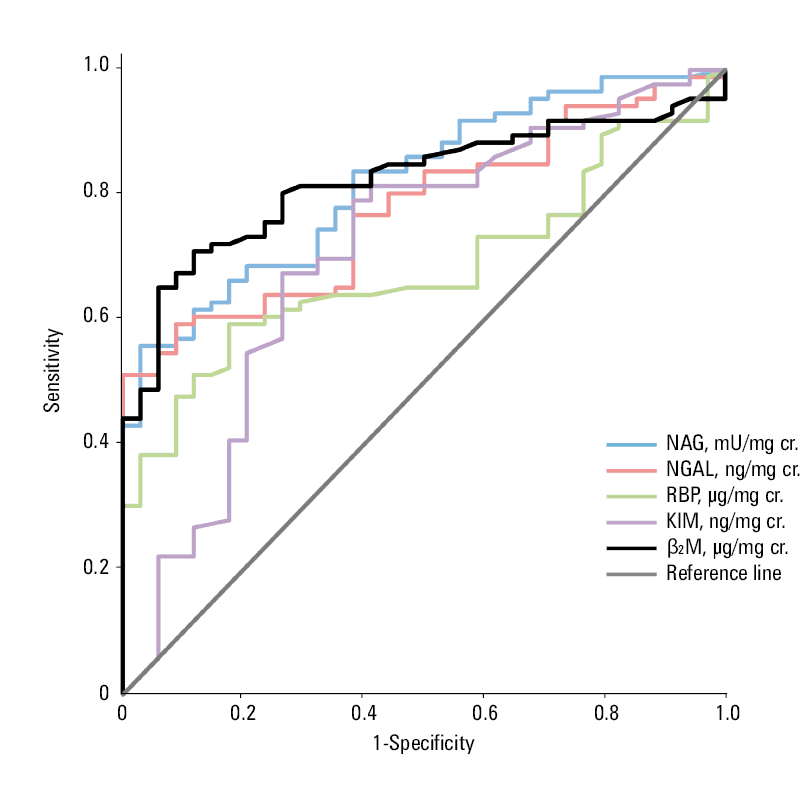
Selected parameters (β2M, NAG, NGAL, KIM‑1, and RBP) with the highest AUC, sensitivity, and specificity are shown in Table 4. The qualitative comparative assessment of the AUCs for these parameters is shown in Figure 1.
Parameters | AUC | P valuea | Sensitivity, % | Specificity, % | Cutoff |
a Significant differences between AUCs
| |||||
β2M, µg/mg cr. | 0.82 | <0.001 | 74 | 96 | 0.31 |
NAG, mU/mg cr. | 0.82 | <0.001 | 60 | 94 | 1.68 |
NGAL, ng/mg cr. | 0.78 | <0.001 | 63 | 91 | 20.45 |
KIM‑1, ng/mg cr. | 0.71 | <0.001 | 75 | 72 | 0.07 |
RBP, µg/mg cr. | 0.68 | <0.001 | 65 | 83 | 0.12 |
The results of the univariate logistic regression analysis for all parameters are presented in Table 5. The parameters that were shown to be the best indicators of the risk of kidney dysfunction in HIV‑infected patients were as follows: NAG, β2M, KIM‑1, and RBP (Table 6).
Parameters | Cutoff value | HIV‑infected patients | Controls | P value | OR (95% CI) |
NAG, mU/mg cr. | ≤1.68 | 39 (45.4) | 33 (97.1) | <0.001 | 1.00 |
>1.68 | 47 (54.7) | 1 (2.9) | 39.8 (5.2–304.1) | ||
NAG‑B, mU/mg cr. | ≤0.68 | 45 (52.3) | 30 (88.2) | <0.001 | 1.00 |
>0.68 | 41 (47.7) | 4 (11.8) | 6.8 (2.2–21.1) | ||
β-GR, mU/mg cr. | ≤0.24 | 9 (10.5) | 12 (35.3) | <0.001 | 1.00 |
>0.24 | 77 (89.5) | 22 (64.7) | 4.7 (1.7–12.5) | ||
GAL, mU/mg cr. | ≤0.12 | 11 (12.8) | 14 (41.2) | 0.001 | 1.00 |
>0.12 | 75 (87.2) | 20 (58.8) | 4.8 (1.9–12.1) | ||
GGT, mU/mg cr. | ≤10.33 | 14 (16.3) | 14 (41.2) | 0.004 | 1.00 |
>10.33 | 72 (83.7) | 5 (58.8) | 3.6 (1.5–8.8) | ||
AAP, mU/mg cr. | ≤2.08 | 27 (31,4) | 19 (55.9) | 0.01 | 1.00 |
>2.08 | 59 (68.6) | 15 (44.1) | 2.8 (1.2–6.3) | ||
KIM‑1, ng/mg cr. | ≤0.07 | 28 (32.6) | 25 (73.5) | <0.001 | 1.00 |
>0.07 | 58 (67.4) | 9 (26.5) | 5.8 (2.4–14.0) | ||
NGAL, ng/mg cr. | ≤20.45 | 42 (48.8) | 34 (100.0) | NA | 1.00 |
>20.45 | 44 (51.2) | 0 (0.0) | – | ||
α-GST, ng/mg cr. | ≤1.77 | 20 (23.3) | 19 (55.9) | <0.001 | 1.00 |
>1.77 | 66 (76.7) | 15 (44.1) | 4.2 (1.8–9.7) | ||
π-GST, nng/mg cr. | ≤4.19 | 45(52.33) | 27(79.41) | 0.01 | 1.00 |
>4.19 | 41(47.67) | 7(20.59) | 3.5 (1.3–8.9) | ||
NPT, ng/mg cr. | ≤202.83 | 51 (59.3) | 34 (100.0) | NA | 1.00 |
>202.83 | 35 (40.7) | 0 (0.0) | – | ||
β2M, µg/mg cr. | ≤0.31 | 30 (34.9) | 32 (94.1) | <0.001 | 1.00 |
>0.31 | 56 (65.1) | 2 (5.9) | 29.9 (6.7–133.3) | ||
RBP, µg/mg cr. | ≤0.12 | 35 (40.7) | 28 (82.4) | <0.001 | 1.00 |
>0.12 | 108 (59.3) | 6 (17.7) | 6.8 (2.6–18.1) | ||
Parameters | Cutoff value | Regression coefficients (B) | Standard error | Wald statistic | P value | OR (95% CI) |
Abbreviations: see Tables 1, 2, and 5 | ||||||
NAG, mU/mg cr. | >1.68 | 2.95 | 1.40 | 4.43 | 0.04 | 19.06 (1.23–296.62) |
RBP, µg/mg cr. | >0.12 | 2.00 | 1.08 | 3.42 | 0.06 | 7.41 (0.89–61.82) |
β2M, µg/mg cr. | >0.31 | 2.61 | 1.09 | 5.79 | 0.02 | 13.65 ( 1.62–114.76) |
KIM‑1, ng/mg cr. | >0.07 | 2.22 | 0.98 | 5.09 | 0.02 | 9.21 (1.34–63.31) |
Discussion
HIV infections are a considerable medical, social, and economic challenge worldwide. Antiretroviral drugs inhibit the proliferation of the virus and enable the restoration of the immune system. An appropriate regimen can improve long‑term survival of patients with HIV and prevent AIDS. However, ART may exert numerous side effects, including nephrotoxicity and CKD. Additionally, kidney damage resulting directly from HIV infection is associated with the expression of viral genes in kidney epithelial cells. An infected kidney epithelium acts as a separate viral compartment and facilitates the development of infection outside of the cardiovascular system. The disruption of cell processes involved in the cell cycle and apoptosis ultimately leads to the development of HIVAN.10,12 It was found that both glomerular mesangial cells and tubular cells are susceptible to HIV entry and are capable of supporting its replication. Importantly, the kidneys act as a virus reservoir.19
Due to an observed increase in the incidence of CKD in HIV‑infected patients, the diagnosis of renal dysfunction is necessary to monitor the disease course as well as to prevent end‑stage kidney disease and optimize current ART. In our study, the urinary levels of 13 selected biochemical parameters, including enzymes and LMWPs, were determined using noninvasive methods to assess their potential diagnostic value as noninvasive markers of renal dysfunction in patients with HIV infection. To our best knowledge, such a complex panel of parameters has not been previously examined in this population. We observed significant differences in the examined parameters between patient and control groups (except AAP).
There have been reports on the use of lysosomal enzymes (NAG, NAG‑B, β-GR, GAL) and brush border enzymes (AAP, GGT) in the assessment of renal tubular function.20,21 Some drugs, nephrotoxic compounds, as well as disease states may induce inflammation, mechanical injuries, and lysosomal membrane permeability. These disturbances lead to a release of enzymes, primarily located in the organelles, and their increased activity in urine reflects renal tubular dysfunction.2,20
Our study showed that of all analyzed lysosomal enzymes, NAG had the best diagnostic value in the assessment of renal dysfunction among patients with HIV. We also found a significant correlation between NAG and NAG‑B. The NAG enzyme is present in a free form in lysosomes, and while the NAG‑B isoform is bound to the lysosome membranes, its release is the result of damage to structures within the proximal renal tubules.21,22 NAG is a useful marker in the early diagnosis of CKD. In addition, it is a sensitive and early indicator of pathological changes in the kidneys exposed to nephrotoxic xenobiotics.23 The increased release of lysosomal enzymes from renal tubular epithelial cells that we observed in our study may indicate an ongoing inflammatory process in the kidneys, as the rising number of lysosomes in tubular cells reflects defense mechanisms of kidney cells.
In a study of HIV‑infected patients on cART therapy, Ando et al24 reported renal tubular damage in 25% of patients on the basis of an increased activity of NAG and GGT. Moreover, they showed a correlation of tubular damage with therapy duration and the levels of C‑reactive protein (acute phase protein indicating inflammation). In our study, we also noted a correlation between NAG and GGT. The source of AAP and GGT in urine is the brush border of the proximal renal tubule. Alanyl aminopeptidase is a cell‑surface enzyme, while GGT is associated with cytoplasmic cell membranes. Damage to cells or their membranes due to the action of xenobiotics or drugs, or in the course of various diseases or hypoxia, results in a direct release of enzymes into urine.25,26 The significant correlation between these enzymes shown in our study may indicate damage to the brush border of the proximal tubules.
In our study, we also observed that LMWP concentrations were significantly higher in HIV‑infected patients than in controls. The largest differences were found for KIM‑1, NGAL, and β2M (by 54%, 37% and 26%, respectively). The KIM‑1 protein is probably involved in the transformation of renal epithelial cells into phagocytes, which alleviates an inflammatory reaction. The protein shows high expression and increased synthesis in response to renal tubular damage, especially in the S3 segment of the proximal renal tubules, in the outer layer of the core, which is particularly sensitive to ischemia.27,28 Experimental data suggest that KIM‑1 may be involved in restoring the function and morphological integrity of renal epithelial cells in response to damage, which makes this protein a potential indicator of renal function.29-31 Bonventre et al32 found an increase of KIM‑1 expression in response to nephrotoxins: tetrafluoroethyl‑1‑cysteine, folic acid, and cisplatin. Gil et al33 reported an increase in KIM‑1 concentrations after paraquat intoxication. An increase in KIM‑1 expression was also observed after administration of gentamycin, inorganic mercury, or hexavalent chromium to rats. The increase was correlated with the degree of histopathological lesions in the kidney and was much higher than the increase of serum creatinine.34 In our study, only KIM‑1 was shown to correlate with the age of HIV‑infected patients. Along with the aging process in the kidneys, structural and functional changes occur. Microscopic images show a reduction in the number of active nephrons. The concentration of KIM‑1 in urine is closely related to the level of tissue KIM‑1 and correlates with the degree of renal tissue damage.29
The expression of NGAL in the renal cortical tubules, blood, and urine increases after exposure to ischemia or nephrotoxic agents.35 Increased NGAL expression in urine is caused by impaired absorption resulting from proximal tubular damage. The presence of this protein in urine may also indicate increased de novo synthesis of NGAL in further nephron segments, particularly in the loop of Henle and the collecting tubule.36 Sola‑Del Valle et al37 reported a significantly higher urinary NGAL concentration in patients with HIVAN than in those with other kidney diseases, which indicates the usefulness of this marker in the diagnosis of HIVAN.
The β2M excretion is measured to assess renal tubular function in response to the action of nephrotoxic compounds. It can also be measured to monitor kidney function after exposure to cytostatic drugs that are nephrotoxic (eg, cyclophosphamide, cisplatin). It was suggested that β2M may have diagnostic significance during treatment with gold salts and cyclosporine.38 The protein was also reported to be an indicator of nephropathy caused by analgesic overdose as well as a useful marker in monitoring aminoglycoside nephrotoxicity. An increase in β2M levels was also noted with progression of such diseases as Sjögren syndrome, systemic lupus erythematosus, rheumatoid arthritis, Crohn disease, and AIDS.39
Retinol‑binding protein is easily filtered in the glomerulus and is almost completely reabsorbed in the proximal tubule. Even a slight impairment of the renal tubule can lead to increased urinary excretion of RBP.40,41 Kuźniar et al42 reported that an increase in urinary RBP excretion may be due to interstitial damage and not a decrease in the number of active nephrons. Such a conclusion was based on the lack of a correlation between RBP excretion and serum creatinine concentrations. Our patients also did not show a significant correlation between urinary RBP and serum creatinine levels. The protein can also be used as a marker of a tubulointerstitial lesion in the course of systemic diseases, including hypertension.43 Increased RBP levels were also noted in the urine of patients with membranoproliferative glomerulonephritis. Cohen et al44 reported that RBP may be considered as a uremic toxin contributing to disorders of the immune response in patients with acute renal injury.
Increased urinary levels of the glutathione transferases α-GST and π-GST after exposure to nephrotoxic agents is explained by the excessive permeability of the renal tubular epithelium due to cell damage. A correlation between the urinary activity of GSTs and acute tubular damage was reported also in other kidney disorders, for example, in diabetic nephropathy.45 It has been shown that the α-GST level is significantly elevated in patients with hepatitis C virus compared with controls.46,47 In our study, we showed a strong significant correlation between α-GST and π-GST, which confirms proximal tubular damage (location of α-GST) and provides further evidence for the disorders of tubular function and the loop of Henle (location of π-GST) in HIV‑infected patients.
An important but a nonspecific marker of HIV infection is NPT.48 The assessment of NPT levels is useful for monitoring the course of infection, because patients in the asymptomatic stage have chronically elevated NPT levels, while even much higher values are observed in patients with disease progression who develop full‑blown AIDS.49 Moreover, an elevated NPT level is detectable already in the early stages of HIV infection, while numerous other biomarkers remain within the reference range.50 In our study, a significant positive correlation was found between urinary NPT and β2M levels and serum creatinine concentrations in patients with HIV infection, which reflects progression of renal dysfunction. This confirms the usefulness of NPT and β2M in the assessment of progressive renal failure.
In conclusion, we assessed the utility of 13 urinary parameters, including enzymes (NAG, NAG‑B, β-GR, GAL, AAP, and GGP) and LMWPs (KIM‑1, NGAL, α-GST, π-GST, NPT, β2M, and RBP), as indicators of renal dysfunction in HIV‑infected patients. A logistic regression analysis, performed for each parameter separately, identified NAG, β2M, KIM‑1, and RBP as the best diagnostic markers of impaired kidney function in this patient population. Proper early detection of functional and structural kidney disorders in seropositive patients would help apply appropriate preventive measures and optimize the therapy. Further studies on a larger population and additional analyses, for example, of ART or comorbidities, are needed.
- Seyler L, Lacor P, Allard SD. Current challenges in the treatment of HIV. Pol Arch Intern Med. 2018; 128: 609‑616. | Crossref
- Wyatt CM. Kidney disease and HIV infection. Top Antivir Med. 2017; 25: 13‑16.
- Marchewka Z, Szymańska B, Szymanek‑Pasternak A, et al. The usefulness of the determination of activity of selected enzymes in the urine in the assessment of kidney function injury in HIV‑infected patients on antiretroviral treatment . Diagn Lab. 2014; 50: 227‑234.
- Horban A, Podlasin R, Cholewińska G, et al. The rules of care for people with HIV. Recommendation of the Polish AIDS Scientific Society. Warsaw, Poland: Polskie Towarzystwo Naukowe AIDS; 2018: 397‑407, 408‑415.
- Wearne N, Okpechi IG. HIV‑associated renal disease ‑ an overview. Clin Nephrol. 2016; 13 (Suppl 1): 41‑47. | Crossref
ARTICLE INFORMATION