Long-term outcome of renal transplantation: a 10-year follow-up of 765 recipients
Key words: azathioprine, immunosuppression, outcome, posttransplant care, renal transplantation


 CC BY-NC-SA 4.0
Long-term outcome of renal transplantation: a 10-year follow-up of 765 recipients
Introduction: Renal transplantation is a treatment of choice for patients with end‑stage renal disease. The main goal of transplant care is to achieve the best long‑term patient survival (PS) and graft survival (GS).
Objectives: We aimed to assess the impact of various immunosuppression (IS) protocols on PS and GS following renal transplantation.
Patients and methods: This was a retrospective single‑center cohort study including a total of 765 consecutive adult renal transplant recipients (RTRs) who underwent transplantation between 1998 and 2003. The primary endpoints included PS and GS. The secondary endpoints were graft function determined by estimated glomerular filtration rate and hospitalization length per patient per year.
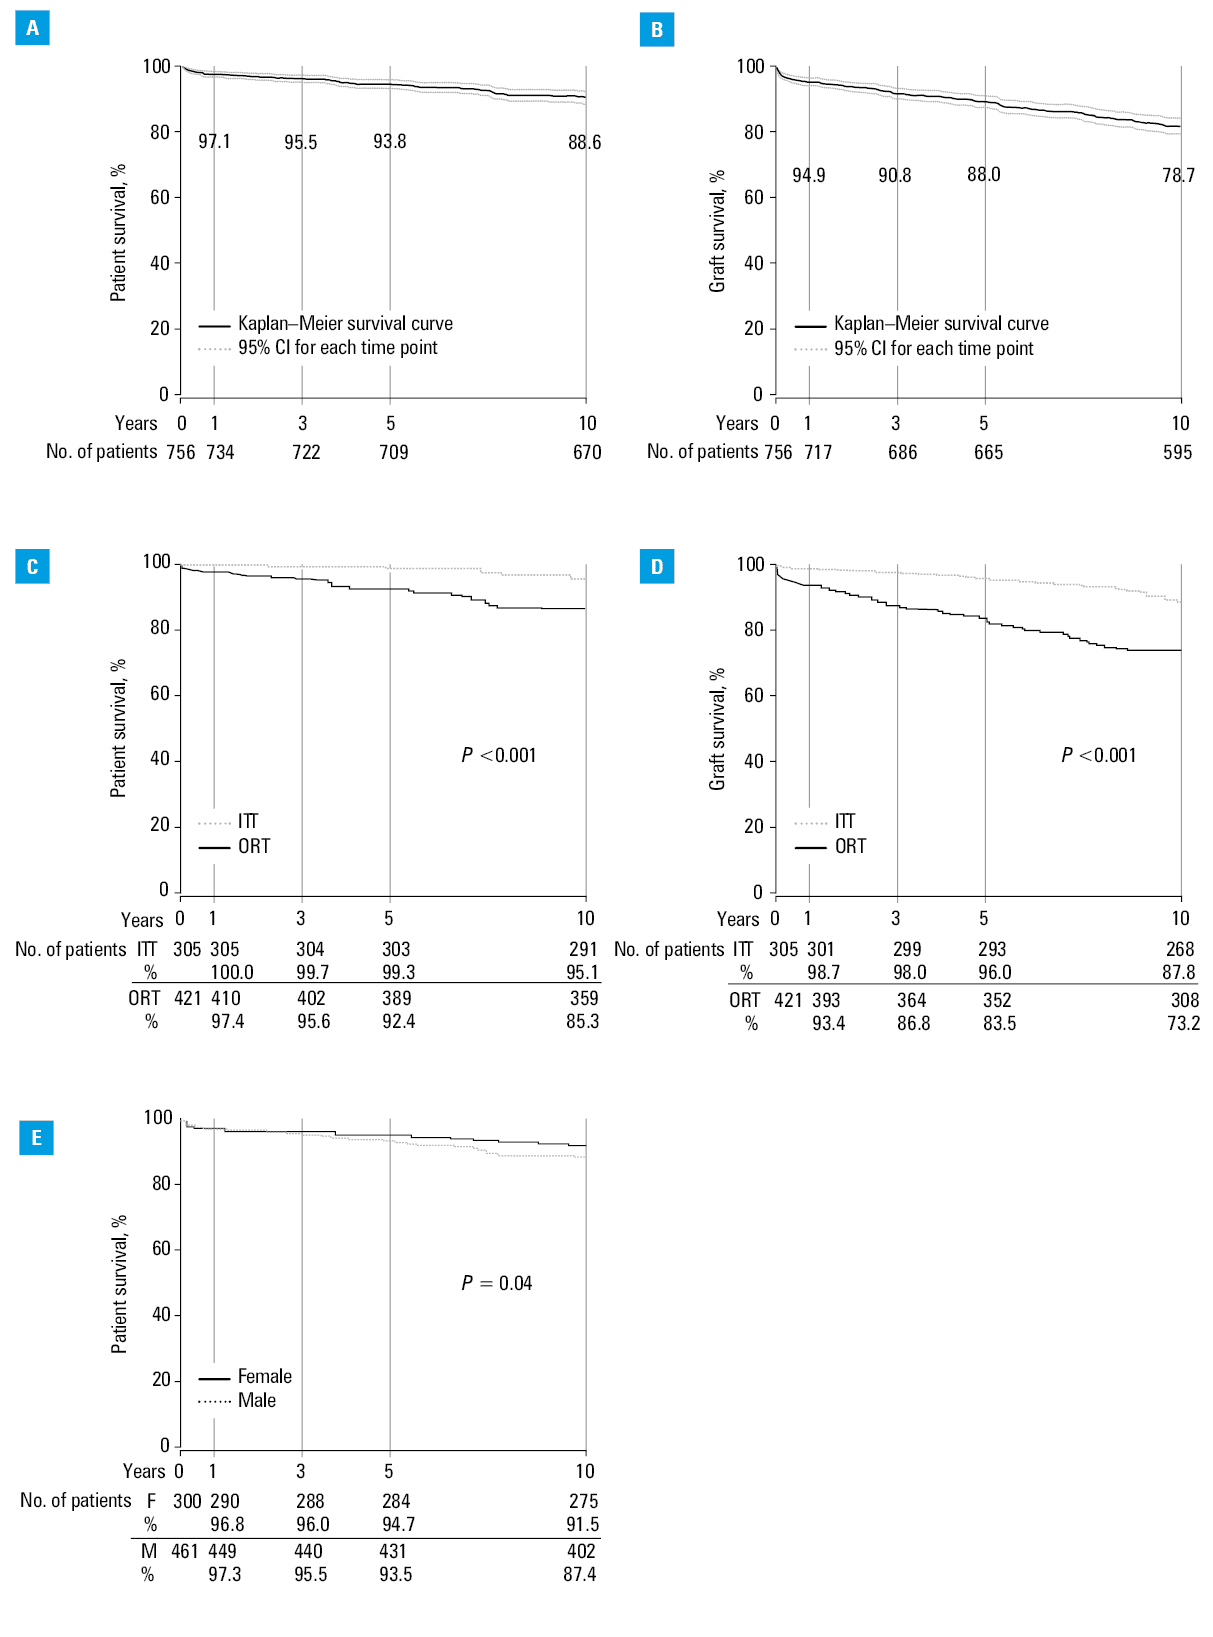
Results: Ten‑year PS and GS rates were 88.6% and 78.7%, respectively. The intent‑to‑treat (ITT) group received IS that was later changed, whereas in the group on randomized therapy (ORT), the same IS protocol was maintained during follow‑up. The ITT group had significantly better PS and GS than the ORT group. In the ITT group, patients treated with a combination of tacrolimus (TAC) and azathioprine (AZA), cyclosporine (CSA) and AZA, or CSA and mycophenolic acid metabolites (MPAs) had significantly better PS than those treated with TAC and MPA. The ORT group receiving AZA in any combination also had significantly better PS than MPA‑treated individuals.
Conclusions: The effect of IS protocols on long‑term outcomes varies depending on patient subpopulations. Immunosuppressive therapy solves rejection‑related problems but does not address the increasing mortality of RTRs due to cardiovascular diseases, malignancies, or infections. Therefore, treatment recommendations should be individualized and posttransplant care, provided mainly by internists, should be carefully structured to improve long‑term outcomes of renal transplantation.
Introduction
The main goal of transplant care is to achieve the best long‑term patient survival (PS) and graft survival (GS). Since the introduction of kidney transplantation to clinical practice in 1954, PS and GS have improved thanks to advances in surgical techniques, perioperative care, and immunosuppression (IS) treatment.1-4 However, for the last 2 decades, there have been no further improvements in this area.4,5 This is partly due to the growing incidence of IS‑related infections, malignancies, and cardiovascular comorbidities. Therefore, the role of IS in improving long‑term outcomes has been intensively studied. On the one hand, there has been a increasing number of renal transplant recipients (RTRs) with data from long‑term follow‑up, which should enable an identification of factors influencing the outcome.6-8 On the other hand, numerous questions remain unanswered. For example, only 2% of the recommendations developed by the Kidney Disease: Improving Global Outcomes on the management of RTRs are supported by level A quality evidence, while the majority (67%) are graded C or D.9,10 This is due to a great diversity between the included clinical trials in terms of donors (eg, extended donor criteria and age), recipients (eg, increasing comorbidities), center experience, and protocols used. Nevertheless, a considerable number of factors affecting the outcomes have been established. Some of them, such as age, sex, ethnicity, and primary kidney disease, cannot be modified at the time of transplantation. On the other hand, such factors as cold ischemia time (CIT) and renal replacement therapy can be influenced by allocation policies, or, for example, the choice of a specific IS regimen can be at the discretion of a transplant physician. Therefore, the impact of IS on the outcomes of RTRs today is very important. This study aimed to assess the impact of different types of IS protocols and other factors on the long‑term outcome of an RTR population in a single center.
Patients and methods
This was a single‑center retrospective study of 765 consecutive adult white RTRs who underwent renal transplantation between 1998 and 2003. The follow‑up duration was 10 years and posttransplant care was provided in a single transplant unit.11 The survival function could not be analyzed in 9 RTRs (1.2%) with missing outcome data (Table 1). In 608 RTRs (79.5%) who were followed and in 148 patients (19.3%) who were lost to follow‑up, the Kaplan–Meier estimate with right‑censored data was computed.
Follow‑up data | All (n = 765) | ORT (n = 422) | ITT (n = 308) | Women (n = 302) | Men (n = 463) | No induction (n = 643) | No induction + ORT (n = 355) | No induction + ITT (n = 258) |
Data are presented as number (percentage) of patients.
Abbreviations: ITT, intent‑to‑treat; ORT, on randomized therapy | ||||||||
Death | 72 (9.4) | 41 (9.7) | 15 (4.9) | 21 (7) | 51 (11) | 62 (9.6) | 36 (10.1) | 12 (4.7) |
Graft loss | 143 (18.7) | 91 (21.6) | 41 (13.3) | 59 (19.5) | 84 (18.1) | 120 (18.7) | 76 (21.4) | 33 (12.8) |
Follow‑up completed | 393 (51.4) | 181 (42.9) | 214 (69.5) | 167 (55.3) | 231 (49.9) | 340 (52.9) | 157 (44.2) | 182 (70.5) |
Complete data | 608 (79.5) | 313 (74.2) | 270 (87.7) | 247 (81.8) | 366 (79) | 522 (81.2) | 269 (75.7) | 227 (88) |
Lost to follow‑up | 148 (19.3) | 108 (25.6) | 35 (11.4) | 53 (18) | 95 (20.5) | 115 (17.9) | 85 (23.9) | 28 (10.9) |
Missing data | 9 (1.2) | 1 (0.2) | 3 (1) | 2 (0.7) | 2 (0.4) | 6 (0.9) | 1 (0.3) | 3 (1.2) |
In most patients, a standard triple IS regimen was administered, which included a calcineurin inhibitor (CNI; tacrolimus [TAC] or cyclosporine [CSA]), steroids, and one of the antimetabolites: azathioprine (AZA) or mycophenolic acid metabolite (MPA). Only 1% of RTRs did not receive a CNI, 3.8% received no steroids, and 12.9% did not receive any antimetabolites. Proliferation signal inhibitors were used in 8.8% of RTRs: everolimus in 14 RTRs (1 in combination with TAC and 13 in combination with CSA), sirolimus in 53 RTRs (31 in combination with TAC; 13, with CSA; and 3, with MPA). Induction therapy with antithymocyte globulin (rabbit‑ATG) or anti‑CD25 antibodies (daclizumab or basiliximab) were used in 15.9% of patients. Demographic data, laboratory results, and adverse events were analyzed based on medical records. For this type of a retrospective study, formal patient consent and the approval of an institutional review board were not required.
All consecutive RTRs were evaluated and were then divided into 2 groups. The first group included patients who did not undergo induction therapy. The other group comrpised patients at high immunological risk, who underwent second or third renal transplantation and received induction therapy. Double‑organ transplant recipients were excluded. In all RTRs and the no‑induction group, 2 subgroups were classified: 1) intent‑to‑treat (ITT), and 2) on randomized therapy (ORT). The ITT group included patients who received a transplanted organ and at least 1 dose of intended IS therapy, but the therapy was later changed during the follow‑up. Patients in whom initial IS was maintained throughout the entire follow‑up constituted the ORT group. The distribution of patients as well as their demographic and outcome data by a study subgroup are presented in Table 2.
Parameter | All (765; 100%) | ORT (422; 55.2%) | ITT (308; 40.3%) | Induction (122; 15.9) | No induction (643; 84.1%) | No induction + ORT (355; 55.2%) | No induction + ITT (258; 40.1%) |
SI conversion factors: to convert creatinine to µmol/l, multiply by 8.42.
Abbreviations: CIT, cold ischemia time; eGFR, estimated glomerular filtration rate; others, see Table 1 | |||||||
Missing data on ORT/ITT, n (%) | 35 (4.6) | – | – | 5 (4.1) | 30 (4.7) | – | – |
Sex, women/men, n (%) | 463 (60.5) / 302 (39.5) | 268 (63.5) / 154 (36.5) | 177 (57.5) / 131 (42.5) | 67 (55) / 55 (45) | 396 (61.6) / 247 (38.4) | 227 (63.9) / 128 (36.1) | 155 (60.1) / 103 (39.9) |
Age, y, mean (SD) | 42 (12.7) | 42.5 (13.1) | 41 (12.4) | 41 (11.9) | 42.2 (12.8) | 42.6 (13.1) | 41.4 (12.4) |
CIT, h, mean (SD) | 25.1 (9.5) | 25 (9.5) | 25 (9.6) | 25.2 (9.4) | 25 (9.5) | 25.2 (9.5) | 24.7 (9.6) |
HLA antigen mismatch, mean (SD) | 2.9 (1.2) | 3 (1.2) | 2.9 (1.3) | 3.1 (1.3) | 2.9 (1.2) | 3 (1.2) | 2.8 (1.2) |
Average 10‑year eGFR, ml/min, mean (SD) | 51.3 (19.1) | 52.4 (19.8) | 49.7 (16.2) | 54.6 (22.3) | 50.6 (18.3) | 52.1 (19.8) | 48.9 (16.2) |
Average 10‑year serum creatinine, mg/dl, mean (SD) | 1.7 (0.8) | 1.7 (0.9) | 1.7 (0.8) | 1.6 (0.7) | 1.8 (0.8) | 1.7 (0.9) | 1.8 (0.8) |
Machine perfusion, yes/no, n (%) | 554 (72.4) / 211 (27.6) | 316 (74.9) / 106 (25.1) | 205 (66.6) / 103 (33.4) | 75 (61.5) / 47 (38.5) | 479 (74.5) / 164 (25.5) | 273 (76.9) / 82 (23.1) | 177 (68.6) / 81 (31.4) |
The primary endpoints were PS and GS, while the secondary endpoints included graft function, assessed by estimated glomerular filtration rate (eGFR, calculated with the Chronic Kidney Disease Epidemiology Collaboration [CKD‑EPI] equation) in every posttransplant year, as well as hospitalization length per patient per year as an indirect measure of adverse events.12 The effect of the IS regimen on the primary and secondary endpoints was assessed: first, by comparing the outcomes in patients treated with one of the 4 pairs of immunosuppressive drugs: CSA and AZA vs CSA and MPA vs TAC and AZA vs TAC and MPA; and second, by comparing AZA‑treated patients with those receiving MPA (regardless of the type of the CNI used) as well as CSA‑treated patients with those receiving TAC (regardless of the type of the antimetabolite used). We also investigated the relationship of the demographic parameters (age, sex), primary kidney disease, dialysis vintage, HLA antigen mismatch, use of machine perfusion (MP), and CIT with the primary and secondary endpoints.
Statistical analysis
The survival functions were computed using the Kaplan–Meier estimate with right‑censored data and compared using the log‑rank test. The Welch t test was used to predict potential variations between the groups (divided according to sex, MP used, CIT, or dialysis vintage) in terms of average population results for primary and secondary endpoints (dependent variables). The Pearson χ² test was used to determine the effect of variables such as IS drugs, causes of end‑stage renal disease (ESRD), sex, or MP use on the outcomes. The strength of the associations between the variables and graft function and hospitalization length was expressed by the Pearson correlation coefficient. A significance test for the Pearson correlation coefficient was performed to identify a potential linear relationship between the pair of variables. The analysis of variance was used to study the association between the subgroups of patients treated with different IS drugs or with different causes of ESRD and their renal function. If the result was significant, the groups were compared using the set of post hoc Tukey HSD tests. A P value of less than 0.05 was considered significant.
Results
All 765 RTRs were white, and their mean (SD) age at transplantation was 41.9 (12.8) years. The baseline demographic data as well as average 10‑year serum creatinine and eGFR levels are summarized in Table 2. Of the 765 patients, 702 (91.7%) received their first transplant and the remaining 63 individuals (8.3%) had a history of renal transplantation. In 718 patients (93.9%), transplantations were from deceased donors, and in 47 patients (6.1%), from living donors. Primary kidney disease was unknown in 447 patients (58.4%). In the remaining 318 individuals, the leading causes of transplantation were tubulointerstitial nephritis (9.8%), biopsy‑proven glomerulonephritis (9.5%), autosomal dominant polycystic kidney disease (9.5%), and diabetic nephropathy (5.1%). The mean (SD) CIT was 25.06 (9.5) hours. A total of 554 kidneys were machine perfused prior to transplantation. The IS regimen was changed during the 10‑year follow‑up in 42.2% of patients (Table 2). Only 51.2% of patients who received the combination of CSA and MPA remained on this regimen during the follow‑up; in the other subgroups, the rates were as follows: CSA and AZA, 62%; TAC and MPA, 57.9%; and TAC and AZA, 72.3%.
The 10‑year PS and GS rates were 88.6% and 78.7%, respectively (Figure 1A and 1B). The ITT group had significantly better PS and GS than the ORT group (Figure 1C and 1D). In the analysis for the whole study group, female sex was associated with better PS (Figure 1E). Other variables, such as age, primary cause of ESRD, dialysis vintage, HLA antigen matching, MP use, CIT, or IS regimen, had no influence on the primary endpoints. Renal function was affected by the use of steroids, type of the antimetabolite, and hospitalization length (Supplementary material, Figure S1). The mean hospitalization length varied between consecutive years; it was the longest in the first year (37.3 days) and then decreased gradually to reach 1.7 days in year 10. All patients had at least 1 hospitalization related to the postoperative care. There were no significant correlations between other studied factors and the secondary outcomes.
Patients without induction therapy
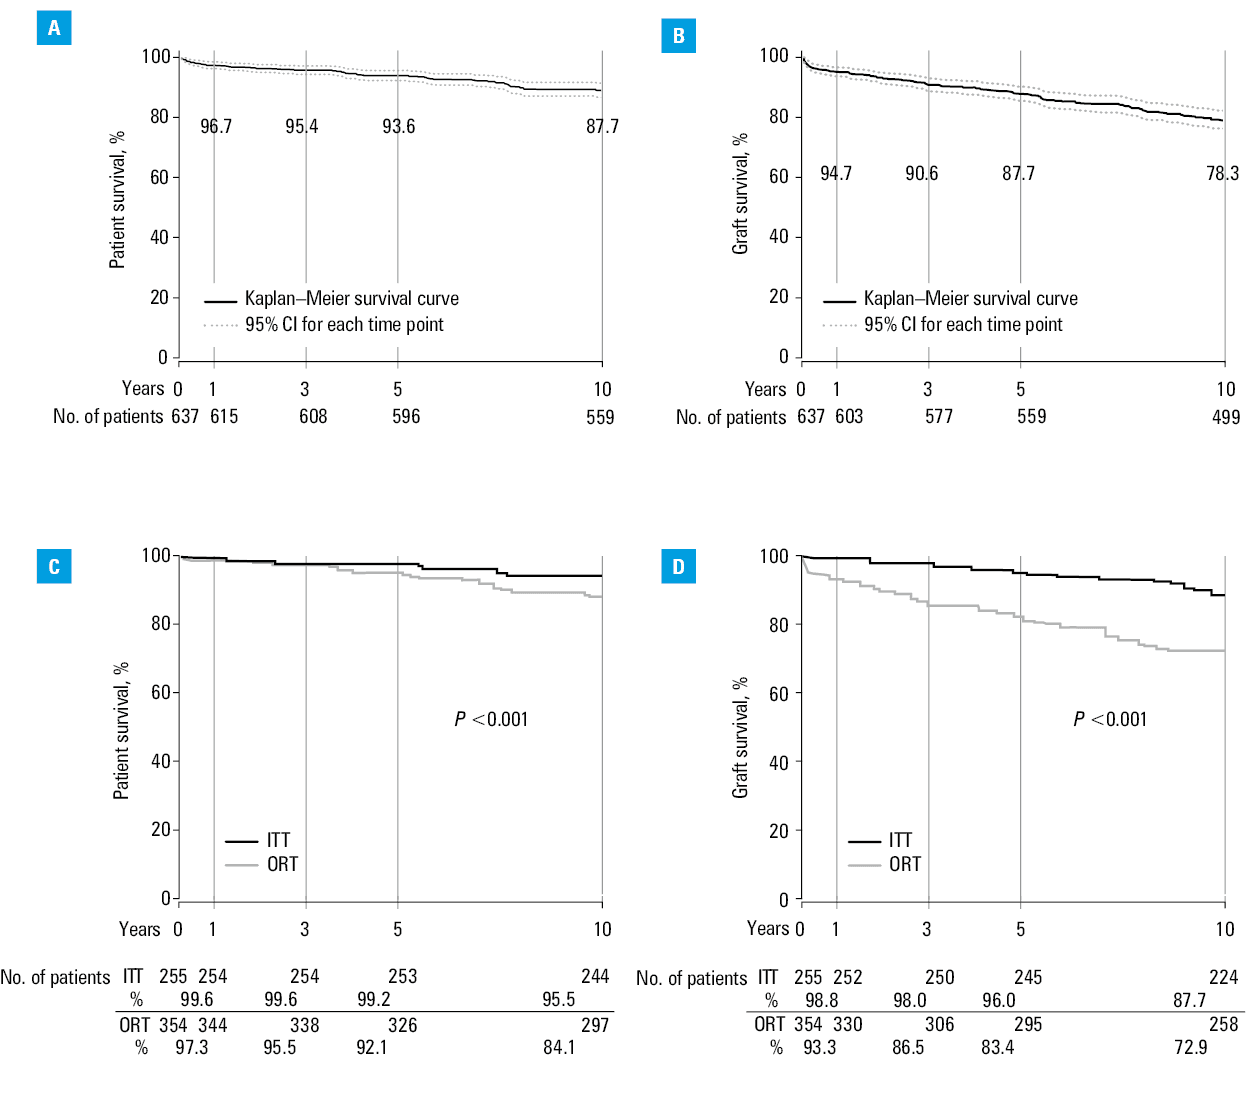
After exclusion of patients who received induction therapy, data of 643 RTRs were available for analysis. They were all recipients of their first graft, 59.9% of them remained in the ORT group, 17.9% were lost to follow‑up, and the outcome data were missing in 0.9% (Table 2). The 10‑year PS and GS rates were 87.7% and 78.3%, respectively (Figure 2A and 2B). Interestingly, the only variable that significantly affected the primary endpoints was the change of an IS regimen. Both PS and GS were significantly better in the ITT than in the ORT group (Figure 2C and 2D). On the contrary, renal function was significantly better in the ORT group (Supplementary material, Figure S2C). Additionally, renal function was affected by the use of steroids, it was significantly better in MPA- than in AZA‑treated patients, and it correlated significantly with the hospitalization length (Supplementary material, Figure S2A, S2B, and S2D). Other factors, such as age, primary cause of ESRD, dialysis vintage, HLA matching, MP use, or CIT, did not significantly affect the primary and secondary outcomes.
Analysis of the intention‑to‑treat subgroup
Patients in the ITT group who did not receive induction therapy and were treated with a combination of TAC and AZA, CSA and AZA, or CSA and MPA had significantly better PS than the subgroup treated with TAC and MPA (Supplementary material, Figure S3A). Moreover, in the ITT group, PS was significantly better in women than in men (Supplementary material, Figure S3B). Other variables had no significant effect on PS or GS in the ITT group.
In the ITT group, renal function was significantly better in patients who did not receive steroids in comparison with those on steroid treatment and was correlated with the hospitalization length (Supplementary material, Figure S3C and S3D). The remaining variables had no significant effect on renal function and hospitalization length.
Analysis of patients who remained on randomized therapy
The choice of a specific IS regimen had no significant effect on PS in the ORT group (Supplementary material, Figure S4A). However, patients who received AZA (regardless of the type of the CNI) had significantly better PS than MPA‑treated individuals (Supplementary material, Figure S4B). The GS of patients in the ORT group was not significantly associated with any of the studied parameters, whereas graft function was significantly better in patients who received no steroids and correlated significantly with the hospitalization length (Supplementary material, Figure S4C and S4D).
Discussion
Our study showed that the 10‑year PS and GS rates were significantly affected by the type of IS in selected subgroups of a large RTR population from a single center. The subgroup analysis showed that the ITT group had significantly higher PS and GS rates than the ORT group. Furthermore, the analysis revealed that AZA was superior to MPA as an adjunct to CNI‑based IS regimens. Significant differences in the outcome between ITT and ORT groups was found both for the entire study population and for the group who received no induction therapy. We demonstrated previously that classification of RTRs into ITT and ORT groups can yield different results, particularly with longer follow‑ups.13,14 Therefore, we suggest that every analysis of transplant outcome data should differentiate between ITT and ORT. Moreover, in line with a position statement by O’Connell et al,15 we believe that a subgroup analysis may help identify better treatment options and tailor them to individual patient needs. We did not show any specific IS combination to be superior when the whole study group was analyzed. However, significant differences in outcomes where revealed when the ITT subgroup of patients who received no induction therapy was selected. The ITT subgroups treated with the combination of TAC and AZA, CSA and AZA, or CSA and MPA had significantly better PS than the subgroup treated with TAC and MPA, independently of sex. Moreover, patients in the ORT group who received AZA had significantly better PS than MPA‑treated individuals. In order to fully understand these findings, we would need to know the exact causes that led to the change of the IS regimen. Nevertheless, our results indicate that subgroup analyses may lead to different conclusions, which is important from the perspective of personalized medicine.
There is no “one‑fits‑all” IS regimen in renal transplantation, and it is not surprising that results from large cohort studies do not favor specific drug combinations. Previously, the analysis of Collaborative Transplant Study (CTS) registry data revealed no differences in PS and GS of RTRs treated with any of the 4 standard IS regimens.6 Meta‑analyses of randomized trials also did not confirm the superiority of any specific IS protocols.9 However, it should be underlined that meta‑analyses have certain limitations. For example, in numerous studies, the long‑term outcome data are missing, the selection of patients using enrollment criteria precludes generalization of conclusions, and the quality of outcome reporting is debatable. A search for randomized trials of primary IS in kidney transplantation in the Cochrane Renal Group’s Specialized Register (2000–2012) yielded a conclusion that outcome reporting is inconsistent and frequently incomplete. Therefore, published estimates of treatment effects should be evaluated with caution.16 Our study was retrospective, with all the limitations inherent to such a design, but the population was uniform in terms of ethnicity, single‑center procedures, posttransplant care, and data collection. Moreover, all consecutive RTRs were assessed and the percentage of individuals lost to follow‑up was low. These factors contribute to a higher quality of data but also make it difficult to translate the results into the general population.
According to the CTS6 and Organ Procurement and Transplantation Network/Scientific Registry of Transplant Recipients7 reports, today RTRs receive CNIs mostly in combination with MPA, whereas AZA is used increasingly less often in standard IS regimens. Our results show that a high proportion of RTRs may remain on the regimens administered years ago (CSA and AZA, 62%; TAC and AZA, 72.3%) and also that some patients may still derive benefit from such a therapy. Therefore, the use of AZA should be assessed again in the context of long‑term outcomes. A good example is an extended 15‑year follow‑up of a randomized trial, the short‑term results of which contributed to a shift from AZA to MPA in the late 1990s.17 The authors found no significant differences in long‑term PS and GS between the AZA and MPA groups.18 Moreover, in a recent meta‑analysis involving 2987 participants of 16 studies, no significant difference in all‑cause mortality was found between MPA and AZA treatments.19 Considering our results, the data cited above, as well as the differences in cost between IS based on AZA in comparison with MPA, we believe that the use of AZA should be reconsidered in the modern era of transplantation.
Although IS therapy has improved outcomes related to graft rejection in RTRs,20 previous studies showed that these patients increasingly die from cardiovascular diseases, malignancies, or infections.2,7,8 All these posttransplant conditions are within the scope of internal medicine. Therefore, we believe that the structure of posttransplant care may have even bigger impact on survival, and it is the field of internal medicine that is the mainstay of posttransplant care. Internists provide continuous and long‑term care for RTRs. It was reported that posttransplant outcomes may vary between countries because of differences in allocation policies, cultural preferences favoring either living or deceased donation, and government‑funded health care.4 For example, Ojo et al21 reported that the adjusted 10‑year PS after a kidney transplant from deceased donors was 86% in Spain in contrast to 67% in the United States. Using the CTS database, Gondos et al22 showed that 10‑year unadjusted deceased donor allograft survival was superior in Europe (56.5%) compared with the United States (46%, 48%, and 34% for whites, Hispanics, and African Americans, respectively). This can be explained by the fact that in the United States patients lose medical coverage for IS therapy 3 years after transplantation, leading to nonadherence in some cases and late allograft loss.23
In Poland, the costs of IS therapy are covered as long as necessary. In our center, RTRs remain under long‑term medical care provided by the same transplant team. In our outpatient clinic, patients are routinely consulted by a transplant physician with a background in internal medicine 4 times a year and additionally in urgent medical conditions. Each patient is assigned to one transplant specialist, who is also involved in hospital care.11 Lodhi et al24 reported that close lifelong follow‑up and adequate care delivery could improve the outcome of RTRs. In our opinion, over 50 years of transplant experience and development of our local system of care contributed to the improvement of renal transplantation outcomes in our center. Of note, differences in outcomes between countries may also result from medical reasons. For example, diabetes mellitus is known as one of the diseases most adversely affecting the outcomes. Multiple studies have shown a higher prevalence of ESRD due to diabetic nephropathy among recipients in the United States than in other countries.4 Ojo et al21 reported the rates of 24.1% for recipients in the United States as compared with 5.6% in Spain. In the study by Gondos et al,22 the rates were 26% for the United States and 8.3% for Europe. Our result (5.1%) is comparable with the Spanish data. Given that diabetic nephropathy is associated with increased cardiovascular morbidity and mortality, this may help explain better long‑term PS in our and other European centers.
Sex is associated with the incidence and progression of a wide variety of diseases and conditions related to transplantation, including the pharmacokinetics and pharmacodynamics of IS.25 Therefore, we studied the effect of sex on renal transplantation outcomes. We found that female sex was an independent predictor of superior PS both in the whole population of RTRs and in the ITT subgroup. This is an interesting observation because previous studies did not reveal the effect of sex (either of donors or recipients) on PS and GS rates.26 Only the combination of sexes between donors and recipients was reported to determine GS, and transplantation from a male donor to a female recipient yielded better outcomes than female‑to‑male transplantation.27 Such a finding may have a more practical significance as it could determine the allocation of organs for transplantation. On the other hand, our observation on the effect of sex has only a limited predictive significance.
Our study has several other limitations. The study design was retrospective. Data on modifications of IS regimens are lacking, including how many times the drug protocols were changed, what drug switches were performed, and what were the exact indications for the switch. Moreover, we did not analyze data on comorbidities or on medications other than IS and their effect on outcomes. Another limitation concerns the possible learning curve for the use of MPA and TAC. Both drugs were introduced in Poland in the late 1990s; therefore, our patient population was probably the first to be treated with these agents. In our opinion, this might have influenced the outcomes. Furthermore, our observation that treatment with the combination of TAC and MPA in the ITT group was associated with inferior outcomes is limited by a small sample size. Finally, our cohort was homogenous in terms of race, and most recipients underwent cadaveric transplantation. As such, it may be difficult to compare our results with those obtained in different and more heterogeneous populations, for example, from the United States, where most transplantations are from living donors.
In conclusion, we confirmed that the effect of IS protocols on long‑term outcomes varies depending on patient subpopulations. Our results indicated that AZA was superior to MPA as an adjunct to CNI‑based IS in the ORT group and to TAC‑based IS in the ITT group. Therefore, we suggest reconsidering the use of AZA in IS protocols, especially in the context of lowering therapy costs. Moreover, considering our findings and the increasing mortality due to other causes than graft rejection, we postulate that treatment recommendations should be individualized and posttransplant care, provided mainly by internists, should be carefully structured to improve the long‑term outcomes of renal transplantation.
- Schweitzer EJ, Matas AJ, Gillingham KJ, et al. Causes of renal allograft loss. Progress in the 1980s, challenges for the 1990s. Ann Surg. 1991; 214: 679‑688. | Crossref
- Ojo AO, Hanson JA, Wolfe RA, et al. Long‑term survival in renal transplant recipients with graft function. Kidney Int. 2000; 57: 307‑313. | Crossref
- Meier‑Kriesche HU, Schold JD, Srinivas TR, Kaplan B. Lack of improvement in renal allograft survival despite a marked decrease in acute rejection rates over the most recent era. Am J Transplant. 2004; 4: 378‑383. | Crossref
- Wang JH, Skeans MA, Israni AK. Current status of kidney transplant outcomes: dying to survive. Adv Chronic Kidney Dis. 2016; 23: 281‑286. | Crossref
- Hariharan S, Johnson CP, Bresnahan BA, et al. Improved graft survival after renal transplantation in the United States, 1988‑96. N Engl J Med. 2000; 342: 605‑612. | Crossref
SUPPLEMENTARY MATERIAL
ARTICLE INFORMATION