Changes in high-density lipoprotein cholesterol (HDL-C) level and the ratio of triglycerides to HDL-C during the first year of type 1 diabetes
Key words: high-density lipoprotein cholesterol, intensive insulin therapy, lipid profile, ratio of triglycerides to high-density lipoprotein cholesterol, type 1 diabetes


 CC BY-NC-SA 4.0
Changes in high-density lipoprotein cholesterol (HDL-C) level and the ratio of triglycerides to HDL-C during the first year of type 1 diabetes
Introduction: Patients in an insulin‑deficient state show reduced high‑density lipoprotein cholesterol (HDL‑C) levels. Insulin treatment affects lipid metabolism in this population. There have been no prospective studies evaluating changes in lipid profile after the diagnosis of type 1 diabetes (T1D).
Objectives: We investigated the effect of subcutaneous insulin therapy initiation on quantitative changes in HDL‑C levels and other components of lipid profile in patients with newly diagnosed T1D.
Patients and methods: A total of 127 patients with newly diagnosed T1D aged 28 years (interquartile range, 23–34 years) were enrolled in the InLipoDiab1 study. The lipid profile was assessed before the first injection of insulin (baseline) and after 3 and 12 months of insulin therapy. The daily dose of insulin (DDI) was defined as the requirement for insulin per kilogram body weight per day. The DDI was calculated at hospital discharge and during visits in an outpatient clinic at 3 and 12 months.
Results: We observed a persistent increase in HDL‑C levels at 3 and 12 months versus baseline (P <0.001) in men and women. Moreover, a reduction was observed in triglyceride levels (P <0.001) and the ratio of triglycerides to HDL‑C (P <0.001) in men and women. In contrast, a decrease was observed in low‑density lipoprotein cholesterol and non‑HDL‑C levels (P <0.001), but only in men.
Conclusions: Subcutaneous insulin therapy reverses the impaired phenotype of lipoproteins during the first year of treatment. Changes in lipoprotein levels in newly diagnosed T1D differ depending on sex.
Introduction
Type 1 diabetes (T1D) is characterized by an absolute deficiency of insulin, and the treatment of choice is the substitution of exogenous insulin.1 The optimal treatment model is an intensive insulin therapy attempting to reflect the physiologic secretion of insulin.2 Chronic neurovascular complications still remain the most important clinical issue in T1D, with lipid disorders as one of their risk factors. Thus, it seems important to pay attention to lipid abnormalities in T1D in order to improve the prognosis and life expectancy in this patient group.
Lipid disorders in newly diagnosed T1D arise from insulin deficiency, leading to increased lipolysis and metabolic decompensation. Patients in an insulin‑deficient state show reduced high‑density lipoprotein cholesterol (HDL‑C) and increased triglyceride (TG) levels. The beneficial effect of subcutaneous insulin therapy on the lipid profile, including an increase in HDL‑C levels, has been shown previously.3-5 The pathophysiology of lipid abnormalities is not fully explained, but hyperinsulinemia resulting from the subcutaneous route of insulin administration is likely to be involved. Thus, patients with T1D are characterized by a significantly higher HDL‑C level than healthy population.6 Generally, HDL‑C is assumed to have a beneficial impact, especially its antiatherosclerotic properties.7 However, it is still unknown whether an increase in HDL‑C levels is associated with a favorable prognosis in patients with T1D. Moreover, an association between extremely high HDL‑C levels and a higher risk of macroangiopathy in this group has been reported.8 Finally, life expectancy is still shorter in patients with T1D than in their healthy counterparts,9,10 and the main reason for premature death in this population is cardiovascular disease.11
Intensive insulin therapy is the treatment of choice because it has been proved to protect against chronic complications.12 In this method, which aims to mimic physiology, 2 types of insulin are used: neutral protamine Hagedorn (NPH) insulin or long‑acting insulin analogues (so‑called basal insulin) and rapid‑acting analogues (used before main meals) with insulin pen devices (or rapid‑acting analogues when a personal insulin pump is used). It is necessary to adjust the dosage of insulin for optimal metabolic control and actual requirement already at the onset of the disease.13-15 There have been no prospective studies evaluating how initiation of insulin therapy at the onset of T1D affects the lipoprotein parameters.
This study aimed to investigate the effect of subcutaneous insulin therapy initiation on quantitative changes in HDL‑C levels and other components of the lipid profile in patients with newly diagnosed T1D during a 1‑year follow‑up.
Patients and methods
Study design
The InLipoDiab1 (Insulin Therapy and Lipoproteins Profile in Type 1 Diabetes Study) was a prospective, observational study with the following inclusion criteria: age between 18 and 35 years, newly diagnosed T1D without comorbidities and medication use for other causes, and initiation of insulin treatment. Autoimmunology was confirmed by the presence of specific autoantibodies: islet cell antibodies, glutamic acid decarboxylase antibodies, and tyrosine phosphatase antibodies. The study is registered at ClinicalTrials.gov (NCT02306005). All patients gave written informed consent to participate in the study. The study was conducted in accordance with the Declaration of Helsinki and approved by the local ethics committee (reference no.: 688/15).
All patients were hospitalized for 5 days on average in the Department of Internal Medicine and Diabetology, Poznan University of Medical Science, Poznań, Poland, due to newly diagnosed T1D. They were treated with intensive insulin therapy using insulin pens from the moment of diagnosis and participated in the same educational program conducted by a specially trained nurse educator, diabetologist, psychologist, and dietician. Intensive insulin therapy is defined as a treatment method requiring multiple daily insulin injections with adapting rapid‑acting insulin doses before main meals, with consideration of glucose levels, desired carbohydrate intake, and planned physical activity. All participants declared to have 3 main meals and 1 or 2 snacks per day, and they had injections of rapid‑acting analogues before each meal and 1 or 2 injections of basal insulin per day (NPH or long‑acting analogues). After obtaining partial clinical remission, there was basically no need to provide basal insulin, and the rapid‑acting insulin analogue converter was reduced to the amount of carbohydrates consumed.16,17
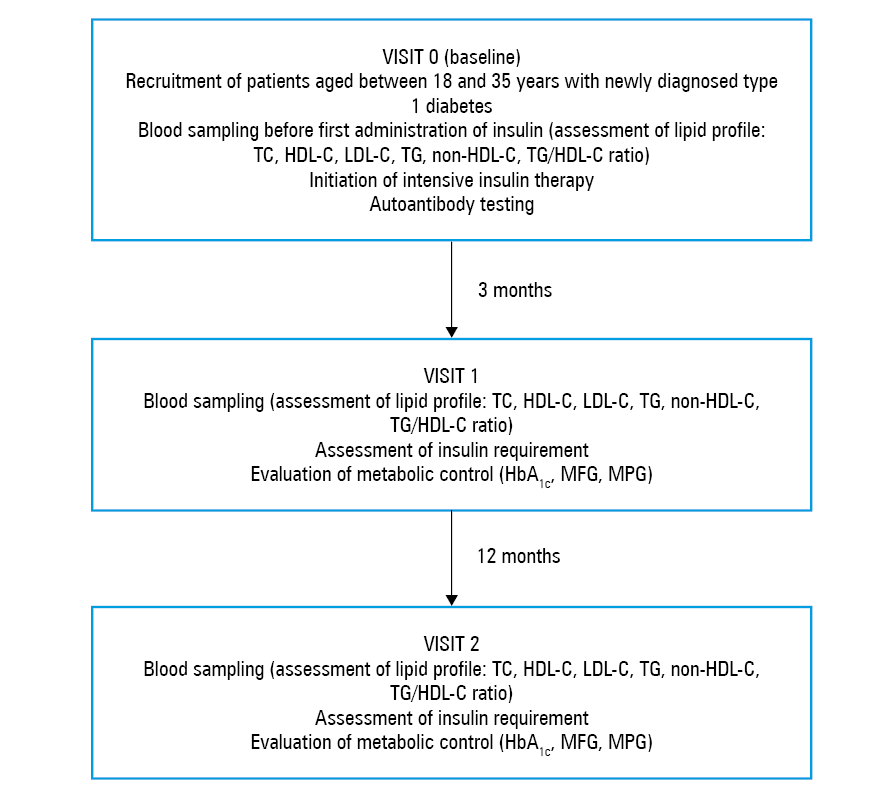
The lipid profile was evaluated at 3 time points: at diagnosis, before insulin administration (baseline; visit 0), and after 3 months (visit 1) and 1 year of insulin treatment (visit 2). The study design is presented in Figure 1. For a reliable assessment of the effects of insulin therapy on lipoprotein levels, it was extremely important to obtain the first blood samples at the time of diagnosis, before the first doses of insulin. In a special questionnaire, patients supplied information about personal data and insulin dosing.
Laboratory tests
Serum HDL‑C, total cholesterol (TC), and TG levels were measured with a Cobas 6000 biochemistry analyzer (Roche Diagnostics, Basel, Switzerland) using the enzymatic colorimetric method. Low‑density lipoprotein cholesterol (LDL‑C) levels were calculated by the Friedewald formula.18 The ratio of TG to HDL‑C (TG/HDL‑C ratio) was calculated from the standard lipid profile by dividing TG by HDL‑C, using values in units of mg/dl. The non‑HDL‑C level was calculated by the following formula: non‑HDL‑C = TC – HDL‑C. Glycated hemoglobin levels were assessed by a turbidimetric inhibition immunoassay (Cobas 6000 analyzer, Roche Diagnostics). C‑peptide levels were measured by an electrochemiluminescence immunoassay (Cobas 6000 analyzer, Roche Diagnostics). Glycated hemoglobin levels were measured in whole blood, whereas all other measurements were performed in serum. Mean fasting and postprandial glucose levels were measured using capillary plasma with a glucometer. Mean postprandial glucose levels were measured 3 times, 2 hours after major meals during the day. Mean fasting and postprandial glucose at discharge from the hospital was expressed as a mean of the measurements from all days of hospital stay, and at follow‑up, as a mean of the measurements on several days before visiting an outpatient clinic.
Insulin requirement
The daily dose of insulin (DDI) was defined as the requirement for insulin per kilogram of body weight per day. It was calculated as the amount of short- and long‑acting insulin (basal + bolus) at discharge and at follow‑up visits in the outpatient clinic from the doses of insulin noted by patients in their blood glucose self‑monitoring logs 1 day before the visit.
Statistical analysis
Statistical analysis was performed using the Statistica PL software (version 13, STATSOFT, Tulsa, Oklahoma, United States). The normality of data distribution was tested using the Kolmogorov–Smirnov test with Lilliefors correction. The parameters were not normally distributed. All data were expressed as median values with interquartile ranges and as number (percentage) of patients. Data at onset and at 3 and 12 months of follow‑up were compared by the analysis of variance (Friedman test). The Wilcoxon test was used for comparison of changes in HDL‑C levels between 3 and 12 months. Patients were divided according to sex. Statistical significance was established at a P value of less than 0.05.
Results
Patient characteristics
The study population consisted of 127 adults with newly diagnosed T1D (86 men, 41 women). The median age of the study group was 28 years (interquartile range, 24–33 years). Diabetic ketoacidosis at diagnosis, identified according to the recommendations of Diabetes Poland,19 was present in 19% of patients. In 82% of patients, a preserved insulin reserve (C‑peptide concentration >0.5 ng/ml) after 12 months of therapy was noted, indicating prolonged partial remission.
Changes in lipoprotein levels
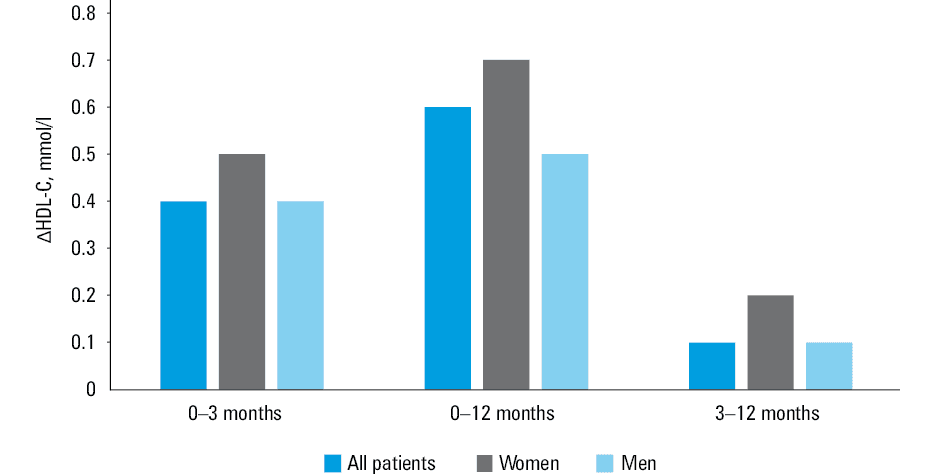
Changes in lipoprotein levels during the 12‑month follow‑up are presented in Table 1. During the first year of insulin therapy, a significant increase in HDL‑C levels was observed at 3 and 12 months, much exceeding the accepted norms for people with diabetes. In addition, the increase in HDL‑C levels, which occurred at 3 months, was continuous (3 vs 12 months; P = 0.004). However, considering the analysis by sex, this observation was noted only in men (3 vs 12 months; P = 0.02). The increase in HDL‑C concentrations (ΔHDL‑C) between control points is shown in Figure 2. Regarding other lipid parameters, there was a significant decrease in TG levels and TG/HDL‑C ratio during the first year of insulin therapy. There was also a decrease in LDL‑C and non‑HDL‑C concentrations in the whole group, but the analysis by sex showed a reduction only in men. A significant increase in TC levels was observed only in women.
Parameter | All patients, n = 127 | P value | Women, n = 41 | P value | Men, n = 86 | P value | ||||||
Data are presented as median and interquartile range.
A P value of <0.05 was considered significant. The analysis of variance (Friedman test) was used.
Abbreviations: DDI, daily dose of insulin; others, see Figure 1 | ||||||||||||
Baseline | 3 months | 12 months | Baseline | 3 months | 12 months | Baseline | 3 months | 12 months | ||||
Age, y | 28 (24–33) | – | – | – | 26 (22–30) | – | – | – | – | 30 (27–33) | – | – |
Body mass, kg | 70.2 (60.3–78.3) | 70.6 (60.4–80.0) | 71.3 (62.5–79.5) | <0.001 | 53.9 (50.0–67.8) | 57.4 (51.0–67.0) | 58.7 (53.0–70.3) | <0.001 | 74.4 (66.0–80.4) | 76.3 (68.9–82.7) | 76.8 (68.4–83.2) | <0.001 |
HbA1c, % | 11.3 (9.7–12.5) | 6.3 (5.8–7.2) | 6.6 (6.1–7.4) | <0.001 | 10.7 (9.4–12.5) | 6.4 (6.0–7.2) | 6.8 (6.1–7.3) | <0.001 | 11.5 (10.0–12.3) | 6.3 (5.8–7.1) | 6.5 (6.0–7.6) | <0.001 |
DDI, U/kg/d | 0.14 (0.10–0.27) | 0.14 (0.08–0.26) | 0.32 (0.21–0.47) | <0.001 | 0.12 (0.11–0.24) | 0.14 (0.08–0.23) | 0.32 (0.22–0.43) | <0.001 | 0.16 (0.09–0.27) | 0.14 (0.07–0.26) | 0.32 (0.18–0.49) | <0.001 |
MFG, mmol/l | 7.7 (7.0–9.3) | 6.9 (6.4–8.1) | 6.9 (6.2–7.9) | 0.03 | 7.5 (6.5–8.4) | 7.2 (6.4–8.6) | 7.0 (6.7–8.3) | 0.51 | 7.9 (7.2–9.4) | 6.8 (6.3–7.8) | 6.9 (6.1–7.8) | 0.009 |
MFG, mg/dl | 138.5 (125.1–166.5) | 124 (115–146.3) | 125 (111.3–141.3) | 0.03 | 135.5 (116.3–151.3) | 129.3 (115–154.5) | 126.5 (120–150) | 0.51 | 141.7 (130–169) | 123 (113.9–140) | 125 (110–140) | 0.009 |
MPG, mmol/l | 9.5 (8.5–10.6) | 6.7 (6.2–7.8) | 7.2 (6.4–8.3) | <0.001 | 9.4 (8.5–10.6) | 7.2 (6.2–8.3) | 7.4 (6.7–8.8) | 0.002 | 9.6 (8.6–10.4) | 6.7 (6.2–7.6) | 7.0 (6.1–8.2) | <0.001 |
MPG, mg/dl | 170.4 (153.1–189.9) | 120.7 (111–140) | 129.1 (115–150) | <0.001 | 169 (153–191.6) | 129.1 (111.5–150) | 134 (120–159) | 0.002 | 173.2 (154.8–187.3) | 119.9 (111–135.9) | 126 (110.6–148) | <0.001 |
HDL‑C, mmol/l | 1.2 (0.9–1.4) | 1.6 (1.4–1.9) | 1.7 (1.5–2.1) | <0.001 | 1.3 (1.1–1.5) | 1.7 (1.5–2.1) | 2.1 (1.6–2.3) | <0.001 | 1.2 (0.9–1.4) | 1.6 (1.4–1.8) | 1.7 (1.4–1.9) | <0.001 |
HDL‑C, mg/dl | 46 (36–55) | 63 (53–74) | 67 (57–82) | <0.001 | 48.5 (41–58) | 67 (56–80) | 79.5 (63–90) | <0.001 | 45 (36–54) | 62 (52.2–71) | 64.5 (55–75) | <0.001 |
LDL‑C, mmol/l | 2.5 (2.0–3.1) | 2.5 (1.9–2.9) | 2.3 (1.8–2.9) | <0.001 | 2.1 (1.9–2.6) | 2.2 (1.7–2.6) | 1.9 (1.6–2.5) | 0.36 | 2.8 (2.3–3.4) | 2.5 (1.9–3.0) | 2.5 (1.8–3.0) | <0.001 |
LDL‑C, mg/dl | 97 (75.4–120) | 94.6 (73.3–110.6) | 89 (67.7–112) | <0.001 | 82.5 (72.7–99.8) | 84 (67–101) | 72 (63–96) | 0.36 | 108.4 (89.4–131) | 97 (73.8–116.1) | 96 (69.8–114.6) | <0.001 |
TG, mmol/l | 1.2 (0.9–1.6) | 0.9 (0.6–1.2) | 0.8 (0.6–1.1) | <0.001 | 1.0 (0.8–1.4) | 0.6 (0.5–1.1) | 0.7 (0.5–1.0) | <0.001 | 1.2 (0.9–1.9) | 0.9 (0.6–1.2) | 0.9 (0.7–1.2) | <0.001 |
TG, mg/dl | 103 (77–140) | 76 (53–107) | 72 (53–99) | <0.001 | 86 (74.5–122) | 55 (44–99) | 62.5 (46–92) | <0.001 | 107 (80–168) | 82 (57–110) | 79 (60–103) | <0.001 |
TC, mmol/l | 4.3 (3.8–5.1) | 4.6 (4.0–5.1) | 4.6 (4.0–5.1) | 0.61 | 4.1 (3.7–4.5) | 4.3 (3.9–4.9) | 4.5 (4.1–5.0) | 0.03 | 4.6 (3.9–5.7) | 4.6 (4.0–5.2) | 4.6 (4.0–5.1) | 0.85 |
TC, mg/dl | 168 (146–197) | 176 (154–196) | 177.5 (155.5–197) | 0.61 | 158 (142–175) | 166 (151–191) | 174 (158–195) | 0.03 | 179 (150–219) | 178 (154–201) | 178.5 (155–198) | 0.85 |
Non‑HDL‑C, mmol/l | 3.2 (2.5–3.9) | 2.8 (2.3–3.5) | 2.7 (2.1–3.5) | <0.001 | 2.7 (2.4–3.1) | 2.7 (2.3–3.0) | 2.3 (2.0–3.0) | 0.23 | 3.4 (2.7–4.5) | 3.0 (2.4–3.5) | 2.8 (2.2–3.5) | <0.001 |
Non‑HDL‑C, mg/dl | 122 (98–152) | 108 (89–134) | 105.5 (81–134) | <0.001 | 104 (91–119) | 103 (87–114) | 88 (77–115) | 0.23 | 133 (105–173) | 114.5 (91–136) | 110 (85–136) | <0.001 |
TG/HDL‑C ratio | 2.2 (1.6–3.9) | 1.1 (0.8–1.8) | 1.1 (0.8–1.6) | <0.001 | 1.8 (1.6–2.4) | 0.9 (0.6–1.5) | 0.8 (0.6–1.3) | <0.001 | 2.7 (1.7–4.5) | 1.4 (0.9–2.0) | 1.2 (0.9–1.7) | <0.001 |
Discussion
Our prospective study revealed significant changes in lipid profile during the 12 months of exogenous insulin therapy. Interestingly, the increase in HDL‑C levels occurred after 3 months of insulin therapy and was maintained at the same level after 12 months in women. However, in the whole group and in men, the HDL‑C level continued to increase until the 12 month of treatment. To our knowledge, this is a novel finding and the first study with such a long follow‑up. We can hypothesize that treatment with exogenous insulin changes the lipid profile in a highly favorable way.
We also observed a similar pattern of significant changes in serum TG concentrations in all patients: the first changes after 3 months and the concentrations maintained at the same level until 12 months. It is well known that insulin deficiency promotes an increase in TG levels. Surprisingly, in our patients, the median TG level remained normal at the time of diagnosis and during the follow‑up, and despite that, we observed a significant decrease in serum TG levels.
There are some literature data on the lipid profile in T1D. In a nonprospective study by Guy et al,4 lipid parameters in young patients with a brief history of T1D (several years) were evaluated in a single measurement. The authors compared patients with T1D with poor and good metabolic control and healthy individuals. They showed that both groups of patients, with good and poor metabolic control (with lower and higher insulin requirement), were characterized by higher levels of HDL‑C compared with the control group. On the other hand, only the group with good metabolic control and lower insulin requirement had lower TG levels and TG/HDL‑C ratio than controls. Moreover, the authors observed an increase in TC, LDL‑C, and non‑HDL‑C concentrations in patients with a higher daily insulin dose, as compared with controls.
Wilson et al3 revealed that intensification of insulin delivery increased HDL‑C levels after 3 and 6 months of treatment, without significant changes in the levels of other lipoproteins. However, this study was conducted on a relatively small group including young patients with T1D and had a short follow‑up. The authors found an increase in HDL‑C levels after 3 months of treatment, which is in line with our previous observation.20
Sinha et al5 compared lipid parameters in patients with newly diagnosed T1D and in patients with type 2 diabetes (T2D) after an unsuccessful oral hypoglycemic treatment. Both groups of patients received similar insulin doses, but improvement in all parameters of the lipid profile was seen only in patients with T1D. However, the study had only a 6‑month follow‑up and included a small number of patients, especially those with newly diagnosed T1D (only 9 patients).
Finally, Fukui et al21 showed that patients with T1D and T2D treated with insulin presented higher HDL‑C levels in comparison with patients with T2D not receiving insulin. However, the highest HDL‑C concentration was noted in patients with T1D. These patients also had a higher total dose of injected insulin compared with patients with T2D.
All of the above studies were limited by a short follow‑up, small number of patients with T1D, and lack of prospective design. In order to describe and confirm the beneficial effect of exogenous insulin on HDL‑C levels, a long follow‑up is needed.
Nonpharmacological methods that result in elevation of HDL‑C levels include smoking cessation, physical activity, and diet modification. It has been shown that smokers tend to have lower HDL‑C levels than nonsmokers.22 Moreover, smoking cessation contributes to increased HDL‑C levels.23 A dietary intervention improves the lipid profile.24 There are numerous dietary components with proven effectiveness in raising the HDL‑C level.25,26 It can also be increased naturally with regular physical activity.27 Therefore, to assess changes in HDL‑C levels, it is important to consider the natural factors that affect them. Our patients were on a balanced diet in accordance with the recommendation of Diabetes Poland. Some of them modified their lifestyle by quitting smoking (12% of patients) and starting physical activity (24% of patients). However, because physical activity and smoking cessation has been shown to increase HDL‑C levels by only 5% to 10%,28 respectively, we assumed that the effect of these steps on HDL‑C levels was marginal.
One of the actions of insulin is to decrease the very‑low‑density lipoprotein (VLDL) level. Insulin deficiency increases VLDL levels and promotes LDL‑C production. Insulin reduces VLDL production by lowering the levels of circulating free fatty acids, which are substrates for VLDL, and by a direct inhibitory effect on VLDL production in hepatocytes. As an activator of lipoprotein lipase, insulin leads to a reduction in plasma TG levels. In our study group, we observed a significant decrease in LDL‑C levels during the 12‑month follow‑up.
Our study also showed that exogenous insulin treatment affects the lipid profile by reducing the value of 2 clinically relevant parameters: TG/HDL‑C ratio and non‑HDL‑C levels. An increase in these parameters is associated with a higher risk of vascular complications in patients with T1D.29,30 The TG/HDL‑C ratio and non‑HDL‑C levels have been shown to be associated with cardiovascular disease, insulin resistance, and T2D. Non‑HDL‑C is one of the criteria for metabolic control of T1D. However, in people with T1D, caution should be exercised in interpreting the results of the non‑HDL‑C level, because its value depends on the concentration of HDL‑C. In this case, elevated HDL‑C levels distort non‑HDL‑C levels, leading to misinterpretation of the results. There have been no prospective studies assessing the impact of the TG/HDL‑C ratio and non‑HDL‑C on cardiovascular disease and survival in patients with T1D. Therefore, further prospective studies are needed to assess whether a decrease in the TG/HDL‑C ratio and non‑HDL‑C levels improves the prognosis of patients with T1D. If an increase in HDL‑C levels does not improve the prognosis of this population, it may suggest that its qualitative composition or function is altered. Thus, the recommended treatment goals for HDL‑C levels, TG/HDL‑C ratio, and non‑HDL‑C levels should be changed for people with T1D.
Our study has several limitations. First, the number of patients was small. However, our long follow‑up is unique in the evaluation of a lipid profile and exogenous insulin treatment. Second, we evaluated only the lipid profile components, excluding HDL‑C subfractions. However, only such an analysis is generally performed in the clinical setting. Future study with the analysis of HDL‑C subfractions in this group is planned. Third, we did not assess the effect of lifestyle on lipid parameters. Our results provide the basis for future research assessing whether the changes in HDL‑C levels are stable and beneficial for patient prognosis.
In conclusion, subcutaneous insulin therapy reverses the impaired phenotype of lipoproteins during the first year of treatment. Changes in lipoprotein levels in newly diagnosed T1D differ depending on sex.
- Malik FS, Taplin CE. Insulin therapy in children and adolescents with type 1 diabetes. Paediatr Drugs. 2014; 16: 141‑150. | Crossref
- Sämann A, Mühlhauser I, Bender R, et al. Glycaemic control and severe hypoglycaemia following training in flexible, intensive insulin therapy to enable dietary freedom in people with type 1 diabetes: a prospective implementation study. Diabetologia. 2005; 48: 1965‑1970. | Crossref
- Wilson DP, Fesmire JD, Endres RK, Blackett PR. Increased levels of HDL‑cholesterol and apolipoprotein A‑I after intensified insulin therapy for diabetes. South Med J. 1985; 78: 636‑638. | Crossref
- Guy J, Ogden L, Wadwa RP, et al. Lipid and lipoprotein profiles in youth with and without type 1 diabetes: the SEARCH for diabetes in youth case‑control study. Diabetes Care. 2009; 32: 416‑420. | Crossref
- Sinha A, Formica C, Tsalamandris C, et al. Effects of insulin on body composition in patients with insulin‑dependent and non‑insulin‑dependent diabetes. Diabet Med. 1996; 13: 40‑46. | Crossref
ARTICLE INFORMATION