Paper-based training diaries for monitoring of performance progress due to long-term physical activity
Key words: bicycle stress test, performance, physical activity, sports, training diary


 CC BY-NC-SA 4.0
Paper-based training diaries for monitoring of performance progress due to long-term physical activity
Introduction: Training diaries are a common tool for training monitoring; however, their correlation with an effective performance gain is unclear.
Objectives: The aim of this prospective study was to investigate whether monitoring of training by paper‑based training diaries reflects the training progress measured by a bicycle stress test in hobby athletes.
Patients and methods: Out of 109 hobby athletes who were instructed to work out for 8 months with a calculated training pulse, 98 participants completed the study. Training workload (intensity and time) was recorded with special training diaries. To assess the objective performance gain or change, the bicycle stress test was performed at baseline and at the end of the study. Surrogate parameters associated with increased physical activity were also recorded.
Results: Participants who had a performance gain of at least 3% (mean gain of about 12%) in the bicycle stress test worked out between 547 and 576 min/mo with moderate intensity, and between 14 and 187 min/mo with high intensity. Neither moderate- nor high‑intensity training correlated with the performance gain.
Conclusions: Paper‑based training diaries might serve as an additional tool in the monitoring of training progress. However, because of the discrepancy between reported training loads and objectively measured training progress, they are not suitable to replace a standard bicycle stress test for an exact determination of performance gain in hobby athletes. New devices, such as fitness trackers or watches, may present better alternatives in the future.
What's new?
The results show that (bicycle) stress testing is essential for the determination of the effectiveness of training and paper‑based training diaries do not impartially reflect the success of training.
Introduction
Because of its beneficial effect on cardiovascular risk factors, physical activity is the mainstay of primary, secondary, and tertiary prevention of cardiovascular disease.1,2 Cardiovascular risk factors lead to an increased inflammatory status, thus promoting vascular calcification. Regular training has a positive impact by ameliorating the lipid and glucose profiles, reducing blood pressure, and facilitating weight loss, which leads to a decrease in inflammation.3,4 Furthermore, it increases the thrombolytic activity and inhibits platelet aggregation.5
In contrast to medical therapy, it is often difficult to ensure patient adherence to physical activity. However, adherence might be increased by the use of training diaries.6 Furthermore, physical activity as therapy is much more difficult to “dose.” The European Society of Cardiology recommends a minimum of 75 min/wk of high- or 150 min/wk of moderate‑intensity training in healthy individuals. Similarly, the American Diabetes Association recommends 150 minutes or more of moderate- to high‑intensity activity per week over at least 3 days per week, with no more than 2 consecutive days without activity.7
Modern patient care, particularly of patients with cardiovascular risk factors, cardiovascular disease, or both, largely depends on motivating patients to be physically active and then following their activity status. Training diaries are a cheap, simple, and common tool for monitoring the training effort. However, there are insufficient data to show whether this method leads to an improvement in performance. Therefore, the aim of this prospective study was to investigate whether the monitoring of training by paper‑based diaries reflects the training progress measured by a bicycle stress test in hobby athletes.
Patients and methods
Study population
This study was a post hoc retrospective analysis of prospectively collected data. A total of 109 participants were recruited. The inclusion criteria were as follows: age of 30–65 years; physical ability to undergo a bicycle stress test and endurance training; as well as the presence of at least 1 of the following classic cardiovascular risk factors: overweight or obesity (body mass index [BMI], >25.0 kg/m2), hypertension (systolic blood pressure >140 mm Hg and/or diastolic blood pressure >85 mm Hg at rest or the use of antihypertensive medication), hyperlipidemia or dyslipidemia (history of statin therapy), diabetes mellitus (hemoglobin A1c >6.5% or the use of antidiabetic medication), current smoking, known chronic heart disease (history of myocardial infarction, percutaneous coronary intervention, coronary artery bypass grafting, stroke), and a positive family history for myocardial infarction, cardiovascular disease, or stroke (in a mother, father, or both). Exclusion criteria were a current infectious or oncologic disease (increased inflammatory parameters at baseline or in history). Of the 109 participants, 11 did not complete the study for different reasons, resulting in the final study sample of 98 subjects.
The study was conducted in adherence with the Declaration of Helsinki and its later amendments. The protocol was approved by the ethics committee of the Medical University of Vienna, Austria (No., 1830/2013). Written informed consent was obtained from all participants before inclusion to the study. The trial is registered at ClinicalTrials.gov (NCT02097199).
Measurement of anthropometric data and laboratory analysis
Medical history taking and physical examination were performed at baseline. Anthropometric data were collected, including height, weight, as well as body water, muscle mass, and body fat measured with a Beurer BG 16 diagnostic scale (Beurer GmbH, Ulm, Germany). All participants were requested not to change their nutritional habits. Blood samples were drawn in a nonfasting state at baseline and at 2, 4, 6, and 8 months. However, only the baseline and final values were presented in this paper. All blood samples were taken after 10 minutes of lying from a cubital vein with a tube adapter system and analyzed immediately after drawing.
Bicycle stress test
During the first visit, participants underwent a bicycle stress test to define an individual performance level objectively and to calculate an individual training pulse or target heart rate (using the Karvonen formula with an intensity level of 65%–75% for moderate‑intensity and 76%–93% for high‑intensity training).8 All bicycle stress tests were performed with the same system (Ergometer eBike comfort, GE Medical Systems, Freiburg, Germany). The protocol was started with a resistance of 25 W, with an increase in resistance by 25 W every 2 minutes (according to the protocol of the Austrian Society of Cardiology, which is in line with the guidelines of the European Society of Cardiology). Systolic and diastolic blood pressures as well as heart rate were measured every 2 minutes, while participants were under continuous electrocardiogram monitoring. They were instructed to perform 50 to 70 cycles/min until exhaustion. The target performance was calculated according to the DuBois formula: body surface (m2) = 0.007184 × height (cm)0.725 × weight (kg)0.425.9 An individual target performance of 100% represents the performance level of an untrained collective. Therefore, we first classified the participants into initially unathletic and athletic ones.
The decision on the type of activity or sports was at the discretion of the participants. However, they were asked to do at least 75 min/wk of high‑intensity exercise or 150 min/wk of moderate‑intensity exercise (or a mixture of both; strength training was also allowed but not mandatory) within the previously calculated training pulse. The second bicycle stress test was performed after 8 months of training at the end of the study for an exact and objective determination of the performance change or gain. Depending on the initial performance level and the performance gain over 8 months of training according to the bicycle stress test results, the study population was divided into 4 groups: group 1 (n = 9), initially unathletic participants (initial performance <100%; performance gain ≤2.9%); group 2 (n = 32), initially unathletic participants (initial performance <100%; performance gain ≥3%); group 3 (n = 18), initially athletic participants (initial performance ≥100%; performance gain ≤2.9%); and group 4 (n = 39), initially athletic participants (initial performance ≥100%; performance gain ≥3%).
Training diaries
Participants were given paper‑based training diaries to record their training effort during the study. They were asked to record the duration (in minutes) of moderate and intensive physical activity of each training session. Moderate‑intensity activity was defined as quick walking, Nordic walking, slow cycling or swimming, (inline) skating, or hiking. High‑intensity activity was defined as playing soccer, tennis, or basketball, quick cycling or swimming, paddling, or jogging/running. Every 2 months, participants were given a new training diary.
Statistical analysis
Statistical analysis was performed using SPSS 20.0 (SPSS 20.0: IBM, Armonk, New York, United States) and Excel 2010 (Microsoft Corporation, Redmond, Washington, United States). Continuous and normally distributed data were presented as mean (SD), while data without normal distribution were given as median (first and third quartiles). The Spearman correlation coefficient was used for assessing the correlation between the performance gain and workload. A linear regression analysis was performed to investigate training‑specific data as potential predictors of the performance gain. To analyze the differences in parameters between baseline and the end of the study, a paired‑sample t test was used. All tests were done in accordance with 2‑sided testing, and P values of 0.05 or less were considered significant.
Results
Of the 98 participants, 27 did not achieve a performance gain of more than 2.9% (groups 1 and 3). The remaining participants (groups 2 and 4) showed a performance gain of at least 3%. The baseline anthropometric and laboratory data as well as the cardiovascular risk profile of the 4 groups are shown in Table 1. The most frequent risk factors were overweight and a positive family history. The prevalence of current smokers was much higher in unathletic participants than in athletic ones. There were no significant differences in terms of age and laboratory parameters.
Parameter | Group 1, unathletic, gain ≤2.9% (n = 9) | Group 2, unathletic, gain ≥3% (n = 32) | Group 3, athletic, gain ≤2.9% (n = 18) | Group 4, athletic, gain ≥3% (n = 39) | |
Abbreviations: BMI, body mass index; GGT, γ-glutamyltransferase | |||||
Female sex, % | 44.4 | 53.1 | 61.1 | 71.8 | |
Age, y, mean (SD) | 50.3 (6.1) | 48.6 (7.9) | 50.4 (6.5) | 49.1 (6.1) | |
Weekly alcohol intake, units/wk, median (Q1; Q3) | 0 (0; 2) | 2 (0; 4) | 2 (0; 7) | 2 (1; 4) | |
Smoking, % | Never | 22.2 | 31.1 | 27.8 | 48.7 |
Former | 22.2 | 43.8 | 55.6 | 41.0 | |
Current | 55.6 | 25.0 | 16.7 | 10.3 | |
Type 2 diabetes, % | 11.1 | 3.1 | 5.6 | 0 | |
Hypertension, % | 33.3 | 43.8 | 33.3 | 23.1 | |
Dyslipidemia, % | 33.3 | 25.0 | 38.9 | 28.2 | |
Weight, % | BMI, 25.0–29.9 kg/m2 | 44.4 | 34.4 | 50.0 | 50.0 |
BMI ≥30.0 kg/m2 | 22.2 | 43.4 | 16.7 | 13.3 | |
Positive family history, % | 66.7 | 43.8 | 50.0 | 38.5 | |
Red blood cells, T/l, mean (SD) | 4.6 (0.4) | 4.8 (0.5) | 4.6 (0.4) | 4.7 (0.4) | |
Hemoglobin, g/dl, mean (SD) | 13.3 (1.5) | 14.2 (1.5) | 13.8 (1.0) | 14.2 (1.2) | |
Platelets, G/l, mean (SD) | 257 (53) | 239 (61) | 256 (59) | 246 (41) | |
Leukocytes, G/l, mean (SD) | 7.5 (1.8) | 6.7 (1.8) | 6.5 (2.0) | 6.2 (1.2) | |
Creatinine, mg/dl, mean (SD) | 0.8 (0.1) | 0.8 (0.2) | 0.9 (0.2) | 0.9 (0.2) | |
Cholinesterase, kU/l, mean (SD) | 8.1 (1.3) | 8.4 (1.7) | 8.2 (1.7) | 8.1 (1.7) | |
GGT, U/l, median (Q1; Q3) | 18 (11; 43) | 23 (14; 37) | 19 (16; 24) | 21 (13; 34) | |
Triglycerides, mg/dl, median (Q1; Q3) | 135 (109; 184) | 124 (87; 175) | 88 (65; 130) | 109 (68; 151) | |
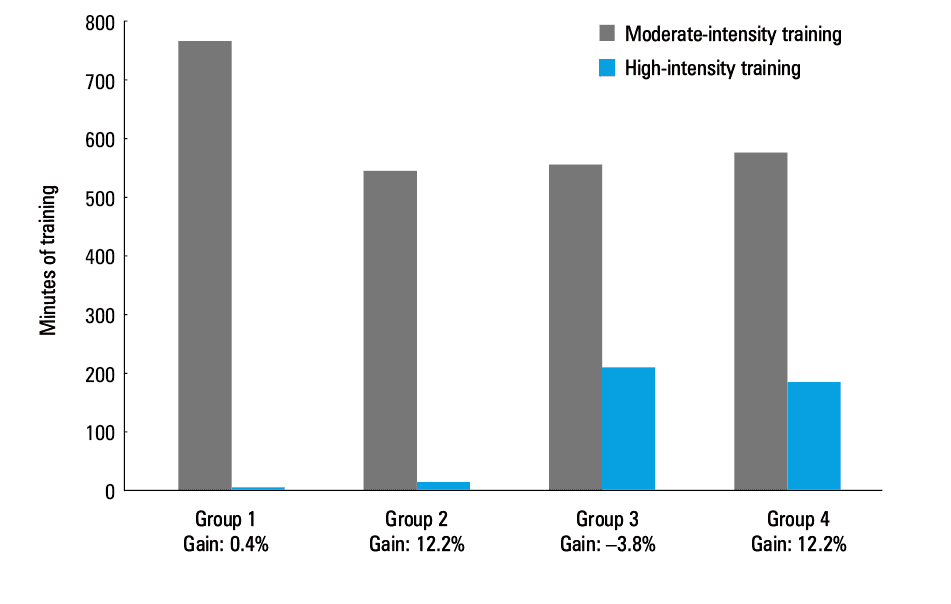
The self‑recorded duration (in minutes) of moderate- and high‑intensity training during the study according to the training diaries is shown in Table 2. The median number of minutes per month of moderate- and high‑intensity training in the study groups is shown in Figure 1. Groups 1 and 4 recorded the highest number of minutes for moderate‑intensity training (766 and 576 min/mo, respectively) followed by groups 3 and 2 (558 and 547 min/mo, respectively). However, the difference in the duration of moderate‑intensity training between groups 2, 3, and 4 was only marginal. The athletic groups 3 and 4 showed a higher median number of minutes per month for high‑intensity training (211 and 187 min/mo, respectively), as compared with the unathletic groups 1 and 2 (0 and 14 min/mo, respectively). None of the groups showed a training duration of more than 75 min/wk. The performance gain measured by the bicycle stress test is shown in Figure 1. There was no positive correlation of the performance gain with the total minutes of moderate- or high‑intensity training or the minutes per month of moderate- or high‑intensity training (group 2: total minutes of moderate training, P = 0.69; total minutes of intensive training, P = 0.16; minutes per month of moderate training, P = 0.69; minutes per month of intensive training, P = 0.16; group 4: total minutes of moderate training, P = 0.28; total minutes of intensive training, P = 0.05; minutes per month of moderate training, P = 0.28; minutes per month of intensive training, P = 0.05). However, the correlation of the performance gain and the total duration of intensive training as well as the monthly duration of intensive training nearly approached statistical significance in group 4. A linear regression analysis was performed to assess whether training‑specific data were predictors of the performance gain. Only a trend for a correlation between the performance gain and the minutes per month of intensive training was shown in group 4 (P = 0.05), with a regression coefficient of 0.01.
Duration of training | Group 1, unathletic, gain ≤2.9% (n = 9) | Group 2, unathletic, gain ≥3% (n = 32) | Group 3, athletic, gain ≤2.9% (n = 18) | Group 4, athletic, gain ≥3% (n = 39) | |
Data are given as median (Q1; Q3). | |||||
Moderate intensity, min | Month 1 + 2 | 1910 (676; 2540) | 949 (581; 1322) | 868 (492; 1466) | 1000 (671; 1449) |
Month 3 + 4 | 1087 (786; 2820) | 1085 (675; 1455) | 892 (540; 1823) | 1030 (446; 1560) | |
Month 5 + 6 | 1230 (345; 1819) | 1087 (675; 1740) | 1100 (614; 2191) | 1205 (730; 1628) | |
Month 7 + 8 | 1800 (810; 2710) | 888 (550; 1316) | 1283 (489; 2693) | 1208 (701; 1785) | |
Minutes (total) | 6130 (3710; 9860) | 4373 (3186; 5984) | 4465 (2618; 7155) | 4605 (2985; 5656) | |
Minutes/month | 766 (464; 1233) | 547 (398; 748) | 558 (327; 894) | 576 (373; 707) | |
High intensity, min | Month 1 + 2 | 0 (0; 53) | 83 (0; 430) | 369 (54; 638) | 377 (0; 829) |
Month 3 + 4 | 0 (0; 214) | 0 (0; 181) | 438 (208; 675) | 433 (0; 718) | |
Month 5 + 6 | 0 (0; 45) | 0 (0; 189) | 355 (150; 555) | 296 (0; 679) | |
Month 7 + 8 | 0 (0; 0) | 0 (0; 195) | 273 (131; 720) | 305 (0; 563) | |
Minutes (total) | 0 (0; 345) | 113 (0; 1218) | 1688 (715; 2461) | 374 (0; 673) | |
Minutes/month | 0 (0; 43) | 14 (0; 152) | 211 (89; 308) | 187 (0; 337) | |
Apart from the performance gain measured by the bicycle stress test, we also assessed surrogate anthropometric and laboratory parameters associated with increased physical activity as well as a P value for the change (Table 3). At baseline, the athletic groups 3 and 4 had lower BMI, body fat, and low‑density lipoprotein cholesterol (LDL‑C) levels but higher body water, body muscle mass, and high‑density lipoprotein cholesterol (HDL‑C) levels compared with the unathletic groups 1 and 2. In the groups that achieved a performance gain of 2.9% or lower (groups 1 and 3), we observed a nonsignificant change in surrogate parameters. In the groups that achieved a performance gain of at least 3% (groups 2 and 4), we revealed significant changes in body water and body fat. In group 2, changes in HDL‑C levels (P = 0.04) and diastolic blood pressure (P = 0.01) were also revealed.
Parameter | Group 1, unathletic, gain ≤2.9% (n = 9) | Group 2, unathletic, gain ≥3% (n = 32) | Group 3, athletic, gain ≤2.9% (n = 18) | Group 4, athletic, gain ≥3% (n = 39) | |
Data are presented as mean (SD).
a Performance was tested by the bicycle stress test.
Abbreviations: DPB, diastolic blood pressure; HDL‑C, high‑density lipoprotein cholesterol; LDL‑C, low‑density lipoprotein cholesterol; SBP, systolic blood pressure; others, see Table 1 | |||||
Performance, % | Baselinea | 87.4 (9.9) | 88.8 (7.1) | 122.0 (16.8) | 116.0 (15.9) |
End of studya | 87.0 (9.1) | 101.0 (10.0) | 118.2 (18.0) | 128.2 (15.6) | |
P value | 0.90 | <0.01 | <0.01 | <0.01 | |
BMI, kg/m2 | Baseline | 27.8 (4.2) | 28.5 (5.2) | 27.2 (3.7) | 26.8 (3.3) |
End of study | 27.7 (4.6) | 28.1 (4.8) | 27.3 (4.1) | 26.7 (3.2) | |
P value | 0.87 | 0.18 | 0.42 | 0.32 | |
Body water, % | Baseline | 48.6 (2.4) | 50.3 (4.9) | 53.2 (6.4) | 54.2 (5.9) |
End of study | 50.4 (4.5) | 52.1 (5.4) | 53.9 (6.1) | 56.3 (6.2) | |
P value | 0.14 | <0.01 | 0.40 | <0.01 | |
Body fat, % | Baseline | 33.9 (3.3) | 31.6 (6.7) | 27.7 (8.7) | 27.8 (11.8) |
End of study | 31.5 (6.1) | 29.7 (7.3) | 26.7 (8.3) | 23.4 (8.4) | |
P value | 0.15 | 0.01 | 0.40 | 0.01 | |
Body muscle mass, % | Baseline | 32.4 (3.3) | 33.9 (4.1) | 34.4 (3.9) | 36.1 (4.0) |
End of study | 32.2 (3.7) | 34.3 (4.4) | 34.4 (3.9) | 36.2 (3.9) | |
P value | 0.48 | 0.20 | 0.90 | 0.35 | |
LDL‑C, mg/dl | Baseline | 126 (50) | 117 (32) | 112 (29) | 116 (35) |
End of study | 129 (43) | 111 (31) | 112 (26) | 110 (33) | |
P value | 0.67 | 0.18 | 0.87 | 0.07 | |
HDL‑C, mg/dl | Baseline | 52 (19) | 56 (22) | 62 (12) | 60 (15) |
End of study | 55 (20) | 59 (20) | 66 (14) | 63 (17) | |
P value | 0.13 | 0.04 | 0.15 | 0.17 | |
SBP, mm Hg | Baseline | 130 (9) | 133 (9) | 132 (15) | 131 (12) |
End of study | 131 (10) | 132 (10) | 130 (5) | 130 (11) | |
P value | 0.88 | 0.68 | 0.49 | 0.65 | |
DBP, mm Hg | Baseline | 80 (10) | 79 (8) | 80 (9) | 77 (7) |
End of study | 77 (7) | 74 (7) | 76 (10) | 75 (7) | |
P value | 0.25 | <0.01 | 0.12 | 0.29 | |
Discussion
Physical activity is one of the most important preventive measures in modern medicine, including primary, secondary, and tertiary prevention. However, as with all interventions and medications, the appropriate dose is often difficult to quantify, whereas the verification of the effect of the intervention, in this case physical activity, is essential. Another important point is how the effect is achieved. Concerning drug‑based interventions, this aspect is mostly conditioned by the medication and its dose, while with physical activity, it mainly depends on training frequency and load. The most objective and exact way of measuring a performance gain is by a (bicycle) stress test. However, paper‑based training diaries might present a cheap and simple alternative for the monitoring of training in hobby athletes, in whom it differs significantly from that in professional athletes.10 Therefore, we investigated whether training diaries can reflect the training progress in hobby athletes. The main advantages and disadvantages of training diaries and bicycle stress test are summarized in Table 4.
Training diary | Bicycle stress test | |
Advantages | Cheap Easy to perform Potentially improving compliance Continuous/close‑meshed follow‑up | Gold standard in performance diagnostics Standardized methods/procedure Good comparability Delivers exact metric values Good availability |
Disadvantages | Extremely subjective Vague/difficult grading of training intensity No consistent form/mode | Comparatively costly Complex The results depend on physical condition on particular day Potential advantage of skillful cyclists as compared with inexperienced cyclists |
Our results showed a significant discrepancy between the reported workload and the objectively measured performance gain. The unathletic group 1 reported the highest number of monthly training minutes for moderate‑intensity training (766 minutes) but had a performance gain of only 0.4%. In contrast, the unathletic group 2 with a performance gain of about 12% reported “only” 547 minutes of moderate training per month. In comparison, the athletic group 3 reported only a marginally lower workload (558 min/mo) of moderate training and a higher workload (211 min/mo) of high‑intensity training compared with group 4 (576 min/mo and 187 min/mo, respectively). The workload did not correlate with the performance gain; however, in group 4, the correlation between the reported number of minutes of high‑intensity training per month and performance gain was almost significant but with a very weak regression coefficient. Also, in group 3, the performance gain even decreased during the study by 3.8% (although these participants reported the highest amount of high‑intensity training), which supports our hypothesis.
Concerning the surrogate parameters, we obtained conclusive data: athletic participants had a lower BMI, body fat, and LDL‑C levels and higher HDL‑C levels, as compared with unathletic participants. The performance gain was associated with a reduced body fat and body water. In the unathletic group 2 with a performance gain of about 12%, we even found significantly elevated HDL‑C levels and a lower diastolic blood pressure. The beneficial effect of regular physical activity on these surrogate parameters has already been reported before, also by our group.11,12
Our data show that the self‑reported moderate training load does not correlate with the objectively measured performance gain. The discrepancy between the reported training load and performance gain was particularly notable in unathletic individuals. It is a basic principle in training theory that a specific and individual training stimulus has to be reached to achieve a performance gain. Probably, those individuals who reported a high number of minutes for moderate‑intensity exercise did not reach a sufficiently high intensity to achieve a performance gain. However, it seems that in general, intensive training contributes more to performance gain than moderate‑intensity training. These results might be interesting for example for patients undergoing cardiac rehabilitation (who are generally unathletic). For patients in a rehabilitation program, an initial bicycle stress test, their subsequent classification into training groups according to individual performance, and a personalized workout plan (based on the calculated training pulse) seem to be reasonable from the medical point of view.
Importantly, participants who did not reach a performance gain also showed an improvement in selected surrogate parameters: groups 1 and 3 revealed a decrease of body fat and diastolic blood pressure and an increase in HDL‑C levels. Although these changes were nonsignificant, they might be of clinical relevance.
It should be mentioned that other questionnaires are available to evaluate the physical activity level of individuals. The examples of popular tools include the International Physical Activity Questionnaire (IPAQ) and the Baecke questionnaire. They also collect data on the activity level at work, while doing housework, or while using means of transportation.13,14 However, a previous study showed that the level of physical activity might be overestimated or overreported by participants completing the IPAQ.15
In general, the above questionnaires might serve as tools providing a vague overview of the physical fitness status.16,17 However, studies that would compare them to the objective assessment of performance, such as with a bicycle or treadmill stress test, are rare. Modern devices such as smart phones or watches with adequate applications could vastly improve the recording of training‑specific data in the future. Such devices can exactly record the heart rate, heart rate variability, speed, distance according to GPS, and many more parameters, thus facilitating the monitoring of training progress in hobby athletes. Also video games and virtual reality could be used as complementary tools for patients undergoing cardiovascular rehabilitation.18 However, as with every new technology, only a few brands are frequently used in research studies19 and very few are scientifically validated.20 Thus, one way to make these new devices and applications an established tool would be to use them in the field of cardiovascular rehabilitation, where they could be tested using scientifically sound methods while providing the patients with an opprtunity to do a more controlled training.
Limitations
Our study has several limitations. First, there were not enough data available for a reliable sex‑specific analysis. Second, the categories of exercies in the training diaries (moderate and high intensity) may be suitable for hobby athletes, but as they are arbitrary, the exact definition of the training load of a specific sport is lacking. Although bicycle stress tests are standard in performance testing, they provide just a glimpse on the performance of an individual, which might be influenced by several (uncontrolled) circumstances. However, we did not perform echocardiography or 24‑hour electrocardiography. Furthermore, the duration and intensity of training was recorded by the participants and was not controlled. Finally, there was a significant difference concerning the baseline performance of groups 3 and 4. Because group 4 had a lower baseline performance, it was easier for these participants to achieve a performance gain.
Conclusions
Paper‑based training diaries might serve as a complementary tool in the monitoring of training progress. However, because of the discrepancy between the reported training loads and durations and the objectively measured training progress by the bicycle stress test, they are not suitable to replace standard bicycle stress tests for the exact determination of a performance gain.
- Varghese T, Schultz WM, McCue AA, et al. Physical activity in the prevention of coronary heart disease: implications for the clinician. Heart. 2016; 102: 904‑909. | Crossref
- Nystoriak MA, Bhatnagar A. Cardiovascular effects and benefits of exercise. Front Cardiovasc Med. 2018; 5: 135. | Crossref
- Sponder M, Campean IA, Emich M, et al. Long‑term physical activity leads to a significant increase in serum sRAGE levels: a sign of decreased AGE‑mediated inflammation due to physical activity? Heart Vessels. 2018; 33: 893‑900. | Crossref
- Sponder M, Campean IA, Emich M, et al. Long‑term endurance training increases serum cathepsin S and decreases IL‑6 and hsCRP levels. J Sports Sci. 2017; 35: 2129‑2134. | Crossref
- Lippi G, Maffulli N. Biological influence of physical exercise on hemostasis. Semin Thromb Hemost. 2009; 35: 269‑276. | Crossref
ARTICLE INFORMATION