Characteristics of amino acid profiles and incretin hormones in patients with gallstone disease: a pilot study
Key words: amino acids, gallstone disease, incretin hormones


 CC BY-NC-SA 4.0
Characteristics of amino acid profiles and incretin hormones in patients with gallstone disease: a pilot study
Introduction: Gallstone disease is associated with insulin resistance, type 2 diabetes mellitus, and increased risk of incident ischemic heart disease. It is known that the profile of branched‑chain amino acids (BCAAs) is altered in cardiac diseases as well as metabolic diseases, such as diabetes and obesity. The role of BCAAs in gallstone disease is still not known.
Objectives: The aim of this study was to evaluate the concentration of essential amino acids and incretin hormones in patients with cholecystolithiasis.
Patients and methods: The study included 31 patients with cholecystolithiasis and 25 gallstone‑free controls. The levels of free exogenous and endogenous amino acids, bile acids, glucagon‑like peptide 1, glucose‑dependent insulinotropic polypeptide, ghrelin, C‐peptide, and insulin were measured in the fasting state and 1 hour after consumption of a 300‑kcal mixed meal.
Results: The mean fasting and postprandial levels of valine, isoleucine, leucine, and lysine were higher in the study group than in controls (all P <0.01). The percentage increase in concentrations of amino acids after a meal were similar in both groups of patients. The mean fasting concentrations of C‑peptide and glucagon‑like peptide 1 were higher in the study group than in the control group (P = 0.004 and P = 0.03, respectively), and the median postprandial concentration of C‑peptide was higher in the study group as compared with the control group (P = 0.03).
Conclusions: Diabetes mellitus, coronary heart disease, and gallstone disease might have common genetic and environmental antecedents. However, higher plasma levels of BCAAs observed in patients with gallstone disease may be partly responsible for metabolic complications observed in these patients.
What's new?
Branched‑chain amino acids (valine, isoleucine, leucine), the profile of which is altered in gallstone disease, may link gallstone disease with insulin resistance, type 2 diabetes mellitus, and cardiometabolic syndrome.
Introduction
Gallstone disease is a significant health problem in developed societies, affecting 5% to 25% of the adult population.1,2 Epidemiological studies have indicated a large number of risk factors for cholesterol stones. Physical inactivity and overnutrition are known risk factors for obesity and metabolic syndrome.3 Increasing prevalence of obesity, diabetes mellitus, and related adipose tissue dysfunction will be a relevant trigger for cardiovascular diseases.4 During excessive intake of food, the synthesis of whole‑body cholesterol is promoted, and its excess is eliminated with the bile. Thus, risk for gallstones is greatly increased.5 Moreover, insulin resistance and type 2 diabetes mellitus act as independent factors associated with gallstone disease.6,7 Hyperinsulinemia is related to increased hepatic cholesterol uptake, biliary secretion, and hyposecretion of biliary bile acids.3 In contrast, gallstone disease is associated with increased risk of incident ischemic heart disease, independent of traditional risk factors.8 In the German population, people with gallstones were at increased risk of myocardial infarction and stroke; however, they did not experience a lowered cardiovascular risk after gallbladder removal.9 It has also been reported that alterations in the profiles of essential amino acids in the blood are associated with cardiovascular disease (CVD).10
Essential amino acids necessary for proper human development are not synthesized in the body and must be ingested with food (exogenous essential amino acids such as isoleucine [Ileu], leucine [Leu], lysine [Lys], methionine, phenylalanine [Phe], threonine, tryptophan, valine [Val], and histidine). Among these essential amino acids, branched‑chain amino acids (BCAAs) (Val, Leu, and Ileu) are abundant in food, accounting for approximately 20% of total protein intake.11 Despite clinical evidence suggesting that the supplementation of essential amino acids or BCAAs has beneficial effects on body weight, body fat, lean body mass, and insulin sensitivity, the increased levels of BCAAs may cause insulin resistance and type 2 diabetes mellitus.11,12 Higher concentrations of BCAAs in plasma are associated with increased risk of CVD, especially stroke.13 In patients after myocardial infarction, cardiac BCAAs catabolism is impaired, resulting in myocardial BCAAs accumulation. Subsequently, BCAAs activate myocardial mammalian target of rapamycin signaling and contribute to cardiac dysfunction and remodeling following myocardial infarction.14 The role of BCAAs in gallstone disease is not known, and to our knowledge there are no data linking BCAAs with the risk of this disease.
Gastrointestinal hormones (glucagon‑like peptide‑1 [GLP‑1], glucose‑dependent insulinotropic polypeptide [GIP]), known as incretins, stimulate insulin secretion at physiological concentrations. The incretin activity is linked to the gastrointestinal processing of ordinary meals.15 New drugs have been developed for diabetes therapy. Incretin‑based drugs, such as GLP‑1 analogues, are relatively new antidiabetic therapies recommended for patients with type 2 diabetes mellitus.16,17 GLP‑1 analogues induce activation of the GLP‑1 receptor, which stimulates insulin secretion in a glucose‑dependent fashion while also inhibiting secretion of glucagon. The use of GLP‑1 analogs was associated with an increased risk of bile duct and gallbladder disease.16
The aim of this study was to evaluate the concentration of essential amino acids and incretin hormones in patients with cholecystolithiasis.
Patients and methods
Thirty‑one consecutive patients with symptomatic gallstone disease scheduled for elective surgery (laparoscopic cholecystectomy) were selected for the study group (21 women, mean age [SD], 56.2 [12.9] years; 10 men, mean age (SD), 51.5 [12.7] years). Gallstones were visualized in the gallbladder on ultrasound examination before the operation. Patients presented with mild, recurrent episodes of biliary colic. None of these patients had associated choledocholithiasis or acute cholecystitis. The control group consisted of 25 consecutive patients (18 women, mean age [SD], 47.0 [15.7] years; 7 men, mean age [SD], 67.1 [7.5] years) who were treated for hernias or had colonoscopy examination and had no pre- or intraoperative signs of cholelithiasis or jaundice. All patients were surgically treated at the Department of General and Oncological Surgery (St. John Grande Hospital in Kraków) from 2017 to 2018. The characteristics of the study population are presented in Table 1. White blood cell count, concentrations of glucose, thyroid stimulating hormone, and free thyroxine were comparable between the study and control groups, while body mass index (BMI) was higher in the study group.
Variable | Study group (n = 31) | Control group (n = 25) | P value |
Data are presented as mean (SD) or median (interquartile range).
Abbreviations: FT4, free thyroxine; TSH, thyroid stimulating hormone | |||
Body mass index, kg/m2 | 29.7 (3.39) | 26.3 (3.28) | <0.001 |
White blood cell count, × 109/l | 6.57 (1.55) | 6.57 (1.53) | 0.99 |
Fasting blood glucose, mmol/l | 5.56 (0.56) | 5.52 (0.66) | 0.84 |
TSH, mIU/l | 1.51 (0.81–4.18) | 1.52 (1.03–1.88) | 0.63 |
FT4, pmol/l | 16.9 (1.9) | 17.2 (2.2) | 0.55 |
Fasting venous blood samples and venous blood samples 1 hour after the consumption of a 300‑kcal mixed meal that was comprised of 24% protein, 41% carbohydrates, and 35% fat (Nutridrink protein, 125 ml, Nutricia, Zoetermeer, the Netherlands), were collected from all patients separately on lithium heparin and on EDTA with aprotinin. Blood was additionally collected to tubes containing a clot activator in order to obtain the serum for further analyses. The blood was centrifuged for 10 minutes at 1200 × g, and the plasma and serum were collected and kept at –70°C until analysis. Quantitative determination of plasma free amino acids was performed by the Pico‑Tag method (Waters, Milford, Massachusetts, United States). Samples were analyzed by a high‑performance liquid chromatography with UV–VIS detection (Waters) as previously described by Bugajska et al.18 The essential amino acids: Val, Ile, Leu, threonine, methionine, Phe, Lys, tryptophan, histidine and nonessential amino acids: arginine (Arg), tyrosine (Tyr), aspartic acid, glutamic acid, hydroxyproline, serine, asparagine, glycine, glutamine, taurine, citrulline, alanine, proline, α-aminobutyric acid, ornithine were determined.
The total bile acid content was measured using an enzymatic colorimetric method (bile acid, Randox Laboratories Ltd., Crumlin, United Kingdom). Enzyme‑linked immunosorbent assay kits were used to assay plasma GLP‑1 (Millipore, Billerica, Massachusetts, United States), plasma ghrelin (Millipore), and GIP (Immuno‑Biological Laboratories Co. Ltd., Fujioka, Japan). Serum C‑peptide concentrations were measured with radioimmunoassay method (DIAsource C‑PEP II- RIA‑CT Kit, Louvain‑la‑Neuve, Belgium).
Insulin, thyroid stimulating hormone, and free thyroxine concentrations were determined using the immunochemiluminescence method, with the ADVIA Centaur XP equipment (Tarrytown, New York, United States).
The study was approved by the Jagiellonian University Bioethics Committee (protocol no. 1072.6120.44.2017). All patients who participated in the study signed a free and informed consent form and were fully informed on all aspects related to the study. The study was conducted following all ethical and legal regulations.
Statistical analysis
Descriptive statistics (mean [SD], medians [interquartile ranges]) were used in the statistical assessment of the obtained results. Calculations were performed using the Statistica software version 10 (StatSoft, Kraków, Poland) and Microsoft Office Excel 2003 (Redmond, Washington, United States). The Shapiro–Wilk test was used to test the normality of variables. To compare parameters between the study group and the control group for normally distributed continuous variables, the t test was used, in case of nonnormal distribution, the Mann–Whitney test was used. The level of significance was set at a P value of less than 0.05.
Results
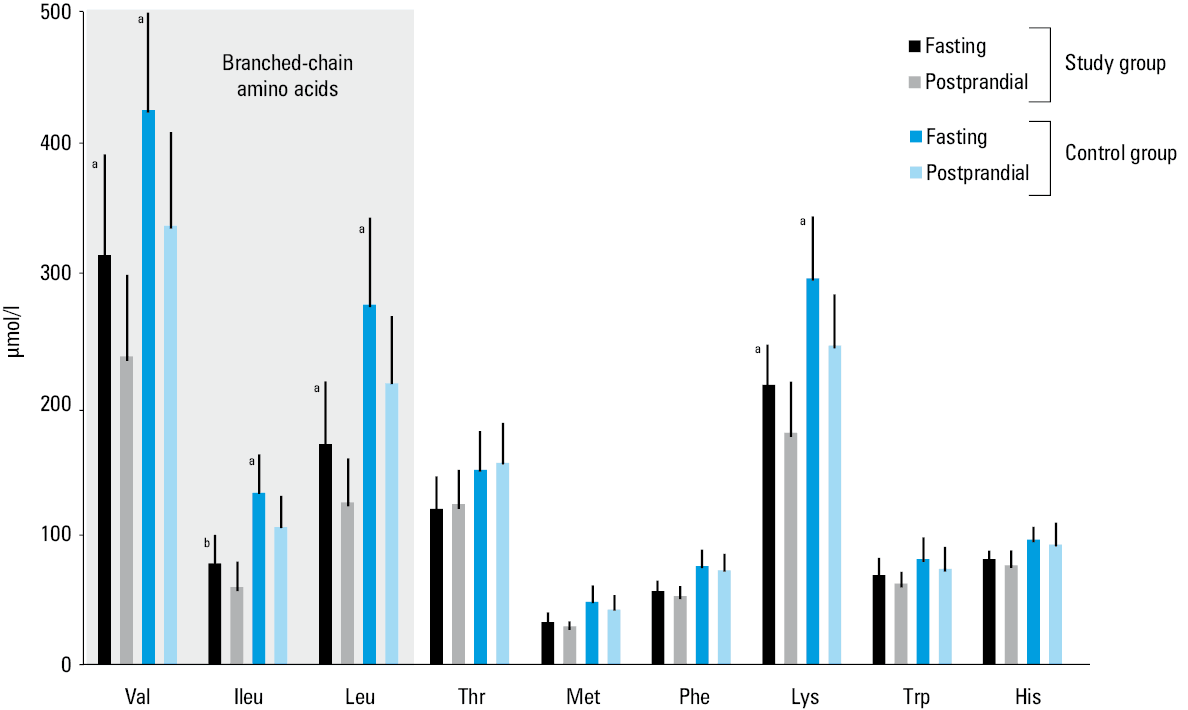
The concentrations of plasma essential amino acids of patients with cholelithiasis and controls are presented in Figure 1. The fasting and postprandial values of Val, Ile, Leu (BCAAs), and Lys were higher in the study group than in the control group (all P <0.01).
The fasting and postprandial values of total bile acids, hormones and nonessential amino acids concentrations obtained in the study group and in the control group are presented in Table 2. The fasting concentrations of Tyr, glutamic acid, alanine, proline, and ornithine were higher in the study group than in controls (P = 0.009, P = 0.02, P = 0.03, P = 0.02, and P = 0.03, respectively). The postprandial concentrations of Arg, Tyr, proline, α-aminobutyric acid, and ornithine were higher in the study group than in controls (P = 0.01, P = 0.006, P = 0.02, P = 0.04, and P = 0.02, respectively). The values of other amino acids were similar in both study groups. The percentage increases in concentrations of amino acids after a meal were the same in both study groups.
Variable | Fasting | Postprandial | ||||||
Study group (n = 31) | Control group (n = 25) | P value | Study group (n = 31) | Control group (n = 25) | P value | |||
Data are presented as mean (SD) or median (interquartile range).
Abbreviations: GIP, glucose‑dependent insulinotropic polypeptide; GLP‑1, glucagon‑like peptide‑1 | ||||||||
Total bile acids, μmol/l | 1.47 (0.81–2.73) | 1.46 (1.03–2.64) | 0.39 | 2.92 (1.61–4.82) | 2.5 (1.54–3.18) | 0.37 | ||
Hormones | ||||||||
Insulin, μIU/ml | 11.58 (6.22) | 9.11 (3.73) | 0.16 | 66.09 (39.35) | 44.9 (21.2) | 0.06 | ||
C‑peptide, ng/ml | 2.99 (1.13–6.16) | 2.29 (1.49–3.92) | 0.004 | 7.44 (5.42–8.75) | 5.3 (4.87–6.7) | 0.03 | ||
Ghrelin, pg/ml | 643.6 (233.5) | 691.1 (285.3) | 0.60 | 598.4 (195.7) | 620.2 (263.4) | 0.78 | ||
GLP‑1, pmol/l | 38.7 (16.5) | 27.1 (7.64) | 0.03 | 49.7 (18.2) | 39.0 (12.3) | 0.07 | ||
GIP, pmol/l | 30.8 (23.9–36.3) | 27.8 (17.6–36.0) | 0.19 | 205.7 (169.6–208.7) | 171.9 (137–208) | 0.32 | ||
Nonessential amino acids, μmol/l | ||||||||
Arginine | 114.4 (98.6–144.2) | 112.8 (91.6–120.7) | 0.37 | 149.3 (141.2–178.9) | 128.1 (109.5–147) | 0.01 | ||
Tyrosine | 69.5 (60–72.7) | 60.8 (53.9–71.1) | 0.009 | 100.2 (19.9) | 84.4 (21.6) | 0.006 | ||
Aspartic acid | 6.2 (2.3–11.9) | 4.3 (1.75–8.4) | 0.14 | 5.8 (2.2–13.3) | 3.2 (2–9.7) | 0.2 | ||
Glutamic acid | 120 (61.1–209.3) | 89.4 (49.9–162.4) | 0.02 | 141.8 (76.3–263.6) | 92.2 (54.5–183.3) | 0.07 | ||
Hydroxyproline | 8.3 (6.6–13.3) | 8.1 (6.35–11.4) | 0.14 | 9 (7.9–14.7) | 8.5 (7.2–11.9) | 0.31 | ||
Serine | 110.4 (27.5) | 117.5 (28.0) | 0.34 | 135.1 (33.0) | 153.2 (36.5) | 0.06 | ||
Asparagine | 59.9 (47.7–68.9) | 60.2 (48.9–68.9) | 0.84 | 82.0 (73.2–92.0) | 81.1 (74.0–90.9) | 0.81 | ||
Glycine | 212.6 (60.5) | 213.2 (64.0) | 0.97 | 215.6 (58.3) | 224.3 (67.6) | 0.61 | ||
Glutamine | 701.1 (146.6) | 657.0 (123.9) | 0.24 | 772.0 (150.3) | 753.7 (168.3) | 0.67 | ||
Taurine | 41.45 (11.8) | 39.84 (8.22) | 0.57 | 43.3 (11.6) | 42.0 (8.8) | 0.67 | ||
Citrulline | 31.47 (12.28) | 33.02 (11.75) | 0.64 | 32.7 (13.2) | 33.12 (10.5) | 0.91 | ||
Alanine | 573.9 (142.5) | 478.8 (182.2) | 0.03 | 722.6 (164.4) | 636.1 (206.9) | 0.09 | ||
Proline | 262.9 (197.2–377.8) | 214.8 (167.3–323.6) | 0.02 | 458.4 (354.9–512.4) | 323.6 (260.4–401.8) | 0.02 | ||
α-Aminobutyric acid | 40.5 (27–58.9) | 32.8 (25.3–47.5) | 0.08 | 55.3 (36.1–80.2) | 36 (27.5–60.1) | 0.04 | ||
Ornithine | 48.3 (42.6–70.3) | 45.6 (38–54.8) | 0.03 | 66.7 (54.0–80.1) | 55.6 (44.4–73.0) | 0.02 | ||
The fasting concentrations of C‑peptide and GLP‑1 were higher in the study group than in the control group (P = 0.004 and P = 0.03, respectively). The postprandial concentration of C‑peptide was higher in the study group than in the control group (P = 0.03). There were no differences for total bile acids, insulin, ghrelin, and GIP between the 2 groups.
Discussion
The prevalence of gallstone disease is higher in diabetic patients than in the general population with comparable characteristics (MICOL [Multicenter Italian Study on Cholelithiasis] study) (24.8% and 13.8%, respectively).19,20 The meta‑analysis by Weng et al21 supported the viewpoint that type 2 diabetes mellitus increases the risk of gallstone disease. Association between gallstone disease and type 2 diabetes mellitus is frequently linked to obesity.21 Furthermore, the association between high BMI and gallstone disease might be explained by insulin resistance. Gallbladder dysmotility might, thereby, be the mechanism of gallstone formation in insulin resistance.6 Caroli et al22 found a positive association between higher C‑peptide levels and cholelithiasis in diabetic patients. Würtz et al23 have shown that circulating BCAAs (Ile, Leu, Val) and aromatic amino acids (Phe, Tyr) from fasting serum are predictors of insulin resistance, but not glycemia, in young adults at a 6‑year follow‑up. BCAAs likely promote insulin resistance through activation of mammalian target of rapamycin complex.24
In the present study, the mean or median values of BCAAs, Tyr, C‑peptide, and insulin concentrations were higher in patients with cholelithiasis than in controls; however, for insulin, the difference was not significant. This is in agreement with the results obtained by Mendez‑Sanchez et al,25 who analyzed the serum concentrations of insulin in patients with cholecystolithiasis and noticed a greater tendency towards insulin resistance in that group than in controls.
Altered metabolism of BCAAs and their subsequent accumulation in the blood may precede the development of insulin resistance and clinical manifestation of cardiometabolic diseases.26 Increased BCAAs levels are independent risk factors of metabolic syndrome and CVD in middle‑aged and elderly Chinese populations.27 Shah et al28 used quantitative mass spectrometry to measure metabolomic profiles in 117 individuals within 8 multiplex families from the GENECARD (Genetics of Early Onset Cardiovascular Disease) study of premature coronary artery disease, and the results revealed that some amino acids (Arg, ornithine, alanine, proline, Leu, Ile, Val, glutamine, Phe, and glycine) were highly heritable and could be used to identify families with premature coronary artery disease. Mangge et al29 investigated the possibility of employing BCAAs to identify an increased CVD risk. They observed higher serum concentrations of Val, Ile, and Leu in the obese (BMI >30 kg/m2) and overweight (BMI, 25.1–30 kg/m2) patients with cardiometabolic abnormalities than in healthy subjects. The aromatic amino acids, such as Phe and Tyr, were increased in the overweight and obese patients with cardiometabolic abnormalities compared with subjects without such abnormalities. Ornithine concentrations were increased in overweight patients with cardiometabolic abnormalities compared with subjects without such abnormalities.29 Similar results were obtained in the present study, where the levels of these amino acids were higher in the study group than in the control group.
Mendez‑Sanchez et al25 found an inverse correlation of serum ghrelin levels and the prevalence of gallstone disease using a multivariate model in a logistic regression analysis, but the median of serum ghrelin values did not show a difference between the patients and controls. Similar results were obtained in the present study—the mean fasting and postprandial concentrations of ghrelin were lower in the study group than in the control group, but this difference was not significant.
The BCAAs given orally stimulate secretion of insulin, GLP‑1, and GIP.30,31 Our study revealed higher fasting concentrations of GLP‑1 in patients with cholecystolithiasis than in controls and higher GLP‑1 postprandial concentrations in the study group than in the control group, but these differences were not significant. In patients with gallstone disease, a higher concentration of GLP‑1 might be caused by higher concentrations of BCAAs. Similar results were obtained for GIP, but these differences were not significant. To our knowledge, this is the first study comparing the profile of amino acids and plasma incretin concentrations in patients with gallstones.
In the present study, the mean fasting and postprandial values of BCAAs were higher in the study group than in the control group, and the percentage increase in the concentrations of amino acids after a meal were the same in both groups. These results may suggest that high baseline concentrations of BCAAs might be biomarkers of the underlying metabolic dysfunctions (metabolic fingerprint) rather than the result of food ingestion. These observations confirm the results obtained by Ruiz‑Canela et al.13 They demonstrated that the Mediterranean diet has a negligible effect on 1‑year changes in BCAAs. It likely exerts its cardioprotective effects via alternative pathophysiological processes.
Taking into account the results of the present study, we hypothesized the following:
Type 2 diabetes mellitus, coronary disease, and gallstone disease might have common genetic and environmental antecedents. It has been already speculated by Stern
32that both diabetes and CVD share common antecedents rather than one being a complication of the other (the common soil hypothesis). Complications observed in gallstone disease are probably not related to the disease as such, but higher BCAAs levels might be the cause of type 2 diabetes mellitus and CVD.
A large multicenter study is necessary to evaluate the relationship between plasma amino acids and diabetes, gallstone disease, and CVD.
- Stinton LM, Shaffer EA. Epidemiology of gallbladder disease: cholelithiasis and cancer. Gut Liver. 2012; 6: 172‑187. | Crossref
- Kratzer W, Mason RA, Kachele V. Prevalence of gallstones in sonographic surveys worldwide. J Clin Ultrasound. 1999; 27: 1‑7. | Crossref
- Lammert F, Gurusamy K, Ko CW, et al. Gallstones. Nat Rev Dis Prim. 2016; 2: 16024. | Crossref
- Haberka M, Machnik G, Kowalowka A, et al. Epicardial, paracardial and perivascular fat quantity, genes expression and serum cytokines in coronary artery disease and diabetes. Pol Arch Intern Med. 2019; 129: 738‑746. | Crossref
- Grundy SM, Barnett JP. Metabolic and health complications of obesity. Dis Mon. 1990; 36: 641‑731.
ARTICLE INFORMATION