Exaggerated systolic hypertensive response to exercise predicts cardiovascular events: a systematic review and meta-analysis
Key words: cardiovascular events, exercise-induced hypertension, stress test, systolic hypertensive response to exercise


 CC BY-NC-SA 4.0
Exaggerated systolic hypertensive response to exercise predicts cardiovascular events: a systematic review and meta-analysis
Introduction: The pathophysiology of exaggerated systolic hypertensive response to exercise (SHRE) is not fully understood, with contradictory data on its role in predicting cardiovascular (CV) events.
Objectives: The aim of this review and meta‑analysis was to assess the association of SHRE with CV clinical outcomes in healthy normotensive individuals.
Patients and methods: We searched PubMed (MEDLINE), Cochrane Library, RefWorks, and Google Scholar to identify clinical studies that reported data on CV event rates and outcomes for patients with SHRE on exercise stress testing. Sensitivity and specificity analysis for assessing the diagnostic accuracy of the SHRE cutoff associated with CV events was estimated using hierarchical summary receiver operating characteristic analysis.
Results: We included 8 studies with 47188 participants and a median follow‑up of 19.3 years. Exaggerated SHRE was found in patients with composite events (CV mortality and coronary artery disease; hazard ratio [HR], 1.363; 95% CI, 1.135–1.604; P <0.001), in those with coronary artery events (HR, 1.532; 95% CI, 1.240–1.893; P <0.001), and in those with CV mortality (HR, 1.286; 95% CI, 1.075–1.539; P =0.006), as compared with individuals with normal response. An exercise systolic blood pressure of 196 mm Hg predicted CV events with a sensitivity of 62% (54%–69%) and specificity of 75% (60%–86%), with a positive likelihood ratio of less than 3 and a strong correlation (r = –0.71).
Conclusions: Our study supports the clinical relevance of exaggerated SHRE as a predictor of composite and individual CV clinical outcome. These findings should be considered as thought‑provoking evidence for better stratification and, consequently, for optimal management of this high‑risk population.
What's new?
The clinical relevance of exaggerated systolic hypertensive response to exercise (SHRE) and its predictive value of cardiovascular events have not been fully elucidated. This meta‑analysis answers those uncertainties. In a sample of 47188 participants from 8 studies, higher SHRE was found in individuals with composite events including cardiovascular (CV) mortality and coronary artery disease, as compared with individuals with normal response. This finding highlights the importance of identifying normal individuals with exaggerated SHRE as patients with prehypertension. It also paves the way for future studies that could propose optimal means of controlling blood pressure in individuals who would otherwise be discharged from clinics based on normal office blood pressure readings, but in essence, they are at significant cardiovascular risk.
Introduction
Exercise stress testing is mainly used for the assessment of coronary artery disease (CAD), with blood pressure (BP) measurements obtained as an integral part of the test.1 In healthy individuals, an increased cardiac output with exercise is associated with a constant increase in systolic BP (SBP), but diastolic BP (DBP) remains unchanged or may slightly fall. The prevalence of exaggerated systolic hypertensive response to exercise (SHRE) has previously been suggested to be 5% to 40%.2,3 However, there is no consensus on the exact definition or validated cutoff value for SHRE. In most publications, the SHRE is defined as a difference of 60 mm Hg between baseline and peak SBP for men and 50 mm Hg for women, or SBP at peak exercise exceeding the 90th percentile (>210 mm Hg for men and >190 mm Hg for women) or diastolic >110 mm Hg in either sex.4-7 The respective values at moderate exercise (100 Watt) are an SBP of 160 mm Hg and 170 mm Hg.8 The pathophysiology of SHRE is not fully understood, with various mechanisms proposed, including endothelial dysfunction, reduced compliance or increased stiffness of the great arteries, and high neurohormonal (mainly angiotensin II) stress–induced activation.9-15 Although SHRE may be clinically ignored, it has been reported to be associated with systolic and diastolic left ventricular (LV) dysfunction,16-22 and it can lead to target organ damage including LV hypertrophy, carotid atherosclerosis,17-21 and significant CAD,21 irrespective of resting BP.22,23 However, data on its predictive value regarding those events remain contradictory.24-27 Therefore, the aim of this review with meta‑analysis was to determine the role of SHRE in predicting CV clinical outcomes in healthy normotensive individuals.
Patients and methods
The methodology used in this study was based on the Meta‑analysis of Observational Studies in Epidemiology (MOOSE) statement for reporting systematic reviews and meta‑analyses of observational studies (Figure 1; MOOSE checklist).28The literature search was undertaken independently by 2 reviewers (LP and GB) and comprised the results of the most common online databases (PubMed [MEDLINE], Cochrane Library, RefWorks, and Google Scholar), with the main focus on published studies that reported data on CV event rates and outcomes (including mortality) until July 2017 in patients with SHRE on exercise stress testing. Disagreements between reviewers were resolved by discussion with the third reviewer (MYH). The included search terms were “exercise” or “stress test”; “exercise‑induced hypertension” or “hypertensive response to exercise” or “exercise‑related blood pressure” or “exercise blood pressure” or “exercise exaggerated systolic blood pressure” or “exercise” and “cardiovascular event” or “cardiovascular disease” or “cerebrovascular event” or “cerebrovascular disease” or “stroke” or “mortality” or “myocardial infarction” and “outcome” or “follow‑up” or “predict.” The search was limited to English language, human studies, and adults (>18 years). In addition, relevant articles from reference lists were also reviewed.
Criteria for study inclusion
Studies were included in the meta‑analysis if they met the following criteria: 1) published in a peer‑reviewed, English‑language journal; 2) a human study involving adults older than 18 years of age; 3) reporting office BP; 4) reporting exercise BP (measured during, at submaximal [moderate], and maximal workload); (5) reporting CV outcomes; and 6) including individuals with a clinical indication for exercise stress testing or who were otherwise healthy and normotensive. From this meta‑analysis, we excluded studies that enrolled: 1) patients with a history of any CV disease; 2) patients with end‑target organ damage (severe renal or liver disease); and 3) patients in whom exercise BP was only measured during recovery periods (not during exercise). We included only studies reporting categorical data, in which SHRE and non‑SHRE were compared, while continuous data were not analyzed due to the heterogeneous way of reporting. No restrictions were applied to the duration of follow‑up, including newly diagnosed type 2 diabetes. After individual analysis, the final studies included in this systematic review and meta‑analysis were unanimously accepted by the 2 reviewers (LP and GB). The outcomes investigated in this meta‑analysis were: 1) coronary events (acute coronary syndrome and/or myocardial infarction); 2) CV mortality; and 3) composite outcomes (CV mortality and CAD).
Literature search
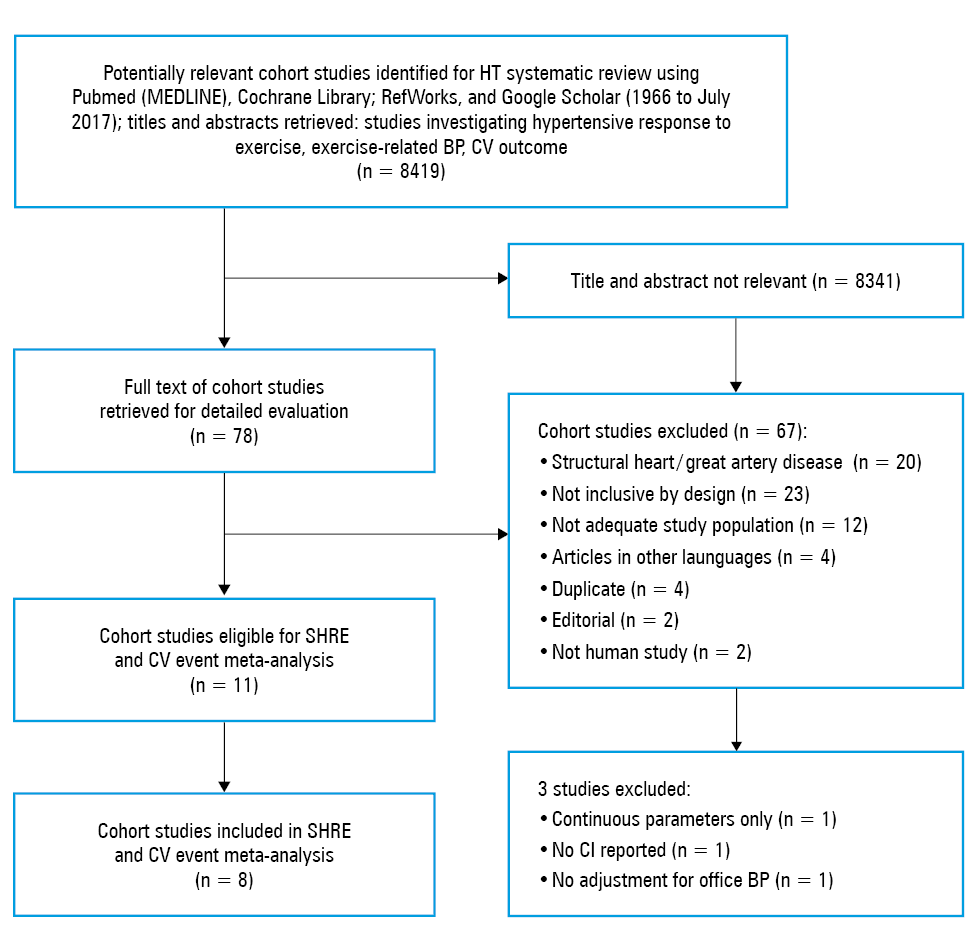
The literature search and selection process of articles included in the systematic review and meta‑analysis are presented in Figure 1. Initially, 4 online databases were used, resulting in 8419 articles. After excluding 8341 studies, 78 full articles were assessed. Of these 78 articles, 67 had to be excluded as per the applied criteria (Figure 1). A final critical search based on the eligibility criteria identified only 11 articles to be included in the analysis.29-39 Of these 11 articles, 3 were again excluded: one article did not report confidence intervals,29 another one lacked adjustment for office BP,31 and the third one relied on continuous parameters only.33 Finally, 8 studies were included in the meta‑analysis.
Data extraction
Two reviewers (LP and GB) independently extracted the relevant data, resolving any discrepancies by consensus. Data extracted for the systematic review included follow‑up duration, sex, age of participants, type of BP measurement, details on exercise test (treadmill, cycle, and energy per time), clinical outcomes (events or mortality), analysis type, reference group (individuals with no SHRE), SHRE (scores), and multivariate variables (Table 1).
Study, year | Subjects, n | Follow‑up, y | Male sex, % | Age, y | BP measurement | Workload | Exercise test (mode) | Outcomes: event or mortality | Analysis type | Reference group | SHRE | Variables included in multivariate models | Included in meta‑analysis |
Study, year | Subjects, n | Follow‑up, y | Male sex, % | Age, y | BP measurement | Workload | Exercise test (mode) | Outcomes: event or mortality | Analysis type | Reference group | SHRE | Variables included in multivariate models | Included in meta- -analysis |
Abbreviations: AMI, acute myocardial infarction; BG, blood glucose; BMI, body mass index; CHD, coronary heart disease; DBP, diastolic blood pressure; ECG, electrocardiogram; HDL, high‑density lipoprotein; HR, heart rate; LDL, low‑density lipoprotein; LVH, left ventricular hypertrophy; PF, physical fitness; SBP, systolic blood pressure; SHRE, systolic hypertensive response to exercise; T2DM, type 2 diabetes mellitus; W, Watt | |||||||||||||
Filipovsky et al, 199229 | 4907 | 17 | 100 | Mean (SD), 47 (2) | Noninvasive | Moderate | Bicycle (85–191 W) | 146 composite CV events | Categorical | Moderate
SBP <190 mm Hg | Moderate
SBP >230 mm Hg | Age, office SBP, BMI, exercise SBP, baseline HR, LVH, smoking, total cholesterol, and sports activities | No (no CI reported) |
Mundal et al, 199630 | 1999 | 16 | 100 | Range, 40–59 | Mercury sphygmo‑manometer | Moderate | Bicycle (600 kpm/min) | 255 CV deaths | Categorical | Moderate
SBP <200 mm Hg | Moderate
SBP >200 mm Hg | Age, office BP, exercise capacity, smoking, HR, BMI, cholesterol, triglycerides, glucose | Yes |
Fagard et al, 199631 | 143 | 16.2 | 100 | Mean (SD), 35 (12) | Brachial artery cannulation | Moderate/maximal | Bicycle (30 W/4 min) | 38 composite CV events | Continuous | Continuous only | Continuous only | Age, age squared, office BP | No (continuous parameters only) |
Kohl et al, 199632 | 26621 | 8.1 | 76 | Mean, 42 | Auscultation/sphygmo‑manometer | Maximal | Balke treadmill | 105 CV composite events | Categorical
Continuous | Moderate
SBP <171 mm Hg | Moderate
SBP >200 mm Hg | Age, BMI, office BP, treadmill time, cholesterol, glucose, CV family history, ECG changes, smoking | Yes |
Kurl et al, 200133 | 1026 | 10.4 | 100 | Mean (SD), 52 (5) | Mercury sphygmo‑manometer | Moderate/maximal | Bicycle (20 W/min) | 46 cerebro‑vascular events | Continuous | Continuous only | Continuous only | Age, examination years, alcohol consumption, smoking, LDL, T2DM, BMI | No (not adjusted for office BP; continuous parameters) |
Laukanen et al, 200634 | 1731 | 12.7 | 100 | Mean (SD), 52 (5) | Mercury sphygmo‑manometer | Maximal | Bicycle (20 W/3 min) | 188 AMI | Categorical | Maximal
SBP <230 mm Hg | Maximal
SBP >230 mm Hg | Age, office BP, year, antihypertensives, alcohol, smoking, LDL, HDL, T2DM, BMI, exercise ischemia LVH, VO2max, HR, energy expenditure of physical activity | Yes |
Lewis et al, 200835 | 3045 | 20 | 47 | Mean, 43 | Mercury sphygmo‑manometer | Moderate | Bruce treadmill | 240 CV events | Categorical
Continuous | Moderate
<80th percentile
SBP <180 mm Hg | Moderate
>80th percentile
SBP >180 mm Hg | Age, sex, office BP, BMI, T2DM, current smoking, total HDL, VHD, LVH (ECG), exercise test variables | Yes |
Hietanen et al, 201036 | 3808 | 15 | 66 | Mean (SD), 50 (10) | Mercury sphygmo‑manometer | Moderate | Bicycle (20 w/5 min) | 170 coronary events | Categorical
Continuous | Moderate
SBP <215 mm Hg | Moderate
SBP >215 mm Hg | Age, sex, BMI, smoking, family history, physical work capacity, self‑reported elevated cholesterol and abnormal glucose | Yes |
Weiss et al, 201037 | 6578 | Mean (SD), 20.1 (4) | 55 | Mean, 46 | Cuff technique | Submaximal | Bruce treadmill | 385 CV deaths | Categorical
Continuous | Moderate
SBP <146 mm Hg
Maximal
SBP <160 mm Hg | Moderate
SBP >180 mm Hg
Maximal
SBP >200 mm Hg | Age, sex, office BP, T2DM, LDL, HDL, triglycerides, smoking, BMI, family history | Yes |
Skretteberg et al, 201338 | 1392 | 28 | 100 | Mean, 49.2 | Mercury sphygmo‑manometer | Moderate | Bicycle (100 W/6 min) | 186 CHD deaths
292 CV events | Categorical | Moderate
SBP <170 mm Hg | Moderate
SBP >185 mm Hg | Family history, age, resting SBP, total cholesterol, smoking, BMI, SBP 100 W, maximal SBP, PF, resting DBP, resting HR, fasting BG | Yes |
Mariampillai et al, 201739 | 2014 | 35 | 100 | Range, 40–59 | Mercury sphygmo‑manometer | Moderate | Bicycle (100 W/6 min) | 226 CV events
309 CV deaths | Categorical | Moderate
SBP = 100–160 mm Hg | Moderate SBP = 200–275 mm Hg | Age, resting SBP, current smokers, total cholesterol, family history, BMI, SBP 100 W, maximal SBP, PF, resting DBP, resting HR, fasting BG | Yes |
Statistical analysis
Statistical analysis was performed using standard software package (Comprehensive Meta‑Analysis v. 3 software; Biostat inc., Englewood, New Jersey, United States). A 2‑tailed P values of less than 0.05 were considered significant. The baseline characteristics were reported as median and range. Mean and SD values were estimated using the method described by Hozo et al.40 For pooled analysis, risk ratio was also considered as hazard ratio (HR). The multivariate models (including age, sex, office BP, and CV risk factors) were included in the meta‑analysis. Forest plots were used to illustrate the individual results and meta‑analyses. Hazard ratios with 95% CIs were presented as summary statistics for moderate and maximal exercise subgroups, and also for the overall analysis. Heterogeneity between studies was tested by the Cochran test and means of the I2 statistic.41 To assess the additive (between‑study) component of variance, the reduced maximum likelihood method (τ2) included the analysis of residual heterogeneity occurrence.42 Studies were combined using a random effects model because of heterogeneity, in particular regarding cutoff points and outcomes. Publication bias was assessed using funnel plots and the Egger test. When 3 or more studies were included, we tested the subgroups for potential publication bias.
Diagnostic accuracy
To evaluate the diagnostic accuracy of the SHRE cutoff that predicted CV events, we used a hierarchical summary receiver operating characteristic (ROC) analysis. Sensitivity and specificity with 95% CIs for individual studies were computed based on a diagnostic random effects model.43 To obtain summary points that would consider within‑study and between‑study variability (heterogeneity), we performed the hierarchical summary ROC analysis using the Rutter and Gatsonis model.44 Summary point from the hierarchical summary ROC analysis was then used to calculate positive likelihood ratio. Separate analyses were performed for different SHRE cutoffs. In studies that did not provide optimal cutoffs, we created the ROC curve and identified the optimal cutoff as the point on the ROC curve closest to 0.1 on the x‑y coordinate. The OpenMetaAnalyst Yosemite software (version 12) for Windows (64‑bit version; Microsoft, Redmond, Washington, United States) was used for statistical analysis, including graphic presentations of the forest plots of sensitivity and specificity and hierarchical summary ROC curves.
Results
The total number of participants from the 11 studies33-43 included for qualitative synthesis was 53264, with a mean follow‑up of 18 years. Eight studies were eligible for the meta‑analysis,34,36,38-43 with a total of 47188 participants and a mean follow‑up of 19.3 years.
Systolic hypertensive response to exercise as a predictor of composite clinical outcomes
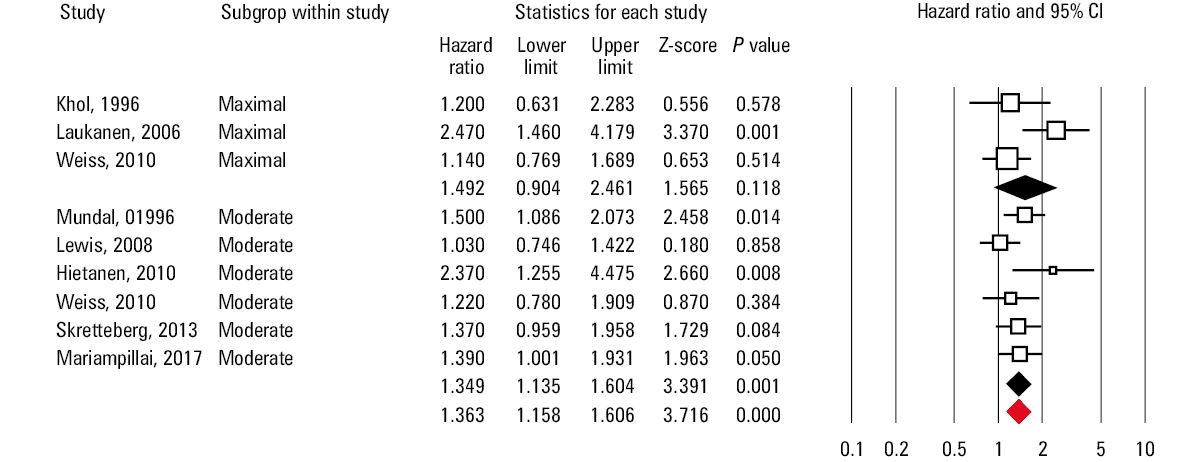
The 8 included studies reported the following composite outcomes: CV mortality and CAD. In all studies, patients with SHRE had a higher rate of composite events (HR, 1.363; 95% CI, 1.158–1.606; P <0.001; Figure 2), as compared with those with normal response. The rate of composite events did not differ between patients who achieved and those who did not achieve SHRE at maximal workload (P = 0.118). On the other hand, the rate of composite events was higher in patients who achieved SHRE at moderate workload, as compared with those who did not achieve SHRE at moderate workload (HR, 1.349; 95% CI, 1.135–1.604; P = 0.001; Figure 2). There was no heterogeneity between the included studies, and there was no publication bias either for moderate- or for maximal‑exercise subgroups (P = 0.21 and P = 0.77, respectively).
Systolic hypertensive response to exercise as a predictor of coronary events
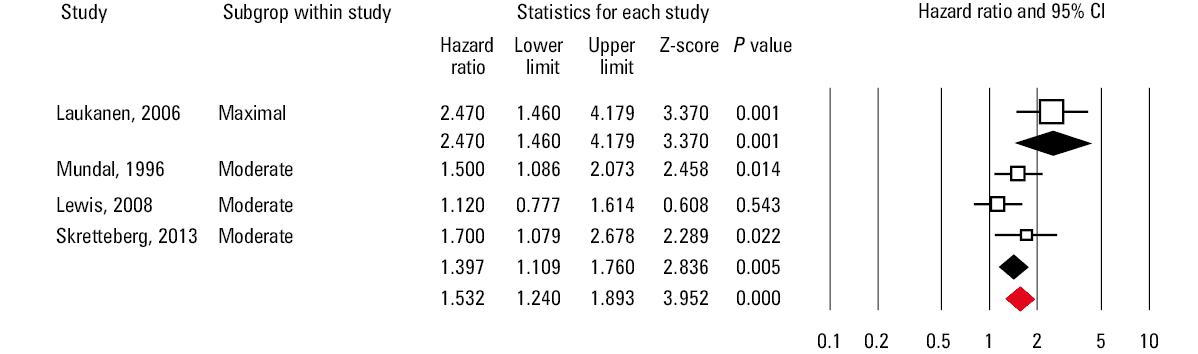
Coronary artery events (acute coronary syndrome and/or myocardial infarction) during follow‑up were reported in 4 of the 8 included studies. Of all the included patients, those with SHRE had a higher rate of coronary artery events during follow‑up (HR, 1.532; 95% CI, 1.240–1.893; P <0.001; Figure 3), as compared with those with normal response. Only 1 study provided data of patients who achieved SHRE at maximal workload. The rate of coronary artery events was higher in patients who had SHRE (HR, 2.470; 95% CI, 1.460–4.179; P = 0.001), as compared with those without. The reported data from 3 other studies showed that patients who achieved SHRE at moderate workload had a higher rate of coronary artery events (HR, 1.397; 95% CI, 1.109–1.760; P = 0.005; Figure 3), as compared with those who had normal response. There was moderate heterogeneity between the included studies, and there was no publication bias (P = 0.8).
Systolic hypertensive response to exercise as a predictor of cardiovascular mortality
Cardiovascular mortality during follow‑up was reported in 5 of the 8 included studies. In all studies, the CV mortality rate was higher in patients with SHRE (HR, 1.286; 95% CI, 1.075–1.539; P = 0.006; Figure 4) than in those without. The CV mortality rate did not differ between patients who achieved and who did not achieve SHRE at maximal workload (P = 0.397). On the other hand, the rate was higher in patients who achieved SHRE at moderate workload (HR, 1.343; 95% CI, 1.085–1.661; P = 0.007; Figure 4), as compared with those who did not. There was no heterogeneity between the included studies, and there was no publication bias (P = 0.31).
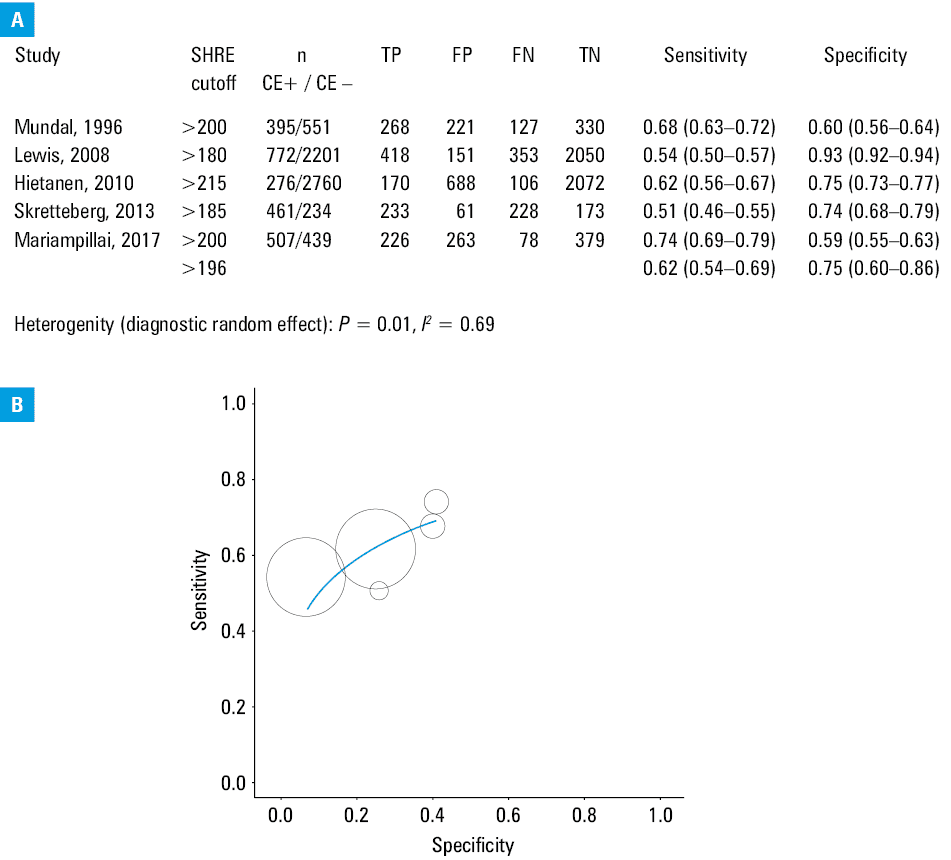
![Diagnostic accuracy of systolic hypertensive response to exercise (SHRE); A – individual studies, diagnostic 2×2 data (true positive [TP], false positive [FP], false negative [FN], true negative [TN], and corresponding values of sensitivity and specificity with 95% CI). Summary heterogeneity is described by the I2 statistic. B – Rutter and Gatsonis44 hierarchical summary receiver operating characteristic analysis for SHRE (summary cutoff) to identify cardiac events; summary sensitivity and specificity with 95% CI and corresponding positive likelihood ratio are shown. Abbreviations: CE+, with cardiac events; CE–, without cardiac events](/paim/_next/image/?url=https%3A%2F%2Fpamw.pl%2Fsites%2Fdefault%2Ffiles%2Fjson_zip_files%2Funcompressed%2F15007%2FIMAGES%2FPAMW_WEB__PAMW-D-19-00230_orig__FIG_04__PAGE_860.png&w=3840&q=75)
Diagnostic accuracy of systolic hypertensive response to exercise for composite cardiovascular events
In the ROC analysis, an SBP cutoff value of 196 mm Hg predicted composite CV events with a summary sensitivity of 62% (range, 54%–69%) and specificity of 75% (range, 60%–86%), with a positive likelihood ratio of less than 3 and a strong correlation (r = –0.71). Data are presented in Figure 5.
Discussion
This meta‑analysis showed that SHRE, particularly at moderate exercise, was associated with a serious composite clinical outcome in the form of coronary events and CV mortality. In addition, the cutoff value of 196 mm Hg and higher for exercise SBP was strongly correlated with this clinical outcome.
Hypertension is the most dynamic CV condition.45 While resting values could be entirely normal (according to set guidelines), they may significantly fluctuate, even up to values that could justify hospital admission in some cases. Although hypertension is difficult to predict and manage, exercise‑related changes in BP are feasible and reproducible measures of this condition, hence our interest in assessing the relationship between SHRE and clinical outcome. Indeed, our analysis showed that SHRE is related to serious clinical outcomes including CV mortality and life‑threatening coronary artery events in patients with satisfactory and acceptable resting or office BP values. These findings are alarming and highlight the potential adverse consequence of ignoring exercise‑related hypertension. However, the question remains as to how to manage such individuals, since there are no guidelines to recommend a particular treatment, or to specify the level of SHRE at which such a treatment should be applied, or to determine the type of treatment itself. In addition, apart from the general recommendation of a healthy lifestyle for all CV patients, no particular approach is advised for these individuals to control fluctuating BP. The possibility of unmonitored cardio exercise training in these individuals raises concern, because they could exceed a systolic BP value of 200 mm Hg without proper medical attention. Based on our results, we propose a value of 196 mm Hg for systolic SHRE as a predictor of worse clinical outcome and suggest that its predictive value is confirmed in large‑cohort prospective studies.
Fluctuating BP is known to have an adverse effect on arterial health, including endothelial dysfunction and arterial stiffness. If the combination of these 2 components of pressure afterload is ignored, it will affect LV diastolic function and later cavity compliance, even if systolic function is preserved.46 In addition, in patients with persistently elevated pressure afterload, it will inevitably lead to subendocardial ischemia with the related risk of arrhythmia.47 Finally, a perpetual increase of LV stiffness leads to left atrial enlargement along with elevated pressure, resulting in complications such as arrhythmia and thromboembolism. These consequences could explain diastolic dysfunction in middle‑aged normotensive individuals with no other underlying cardiac pathology.23 Therefore, there is an urgent need for determining physiologically acceptable BP changes associated with stress in patients with SHRE.
Limitations
Although 8 studies were eligible for this analysis, subanalyses according to the reported clinical outcome largely reduced this number, resulting in a potentially limited impact. We had no influence on the design of individual studies, which is a known limitation of meta‑analyses. As an example, there was a higher prevalence of men in some studies, which might limit the applicability of our findings to both sexes. Despite differences in study design, our findings showed no heterogeneity or bias between the included publications. Our meta‑analysis supports the importance of assessing SHRE during stress test, but it does not provide any recommendations on possible protocols. The workloads were increased with different protocols in individual studies. However, the target SHRE was achieved in all studies, and we believe that the increased SBP did not differ at the same workload between individual studies.
Conclusions
The current meta‑analysis supports the clinical relevance of exaggerated SBP response to exercise as a predictor of serious composite CV clinical outcome. These findings should be considered as thought‑provoking evidence for better stratification and, consequently, for optimal management of this high‑risk population.
- Pinkstaff S, Peberdy MA, Kontos MC, et al. Quantifying exertion level during exercise stress testing using percentage of age‑predicted maximal heart rate, rate pressure product, and perceived exertion. Mayo Clin Proc. 2010; 85: 1095‑1100. | Crossref
- Manolio TA, Burke GL, Savage PJ, et al. Exercise blood pressure response and 5‑year risk of elevated blood pressure in a cohort of young adults: the CARDIA study. Am J Hypertens. 1994; 7: 234‑241. | Crossref
- Singh JP, Larson MG, Manolio TA, et al. Blood pressure response during treadmill testing as a risk factor for new‑onset hypertension. The Framingham Heart Study. Circulation. 1999; 99: 1831‑1836. | Crossref
- Schultz MG, Sharman JE. Exercise hypertension. Pulse (Basel). 2014; 1: 161‑176. | Crossref
- Shim CY, Ha JW, Park S, et al. Exaggerated blood pressure response to exercise is associated with augmented rise of angiotensin II during exercise. J Am Coll Cardiol. 2008; 52: 287‑292. | Crossref
ARTICLE INFORMATION