Proteoglycan/glycosaminoglycan and collagen content in the arterial wall of patients with end-stage renal disease: new indicators of vascular disease
Key words: biomarkers, end-stage renal disease, glycosaminoglycans, plasminogen activator inhibitor 1, proteoglycans


 CC BY-NC-SA 4.0
Proteoglycan/glycosaminoglycan and collagen content in the arterial wall of patients with end-stage renal disease: new indicators of vascular disease
Introduction: The prevalence of cardiovascular (CV) comorbidity in patients with chronic kidney disease (CKD) is high, particularly in end‑stage renal disease (ESRD). There is an ongoing search for novel biomarkers of CV disease in this population.
Objectives: We aimed to investigate the associations of matrix proteoglycans (PGs) and glycosaminoglycans (GAGs), collagen, and arterial calcifications with selected serum and plasma markers of endothelial dysfunction, inflammation, oxidative stress, and bone turnover in patients with ESRD.
Patients and methods: We enrolled 47 adult patients (32 men) with stage 5 CKD. The following parameters were investigated: fibrinogen, soluble thrombomodulin (sTM), plasminogen activator inhibitor 1 (PAI‑1), stromal cell‑derived factor 1α (SDF‑1α), calcium (Ca), phosphate (Pi), intact parathormone, interleukin 6, high‑sensitivity C‑reactive protein (hs‑CRP), ferric reducing ability of plasma, 2,2‑diphenyl‑1‑picrylhydrazyl scavenging, ferric reducing ability of ascorbate in plasma, fetuin‑A, fibroblast growth factor 23, osteopontin, osteoprotegerin, osteocalcin, transforming growth factor β (TGF-β), hepatocyte growth factor, secreted protein acidic and rich in cysteine, as well as matrix metalloproteinase 2. Radial artery specimens were stained with alizarin red for calcifications, alcian blue for PGs and GAGs, and sirius red for collagen.
Results: We observed positive correlations between PG and GAG, collagen, and calcification staining. The most intense (grade 3) alcian blue staining was significantly correlated with diabetes as well as higher levels of Ca × Pi product, hs‑CRP, fibrinogen, SDF‑1α, PAI‑1, and sTM. However, PAI‑1 was the only significant predictor of grade 3 alcian blue staining in a multiple logistic regression model adjusted for hemodialysis, Ca × Pi product, and hs‑CRP levels.
Conclusions: Coagulation disorders and endothelial dysfunction are the hallmarks of ESRD. The levels of SDF‑1α, PAI‑1, sTM, and fibrinogen may be novel predictors of early vascular wall alterations and may serve as CV risk markers.
What's new?
Recently, investigators have focused on the identification of novel predictors of chronic kidney disease and high cardiovascular risk, which remains a leading cause of mortality in renal patients. Previous reports indicated that the extracellular matrix is a dynamically changing structural network subject to alterations, for example, in proteoglycan and collagen content, even in the very early stages of vascular pathology. In this study, we investigated a population of uremic and hemodialyzed patients who are particularly susceptible to cardiovascular comorbidity. Using an extensive panel of established and emerging biomarkers as well as morphological assessment (semiquantitative histology), we reported significant associations within the unique milieu of renal failure. We identified several potential predictors (particularly plasminogen activator inhibitor 1) of alterations in matrix composition, which may reflect an initial stage of vascular disease. Our findings add to the current knowledge on promising markers in renal disease.
Introduction
The extracellular matrix (ECM) of vascular walls is a complex polymeric structure composed of proteoglycans (PGs), elastin, collagens, and various glycoproteins acting to preserve vascular integrity and transduce signals.1 Proteoglycans participate in collagen modification, growth factor retention, and chemokine signaling.2 In vascular disease, ECM composition and regulation are altered, as illustrated by the accumulation of PGs and smooth muscle cells in early atherosclerotic lesions.1 The role of ECM remodeling in calcification has been increasingly recognized. This is also associated with high cardiovascular (CV) morbidity in chronic kidney disease (CKD),3,4 as there has been an ongoing search for biomarkers in CKD alone.5-7 Genovese et al8 recently proposed that the ECM, as the underlying site of fibrosis, should be investigated to identify biomarkers of ECM remodeling in renal disease.
Plasminogen activator inhibitor type 1 (PAI‑1) is a molecule regulating the activity of plasmin, which dissolves fibrin and activates matrix metalloproteinases (MMPs), known regulators of the ECM.9,10 Dysregulation of fibrinolysis may result from an increased PAI‑1 level, which has been linked to CV disease,11 insulin resistance, metabolic syndrome, and vascular abnormalities, including endothelial dysfunction and coagulation disorders.9 These processes are well recognized in the pathogenesis of CKD. Hemostatic molecules, including soluble thrombomodulin (sTM), a marker of endothelial injury, have been correlated with inflammation and surrogate markers of atherosclerosis.12 Enhanced PAI‑1 production may also be involved in endothelial dysfunction and early atherogenesis.13 In 2017, a systematic meta‑analysis confirmed the association between PAI‑1 and coronary artery disease, independent of traditional CV risk factors.14 Taken together, coagulation disorders seem to be closely associated with several processes affecting CV morbidity and may mediate known pathways of atherogenesis.
Chronic inflammation is another key player in CKD. In patients with renal failure, elevated C‑reactive protein (CRP) levels and diabetes were demonstrated as independent risk factors for CV events.15 High CRP levels increase the risk of CV disease, irrespective of traditional risk factors.16 Malyszko et al17 indicated that adipose tissue may also contribute to CV disease by releasing inflammatory molecules such as tumor necrosis factor α, adiponectin, and PAI‑1. Recently, the CRIC study (Chronic Renal Insufficiency Cohort) has reported that elevated levels of tumor necrosis factor α and fibrinogen are independent predictors of CKD progression and may be useful in risk stratification.18
The aim of the present study was to determine the associations of several known and emerging biomarkers of inflammation, oxidative stress, endothelial dysfunction, and bone turnover with changes in matrix composition and calcifications of the radial arteries assessed morphologically in patients with stage 5 CKD.
Patients and methods
In this cross‑sectional study, we adopted a methodology similar to our previous investigations,6,19,20 which were conducted as part of a completed research initiative, designed by KK, at the Department of Nephrology of Jagiellonian University Medical College in Kraków, Poland. However, the assessment of alcian blue and sirius red staining of the arterial wall in relation to vascular morphology and a panel of biochemical parameters is unique to this study and has not been reported before.
Consecutive patients with CKD treated at the Department of Nephrology were screened for potential eligibility and recruited if they fulfilled the following inclusion criteria: stage 5 CKD and necessity to establish an arteriovenous fistula (AVF) access for hemodialysis (HD), which would enable sampling of radial artery fragments for further histological assessment. The exclusion criteria were as follows: active infection, positive hepatitis B or C virus tests, HIV infection, renal transplant, parathyroidectomy, and malignancy.
The study included 47 adult patients (15 women, 32 men), of whom 19 were in predialysis stage while 28 were already undergoing HD with a short‑term or permanent catheter. The characteristics and clinical profile of patients are shown in Table 1. Medical history included information on comorbidities, diabetes mellitus, hypertension, dyslipidemia, current smoking status, duration of dialysis, and medication use. As part of a completed research project, surgeons collected specimens of radial artery tissue while establishing an autologous AVF. Following this procedure, a predefined set of laboratory markers of inflammation, oxidative stress, endothelial dysfunction, and bone turnover was assayed.
Parameter | Predialysis patients (n = 19) | Hemodialysis patients (n = 28) | P value |
Data are presented as median (lower quartile; upper quartile) unless otherwise indicated.
Abbreviations: BMI, body mass index; eGFR, estimated glomerular filtration rate; HD, hemodialysis; MDRD, Modification of Diet in Renal Disease; NA, not applicable | |||
Age, y | 62 (56; 72) | 60 (48; 74) | 0.5 |
Male sex, n (%) | 13 (68) | 19 (68) | 0.9 |
Maintenance HD duration, mo | NA | 5.5 (1.0; 27.0) | NA |
eGFR (MDRD), ml/min/1.73 m2 | 13 (10; 14) | NA | NA |
BMI, kg/m2 | 27.1 (23.6; 30.9) | 24.6 (21.9; 28.1) | 0.08 |
Diabetes, n (%) | 6 (32) | 6 (21) | 0.4 |
Hypertension, n (%) | 18 (95) | 22 (79) | 0.2 |
Dyslipidemia, n (%) | 12 (63) | 14 (50) | 0.5 |
Active smoking, n (%) | 4 (21) | 10 (36) | 0.3 |
Histology
Samples of radial arteries were collected during AVF procedures. Staining with alizarin red for calcium deposits, alcian blue for matrix PGs and glycosaminoglycans (GAGs), and sirius red for collagen was followed by microscopic evaluation. Brightfield images were obtained using an Olympus DP‑71 digital CCD camera with the Olympus AnalySIS FIVE software (Olympus, Tokyo, Japan). Blinded assessment was performed by an experienced histologist. The degree of vascular calcification was semiquantitatively evaluated according to the following scale: 0, no mineral content; 1, a few small dispersed concretions; 2, numerous small dispersed concretions; 3, larger granular concretions; and 4, large areas occupied by fused mineral deposits. Calcification was limited to the vascular media in all samples. The relative content of PGs and GAGs was also assessed semiquantitatively (staining intensity grades, 1–3).
The reproducibility of the adopted method of histological analysis was documented and described elsewhere.19
Laboratory tests
Serum and plasma samples were obtained from peripheral venous blood after overnight fasting. Procedures were performed prior to the scheduled surgery for AVF creation. For plasma samples, blood was collected into EDTA tubes and subsequently frozen at a temperature of −70°C and stored for further analysis.
In all patients, the following biochemical parameters were assessed: creatinine, fibrinogen, sTM, PAI‑1, stromal cell‑derived factor 1α (SDF‑1α), calcium (Ca), phosphate (Pi), intact parathormone (iPTH), interleukin 6 (IL‑6), high‑sensitivity CRP (hs‑CRP), ferric reducing ability of plasma, 2,2‑diphenyl‑1‑picrylhydrazyl scavenging (DPPH), ferric reducing ability of ascorbate in plasma (FRAP), fibroblast growth factor 23 (FGF‑23), osteopontin, osteoprotegerin, osteocalcin, transforming growth factor β (TGF-β), hepatocyte growth factor (HGF), secreted protein acidic and rich in cysteine (SPARC), and MMP‑2. Biochemical assays were performed with the use of automatized analyzers: Hitachi 917 (Hitachi, Osaka, Japan) and Modular P (Roche Diagnostics, Mannheim, Germany).
Markers of endothelial injury, inflammation, and mineral and bone disorder were investigated with microplate enzyme‑linked immunosorbent assays (ELISA) using an ELX808 automatic reader (BIO‑TEK® Instruments Inc., Winooski, Vermont, United States). The following kits were applied: osteoprotegerin (BioVendor, Brno, Czech Republic); osteopontin, HGF, IL‑6, TGF-β, SPARC, and MMP‑2 (R&D Systems, Minneapolis, United States); osteocalcin (Metra/Quidel, San Diego, California, United States), and FGF‑23 (Immunotopics Int., San Clemente, California, United States). Serum thrombomodulin, SDF‑1α, and PAI‑1 levels in platelet‑poor EDTA plasma samples were measured using commercially available ELISAs (sTM, Human Thrombomodulin/BDCA‑3 Immunoassay, R&D Systems; SDF‑1α, Human CXCL12/SDF1α Immunoassay, R&D Systems; and PAI‑1, Human Serpin E1/PAI‑1 Immunoassay, R&D Systems).
Plasma was investigated for total antioxidant capacity, as determined by the ability of plasma to reduce Fe3+ to Fe2+, in accordance with the Benzie method.21 A DPPH radical scavenging assay was used to determine radical scavenging capacity of plasma, as described by Janaszewska and Bartosz.22 The FRAP level was measured using spectrophotometry.
Statistical analysis
Quantitative data were reported as a number and percentage of patients, and qualitative data, as median (lower and upper quartiles). Correlations between ordinal variables were assessed using the Goodman and Kruskal γ coefficient. Contingency tables were analyzed with the χ2 test. Laboratory results were compared between the groups using the Mann–Whitney test or the Kruskal–Wallis analysis of variance. Logistic regression was used to assess predictors of high‑grade histological staining (ie, grade 3 alcian blue and grade 3 sirius red). The multiple logistic regression models were adjusted for HD status. The models included independent variables that were significantly associated with the outcome variable in a simple analysis. However, the variables that were highly correlated (eg, hs‑CRP and fibrinogen) were not included in a single model to avoid redundancy. The original qualitative variables were included in the models (they were not categorized), and the odds ratios were reported for a 1‑unit increase. Results were considered significant at a P value of less than 0.05 in 2‑tailed tests. The Statistica 12 software was used for analysis (StatSoft, Tulsa, Oklahoma, United States).
Results
Clinical characteristics of patients
The basic clinical characteristics did not differ significantly between predialysis (uremic) patients and those receiving HD. Hypertension and dyslipidemia were the most prevalent conditions, while approximately 25% of the patients had diabetes (Table 1). The groups differed in terms of medication use. Statins, antiplatelet drugs, and diuretics were more commonly used in predialysis patients, while patients on HD more often used erythropoietin analogues (Supplementary material, Table S1).
Histological examination of radial arteries
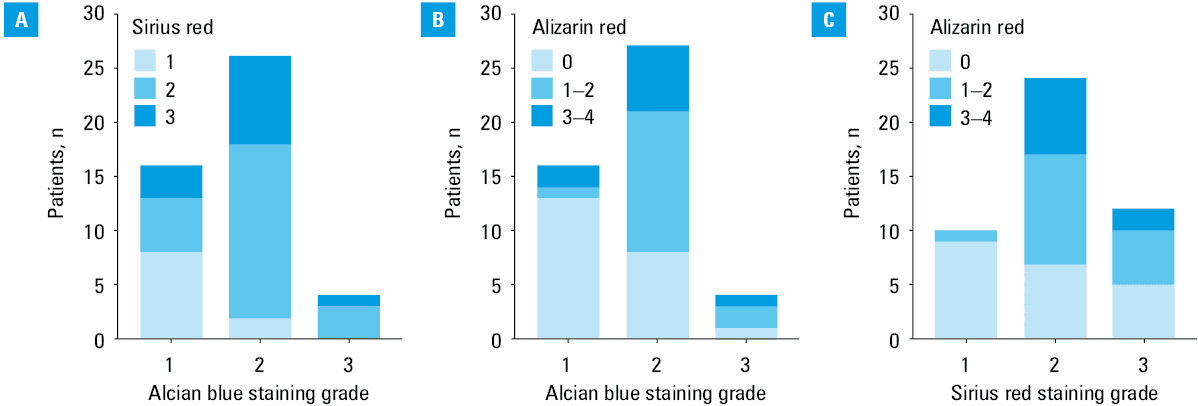
Radial artery sections were stained for PGs and GAGs (alcian blue), collagen (sirius red), and calcifications (alizarin red) in the ECM. The distribution of staining grades in the study group is shown in Table 2. We observed positive correlations between the grades of the 3 stainings, with γ coefficients of 0.5 between alcian blue and sirius red staining (P = 0.002; Figure 1A), 0.59 between alcian blue and alizarin red staining (P <0.001; Figure 1B), and 0.38 between sirius red and alizarin red staining (P = 0.01; Figure 1C).
Staining | Patients with stage 5 CKD (n = 47) | |
Data are presented as number (percentage). | ||
Proteoglycans and glycosaminoglycans (alcian blue staining) | Grade 1 | 16 (34) |
Grade 2 | 27 (57) | |
Grade 3 | 4 (9) | |
Collagen (sirius red staining) | Grade 1 | 10 (21) |
Grade 2 | 24 (51) | |
Grade 3 | 12 (26) | |
No data | 1 (2) | |
Calcification (alizarin red staining) | Grade 0 | 22 (47) |
Grade 1 | 12 (26) | |
Grade 2 | 4 (9) | |
Grade 3 | 4 (9) | |
Grade 4 | 5 (11) | |
Associations between histological staining and laboratory markers of hemostasis, endothelial dysfunction, bone turnover, and inflammation
The differences in studied laboratory markers between predialysis and HD patients are shown in Table 3. Patients on HD had higher concentrations of serum creatinine, Ca × Pi product, FGF‑23 (but not iPTH), osteopontin, and sTM. The remaining laboratory markers did not differ significantly between groups.
Parameter | Predialysis patients (n = 19) | Hemodialysis patients (n = 28) | P value |
Data are reported as median (lower quartile; upper quartile). A P value of less than 0.05 was considered significant.
Abbreviations: Ca, calcium; DPPH, 2,2‑diphenyl‑1‑picrylhydrazyl scavenging; FGF‑23, fibroblast growth factor 23; FRAP, ferric reducing ability of plasma; FRASC, ferric reducing ability of ascorbate in plasma; HGF, hepatocyte growth factor; hs‑CRP, high‑sensitivity C‑reactive protein; IL‑6, interleukin 6; iPTH, intact parathormone; MMP‑2, matrix metalloproteinase 2; PAI‑1, plasminogen activator inhibitor 1; Pi, phosphate; SDF‑1α, stromal cell‑derived factor 1α; SPARC, secreted protein acidic and rich in cysteine; sTM, soluble thrombomodulin; TGF-β, transforming growth factor β | |||
Creatinine, μmol/l | 396 (258; 452) | 511 (405; 571) | 0.001 |
Fibrinogen, g/l | 5.12 (4.34; 5.52) | 4.73 (4.35; 5.77) | 0.8 |
hs‑CRP, mg/l | 3.28 (2.14; 6.91) | 7.95 (3.06; 19.00) | 0.1 |
IL‑6, pg/ml | 2.94 (2.15; 4.18) | 5.28 (1.86; 8.44) | 0.2 |
TGF-β, ng/ml | 6,44 (6.09; 8.63) | 5.01 (4.17; 7.04) | 0.2 |
HGF, ng/ml | 1.80 (1.56; 2.37) | 2.32 (1.68; 3.59) | 0.1 |
PAI‑1, ng/ml | 1.54 (1.01; 2.35) | 1.64 (0.74; 1.84) | 0.4 |
sTM, ng/ml | 16.4 (12.8; 17.6) | 19.1 (14.2; 20.3) | 0.04 |
SDF‑1α, pg/ml | 2894 (2666; 3155) | 3001 (2643; 3314) | 0.7 |
Ca × Pi, mmol2/l2 | 2.98 (2.91; 3.25) | 3.69 (2.97; 4.24) | 0.01 |
iPTH, pg/ml | 306 (204; 457) | 249 (153; 453) | 0.5 |
FGF‑23, RU/ml | 487 (398; 877) | 1095 (523; 5066) | 0.03 |
Osteopontin, ng/ml | 217 (207; 320) | 357 (270; 588) | 0.03 |
Osteoprotegerin, pmol/l | 5.12 (2.81; 6.96) | 8.23 (4.36; 12.66) | 0.09 |
Osteocalcin, mg/ml | 41.7 (27.1; 54.1) | 42.0 (25.6; 79.5) | 0.4 |
SPARC, ng/ml | 108 (74; 159) | 102 (74; 178) | 0.8 |
MMP‑2 ng/ml | 214 (191; 270) | 249 (191; 325) | 0.4 |
FRAP, mmol/l | 1.04 (0.64; 1.31) | 0.75 (0.54; 0.90) | 0.1 |
FRASC, μmol/l | 49.0 (36.2; 57.3) | 50.2 (43.8; 58.8) | 0.5 |
DPPH, % | 39.8 (35.0; 48.0) | 40.3 (34.2; 55.1) | 0.8 |
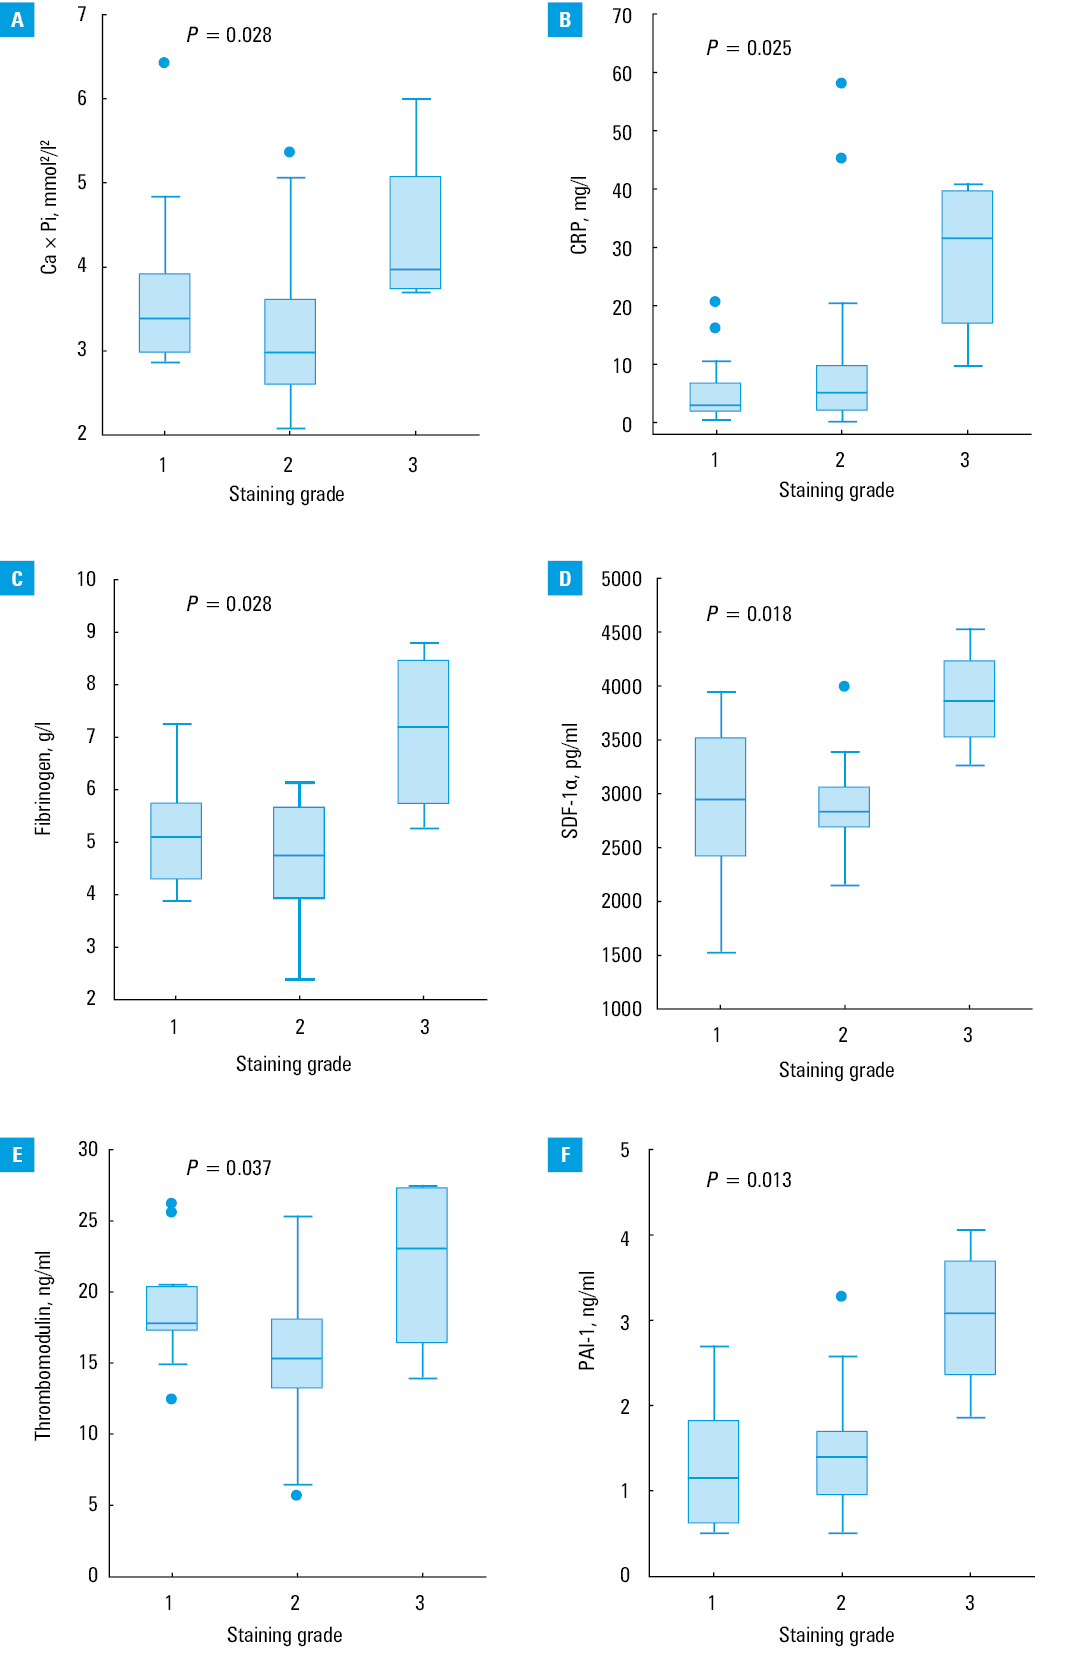
Grade 3 alcian blue staining was significantly associated with higher levels of Ca × Pi product, hs‑CRP, fibrinogen, SDF‑1α, PAI‑1, and sTM (Figure 2), while PAI‑1 was the only significant predictor of grade 3 alcian blue staining in the multiple logistic regression model adjusted for HD status, Ca × Pi product, and hs‑CRP levels (odds ratio, 10.3; 95% CI, 1.08–99.9; P = 0.04). No significant correlations were observed for sirius red staining. In our previous research,6,23 we reported a positive correlation for SDF‑1α and sTM with grades 1 to 3 of alizarin red staining (P = 0.002 and P = 0.028, respectively) in an analysis that excluded patients with grade 0 and 4 of staining. However, patients with grade 4 staining showed relatively low concentrations of both markers. We did not observe other associations between the grade of alizarin red staining and the concentrations of the studied laboratory markers.
Association of histological staining intensity with comorbidities and medical treatment
We observed a correlation between the intensity of histological staining and diabetes. Grade 3 alcian blue staining was more often observed in patients with diabetes than in those without (75% vs 21%; P = 0.04). Also calcifications detected by alizarin red (staining grade 1 to 4) were more common in patients with diabetes than in nondiabetic patients (44% vs 4.5%; P = 0.002). No such correlation was observed in the case of sirius red staining for collagen. The intensity of alcian blue, sirius, and alizarin red staining was not correlated with dialysis, smoking status, dyslipidemia, or obesity. No significant associations were observed between the use of medications and the results of alcian blue, sirius red, and alizarin red staining of the radial artery samples (Supplementary material, Table S1). The use of statins was associated with higher fibrinogen concentrations (Supplementary material, Figure S1A), while the use of vitamin D was associated with higher concentrations of osteoprotegerin, FGF‑23, and HGF (Supplementary material, Figure S1B–S1D). Moreover, diuretic treatment was associated with the lower levels of osteopontin (P = 0.01), FGF‑23 (P <0.001), and IL‑6 (P = 0.003).
Discussion
In this study, we reported a significant association between the Ca × Pi product, hs‑CRP, fibrinogen, SDF‑1α, sTM, and PAI‑1 levels and high‑grade alcian blue staining for matrix PGs and GAGs. These correlations with several established and emerging biomarkers involved in CKD and CV diseases may suggest their involvement in early changes of the ECM and vascular wall structure. PAI‑1 was the only significant predictor of grade 3 alcian blue staining in the multiple logistic regression model adjusted for dialysis status, Ca × Pi product, and hs‑CRP levels. Increased PAI‑1 levels have previously been identified in severe atherosclerotic lesions and have been reported to promote thrombosis.24,25 However, the association of PAI‑1 levels with CKD vasculopathy and medial calcification has not been extensively studied. In an experimental model of arterial injury in atherosclerosis‑prone, hyperlipidemic mice, PAI‑1 knockdown was shown to reduce neointimal formation and improve clearance of mural thrombi.26 Hertig et al27 showed that PAI‑1 deficiency leads to uncontrolled activation of TGF-β, resulting in early glomerular injury in a murine model. However, other authors reported that TGF-β elevates PAI‑1 expression, while PAI‑1 knockdown was associated with decreased ECM deposition.28 It seems that renovascular homeostasis requires an adequate balance of fibrinolysis, which may be impaired by excessive or reduced PAI‑1 levels. PAI‑1 is thought to inhibit the modification of plasminogen and pro‑MMP to active forms, preventing the proteolysis of ECM.29 Interestingly, Krag et al28 observed that decreased ECM deposits following PAI‑1 knockdown were not associated with altered protease activity, which may be caused by the difficulty in investigating the local microenvironment. In the context of our findings, PAI‑1 may serve as a marker of the accumulation of vascular PGs and GAGs, owing to its alleged role in regulating matrix remodeling, which may occur independent of uremia, inflammation, and calcium imbalance. Correlations with markers of inflammation, endothelial injury, and coagulation may also reflect the detrimental effects of these processes in ESRD rather than a shared pathomechanism.
Abundant GAGs in the ECM of renal arteries have been described in ESRD, and the topographical proximity of intimal PGs and collagen was suggested to imply their close interaction.30 In a rabbit model of arterial injury and healthy controls, Strauss et al31 reported that significant early vascular changes resulted in a several‑fold increase in ECM levels of PGs, elastin, and collagen, while intimal and medial proliferation was only modest. The PG components of the ECM are involved in vascular cell migration and vascular wall remodeling through retention and interaction with chemokines, growth factors, and modified collagen.2 The present study demonstrated that matrix GAGs and PGs are positively correlated with collagen deposits and medial calcifications. Moreover, high PG levels were reported in early vascular lesions, which coincided with reduced collagen fibers.1 Similarly, we observed that an increase in the grade of alcian blue staining was significantly associated with a higher grade of Sirius red staining for collagen. Positive staining with alcian blue may facilitate the identification of early vascular lesions in patients with CKD.
In the present study, the majority of radial artery specimens showed low to moderate grades of staining for matrix PGs and collagen. Overall, calcifications were less advanced and present only in the media. Similarly, Ballanti et al32 observed that less advanced medial calcifications are most prevalent in kidney transplant recipients without diabetes, which emphasizes the significance of kidney disease itself. However, we observed increased radial artery calcification in patients with a higher content of PGs and GAGs as well as collagen. In a rabbit model of renal failure lasting 9 months, increased PGs and calcifications were predominant in the media, while intimal lesions were limited to increased cellularity. Calcifications were accompanied by the accumulation of extracellular substance stained with alcian blue and of smooth muscle–like cells, with no evidence of inflammation or lipid retention.33 Subsequent studies demonstrated that increased alcianophilic extracellular substance was one of the earliest vascular changes in chronic renal failure models.34 Together, these findings suggest that changes in the ECM can be useful in the monitoring of early vascular remodeling in ESRD, when the processes of inflammation and dyslipidemia are still subclinical.
In this study, we investigated whether increased PG and GAG content in the vascular wall, as evidenced by the highest grade of alcian blue staining, is correlated with selected clinical data, comorbidities, and biomarkers of endothelial dysfunction, inflammation, oxidative stress, and bone turnover. It was hypothesized that systemic inflammation in CKD, uremic toxins, elevated phosphate and glucose levels, and imbalance of calcification inhibitors are involved in the pathogenesis of medial arterial calcification.35 Our results indicated an association between vascular matrix alterations and diabetes but not with dialysis, smoking status, medications, dyslipidemia, and obesity. In a study comparing patients with and without diabetes undergoing HD, calcifications were reported more frequently in patients with diabetes and were linked to poor glycemic control.36 Our findings support the association of PG and GAG accumulation as well as medial arterial calcification with diabetes in ESRD, which may indicate shared and synergistic stimuli of injury. Indeed, Klein et al37 showed that long‑term exposure to high glucose levels increases PG synthesis. Glycosaminoglycans in the arterial media are also altered throughout the course of diabetes, but the process differs from that observed in atherosclerosis.38 However, the consequences of PG and GAG alterations in the vascular wall have not yet been fully elucidated. Disruption in the balance of versican and hyaluronan leads to impaired mechanical function and structural pro‑proliferative changes to the intima.39 High glucose levels can alter perlecan and increase the number of monocytes in the subendothelial matrix.40 More recent studies have shown GAGs to be involved in aortic calcification,41 which is linked to bone morphogenetic protein‑2 signaling in conditions of high Pi accumulation. In light of these findings, we postulate that a shift in the balance of matrix PGs and GAGs may contribute to diabetic vascular complications in patients with ESRD.
This study provides evidence for a link between increased PG and GAG content in the vascular wall and medial calcifications. This adds to our earlier report on the association between medial arterial calcification and SDF‑1 and sTM levels.6,23 The levels of SDF‑1 and sTM were also shown to be positively correlated with matrix alterations (high grade of alcian blue staining). Thrombomodulin is a PG lining the endothelial surface. It has a potent anticoagulation activity, shed into a soluble form in ESRD.42,43 In patients on HD, elevated sTM levels were reported to reflect improved endothelial injury after kidney transplant.44 Widely prevalent and recurrent endothelial injury may lead to mobilization of endothelial progenitor cells from bone marrow, thus rebuilding the damaged vascular barrier in ESRD.45,46 Importantly, this response seems to be severely impaired in CKD. SDF‑1, together with other angiogenic factors, has been implicated in the migration of endothelial progenitor cells.46 On the basis of correlations shown in our study, we postulate that matrix alterations may occur following chronic endothelial injury, inflammation, and altered mineral imbalance, and as such may constitute one of the processes leading to vascular disease. Our findings are unique and may translate into clinical practice. Our preliminarily findings provide evidence for the usefulness of alcian blue staining, with fibrinogen, PAI‑1, sTM, and SDF‑1α as predictors. They may warrant further longitudinal studies with hard outcomes not only in ESRD but also in other related vascular conditions.
Although predialysis and HD patients differed in terms of medication use, none of the medications were associated with staining for PG and GAG, collagen, or calcifications. However, we observed several correlations between medical treatment and some of the biomarkers studied, but the analysis of these correlations is outside the scope of this paper.
Limitations
An inherent limitation of the present study is its cross‑sectional design. Causality cannot be determined in this exploratory study by comparison with literature and statistical analysis alone. Moreover, we discussed the possible relationships between biomarkers that may be only indicators of coexistent processes in patients with renal failure, without any direct mechanistic link. Also, our morphological analysis can appear crude when considering the complexity of alterations in local vascular microenvironments. Despite these limitations, our study constitutes a unique attempt to translate experimental research on ECM turnover and CKD biomarkers into inpatient clinical setting of ESRD. The cost‑efficiency of imaging diagnostic procedures, such as the measurement of coronary artery calcification score, might be limited by financial constraints. Nonetheless, our study provides the basis for developing a validated panel of markers of CV risk in patients with CKD.
Conclusions
Our study showed that SDF‑1α, PAI‑1, sTM, and fibrinogen may be novel risk markers of early changes in the arterial wall. They may be involved in the very early processes of vascular remodeling and calcification in patients with advanced kidney disease and can be used as simple markers of CV risk in daily clinical practice.
- Wight TN. A role for proteoglycans in vascular disease. Matrix Biol. 2018; 71‑72: 396‑420. | Crossref
- Ponticos M, Smith BD. Extracellular matrix synthesis in vascular disease: hypertension, and atherosclerosis. J Biomed Res. 2014; 28: 25‑39.
- Toussaint ND. Extracellular matrix calcification in chronic kidney disease. Curr Opin Nephrol Hypertens. 2011; 20: 360‑368. | Crossref
- Bazyluk A, Malyszko J, Zbroch E. Cardiovascular risk in chronic kidney disease: what is new in the pathogenesis and treatment? Postgrad Med. 2018; 130: 46‑469. | Crossref
- Krzanowski M, Krzanowska K, Gajda M, et al. Pentraxin 3 as a new indicator of cardiovascular‑related death in patients with advanced chronic kidney disease? Pol Arch Intern Med. 2017; 127: 170‑177. | Crossref
SUPPLEMENTARY MATERIAL
ARTICLE INFORMATION