Chronic kidney disease is associated with increased levels of renalase in serum and decreased in erythrocytes
Key words: chronic kidney disease, erythrocytes, renalase


 CC BY-NC-SA 4.0
Chronic kidney disease is associated with increased levels of renalase in serum and decreased in erythrocytes
Introduction: Renalase is a novel flavin adenine dinucleotide–dependent amine oxidase with catecholamine‑degrading activity. The kidneys are the main source of this enzyme.
Objectives: In this study, we examined the concentrations of renalase in the serum, urine, and erythrocytes of patients with chronic kidney disease (CKD).
Patients and methods: We enrolled 155 white patients with CKD and 30 healthy controls. Renalase concentrations were measured using an enzyme‑linked immunosorbent assay.
Results: Serum renalase levels were higher in patients with CKD than in controls: median (Q1–Q3), 103 ng/ml (55.6–166 ng/ml) vs 17.7 ng/ml (16.3–21.8 ng/ml); P <0.001. Renalase levels in erythrocytes were lower in patients with CKD than in controls (median [Q1–Q3], 122 ng/ml [67.2–189 ng/ml] vs 254 ng/ml [166–293 ng/ml]; P <0.001). Urinary renalase levels did not differ between patients with CKD and controls (median [Q1–Q3], 147 ng/ml [102–193 ng/ml] vs 144 ng/ml [116–170 ng/ml]; P = 0.78). Urinary and erythrocyte renalase concentrations were negatively correlated with estimated glomerular filtration rate (eGFR). A multivariate general linear model analysis adjusted for age, sex, and eGFR of CKD patients showed that higher plasma dopamine and total protein concentrations were independent predictors of higher serum renalase levels (β = 0.32, P <0.001 and β = 0.25, P <0.001, respectively).
Conclusions: Our results indicate that serum renalase concentrations are elevated in patients with CKD, whereas renalase concentrations in urine and erythrocytes are correlated with impaired kidney function.
What's new?
Renalase is a novel flavin adenine dinucleotide–dependent amine oxidase that is regarded as a growth factor responsible for tubular cell survival. In this study, we examined the concentrations of renalase in the serum, urine, and erythrocytes of patients with chronic kidney disease.
Introduction Chronic kidney disease (CKD) is a major risk factor for cardiovascular disease; therefore, there is an ongoing search for mediators associated with CKD.1,2 Renalase is a novel flavin adenine dinucleotide–dependent amine oxidase, which was identified in 2005 by Xu et al.3 It should be regarded primarily as a growth factor responsible for tubular cell survival; however, some studies suggested that renalase also shows catecholamine‑degrading enzyme activity.3,4 Moreover, renalase has renoprotective and antiapoptotic properties. Its bloodstream secretion is triggered by the activation of dopamine type 5 receptors.5 The enzyme is produced mainly by the kidneys but also by the liver, skeletal muscles, and cardiomyocytes. Its expression has also been detected in the central and peripheral nervous system, endothelium, and adipose tissue.4 Finally, renalase shows monoamine oxidase activity, and it plays a significant role in the regulation of adrenergic nervous system tone and blood pressure.6,7
The human renalase gene is located on chromosome 10 and encodes 7 isoforms, which show tissue specificity. The major isoform of renalase (H‑renalase 1) contains 342 amino acids.8 The expression of this isoform has been detected in the kidneys, especially in renal tubules, glomeruli, podocytes, as well as mesangial and epithelial cells, but also in other cells, such as cardiomyocytes, hepatocytes, and myocytes.9 The secretion of renalase is regulated by catecholamines, which activate the conversion of prorenalase to renalase.10
Previous studies have investigated the activity of renalase in patients with CKD, but the results are conflicting. Some studies indicated decreased plasma levels of renalase in patients with CKD, while others suggested that these patients have elevated plasma renalase levels.3,11-14 These studies also suggest that renal function affects renalase levels in serum. In our study, we examined the concentrations of renalase in the serum, urine, and erythrocytes of patients with CKD.
Patients and methods
This case‑control study enrolled 155 consecutive white patients (mean [SD] age, 58.9 [16.9] years) with CKD, treated at the Clinical Department of Nephrology, Transplantology and Internal Diseases of Pomeranian Medical University in Szczecin, Poland. None of the patients received renal replacement therapy. The causes of CKD were glomerular kidney diseases (50 patients), diabetes mellitus (29 patients), arterial hypertension (14 patients), polycystic kidney disease (13 patients), congenital disorders (5 patients), and other (44 patients). According to estimated glomerular filtration rate (eGFR; calculated using the Chronic Kidney Disease‑Epidemiology Collaboration [CKD‑EPI] equation), there were 34 patients with stage I CKD (≥90 ml/min/1.73 m2); 35 patients with stage II (≥60 and <90 ml/min/1.73 m2); 44 patients with stage III (≥30 and <60 ml/min/1.73 m2); 33 patients with stage IV (≥15 and <30 ml/min/1.73 m2); and 9 patients with stage V (<15 ml/min/1.73 m2). The exclusion criteria were chronic inflammatory diseases (eg, systemic lupus erythematosus, rheumatoid arthritis).
The control group included 30 healthy individuals (mean [SD] age, 57.4 [18.5] years) with normal kidney function (normal eGFR and serum creatinine concentrations). The exclusion criteria for the control group were as follows: age under 18 years, eGFR lower than 60 ml/min/1.73 m2, and chronic inflammatory diseases.
Patients were recruited in accordance with the principles of the Declaration of Helsinki, and the study was approved by the ethics committee of Pomeranian Medical University (KB‑0012/122/14). All patients provided written informed consent to participate in the study.
Serum samples were obtained from venous blood collected in the morning using S‑Monovette tubes (Sarstedt, Nümbrecht, Germany) with a clotting activator. Whole blood was centrifuged (10 min, 1000 × g), and the serum was removed and frozen until use. Morning urine samples were obtained, centrifuged, and frozen until use.
Erythrocyte lysates were obtained by centrifugation of whole blood drawn into K3EDTA S‑Monovette tubes (Sarstedt), followed by separation of erythrocytes from plasma by centrifugation (10 min, 1000 × g) and 3 rinses of erythrocytes with saline (0.9%). Each step was followed by centrifugation as described above and removal of the upper (saline) fraction. Tubes with erythrocytes were then frozen at a temperature of –80°C until use. After thawing, lysates were diluted 1:3 (4 × ) with distilled water for total lysis. The dilution factor was included in both the measurement of hemoglobin levels, assessed using the Drabkin’s reagent, and of renalase levels in erythrocytes. Plasma samples obtained at the beginning of the isolation were frozen until use.
The concentrations of renalase in serum, urine, and erythrocytes were measured using an enzyme‑linked immunosorbent assay (ELISA) kit specific for human renalase (WuHan EIAab, Wuhan, China). Basic biochemical parameters were measured using commercially available reagent kits (BioMaxima, Lublin, Poland). Plasma and urinary concentrations of adrenaline, noradrenaline, and dopamine were measured using ELISA kits (LDN Labor Diagnostika Nord GmbH & Co. KG, Germany): adrenaline and noradrenaline with 2‑CAT Plasma ELISA High Sensitive, while dopamine with Dopamine ELISA Fast Track. Urinary levels of catecholamines were measured using 3‑CAT Urine ELISA Fast Track.
Statistical analysis
Data were analyzed using the Statistica 12.5 software (StatSoft, Tulsa, Oklahoma, United States). Quantitative data were presented as mean (SD) and median (lower quartile [Q1] and upper quartile [Q3]).The assumption of normality was verified using the Shapiro–Wilk test, which showed a significant deviation from normality for the majority of quantitative variables. Therefore, the nonparametric Mann–Whitney test was used to compare results between groups. Correlations between selected quantitative parameters were investigated using the Spearman rank correlation coefficient. The general linear model (GLM) was used to identify independent predictors of renalase concentrations, and the strength of association was presented as a standardized β coefficient. Distributions of variables were normalized by logarithmic transformation before inclusion into the GLM where required (this procedure proved necessary and was applied for serum, erythrocyte, and urinary renalase levels as well as plasma dopamine concentrations). A P value of less than 0.05 without correction for multiple comparisons was considered significant.
Results.
The baseline characteristics of patients are presented in Tables 1 and 2. Median serum renalase levels were significantly higher in patients with CKD than in controls. The concentrations of renalase in erythrocytes were significantly lower in patients with CKD compared with the control group. Additionally, renalase concentrations calculated per gram of hemoglobin were significantly lower in patients with CKD than in controls. Urinary renalase concentrations did not differ significantly between groups. Detailed data are presented in Table 3. The group of patients with CKD included a subgroup of 29 patients (19%) with diabetic nephropathy, but because their serum, erythrocyte, and urinary renalase concentrations did not differ significantly from those of nondiabetic patients, they were not excluded from the analyses. Similarly, no associations were found between renalase concentrations and other causes of CKD.
Parameter | Controls (n = 30) | CKD (n = 155) | P valuea | ||
Mean (SD) | Median (Q1–Q3) | Mean (SD) | Median (Q1–Q3) | ||
a Patients with CKD vs controls; Mann–Whitney test
Abbreviations: CKD, chronic kidney disease; eGFR, estimated glomerular filtration rate; Hb, hemoglobin; MCHC, mean corpuscular hemoglobin concentration; Q1, lower quartile; Q3, upper quartile; RBC, red blood cell count | |||||
Age, y | 57.4 (18.5) | 54.5 (45.0–72.0) | 58.9 (16.9) | 63.0 (48.0–71.0) | 0.41 |
Hb, mmol/l | 7.9 (0.6) | 7.95 (7.30–8.40) | 8.5 (1.3) | 8.40 (7.70–9.30) | 0.002 |
RBC, T/l | 4.8 (0.4) | 4.84 (4.50–5.21) | 4.7 (0.7) | 4.74 (4.25–5.13) | 0.2 |
MCHC, mmol/l | 19.5 (0.6) | 19.5 (18.9–19.9) | 20.0 (0.7) | 20.0 (19.8–20.3) | <0.001 |
Serum glucose, mg/dl | 86.7 (7.2) | 87.0 (81.0–92.0) | 96.4 (33.4) | 87.2 (79.4–95.7) | 0.59 |
Serum total protein, g/dl | 7.4 (0.4) | 7.45 (7.30–7.80) | 6.5 (0.8) | 6.48 (5.96–6.93) | <0.001 |
Serum albumin, g/dl | 3.7 (0.2) | 3.75 (3.60–3.80) | 4.1 (0.5) | 4.07 (3.82–4.34) | <0.001 |
Serum uric acid, mg/dl | 5.5 (0.6) | 5.55 (5.00–6.00) | 7.4 (2.0) | 7.20 (6.04–8.48) | <0.001 |
Serum creatinine, mg/dl | 0.8 (0.1) | 0.82 (0.74–0.94) | 1.6 (1.0) | 1.28 (0.82–2.02) | <0.001 |
eGFR, ml/min/1.73 m2 | 89.5 (15.1) | 92.1 (78.8–101) | 59.5 (34.1) | 49.4 (28.3–87.0) | <0.001 |
Parameter | Controls (n = 30) | CKD (n = 155) | P valuea | |
Data are presented as number (percentage).
a Patients with CKD vs controls; χ2 test
Abbreviations: see Table 1 | ||||
Male sex | 15 (50) | 81 (52) | 0.28 | |
Arterial hypertension | 9 (30) | 123 (79) | <0.001 | |
eGFR, ml/min/1.73 m2 | ≥90 | 18 (60) | 34 (22) | <0.001 |
<90 and ≥60 | 11 (37) | 35 (23) | 0.1 | |
<60 | 1 (3) | 86 (55) | <0.001 | |
Parameter | Controls (n = 30) | CKD (n = 155) | P valuea | ||
Mean (SD) | Median (Q1–Q3) | Mean (SD) | Median (Q1–Q3) | ||
a Mann–Whitney test
b Renalase concentrations calculated per Hb concentration (ng of renalase/1 g Hb in lysates)
Abbreviations: see Table 1 | |||||
Plasma adrenaline, pg/ml | 30.4 (33.9) | 17.7 (10.5–39.3) | 43.0 (22.7) | 36.4 (26.6–52.0) | <0.001 |
Plasma noradrenaline, pg/ml | 399.1 (319.0) | 275 (197–604) | 558.7 (358.7) | 480 (322–694) | 0.007 |
Plasma dopamine, pg/ml | 440.9 (343.2) | 313 (215–638) | 119.2 (62.5) | 111 (91.5–134) | <0.001 |
Urinary adrenaline, ng/ml | 10.8 (9.6) | 7.84 (3.11–18.1) | 10.1 (10.4) | 7.38 (2.93–14.7) | 0.60 |
Urinary noradrenaline, ng/ml | 33.1 (50.9) | 19.2 (5.07–40.9) | 39.5 (67.7) | 20.0 (8.27–48.8) | 0.66 |
Urinary dopamine, ng/ml | 155.6 (148.6) | 121 (88.7–167) | 190.3 (144.9) | 169 (102–231) | 0.048 |
Serum renalase, ng/ml | 19.6 (5.0) | 17.7 (16.3–21.8) | 143.1 (194.9) | 103 (55.6–166) | <0.001 |
Renalase in erythrocytes, ng/ml | 233.2 (83.1) | 254 (166–293) | 143.2 (104.1) | 122 (67.2–189) | <0.001 |
Renalase Hbb, ng/1 g Hb | 697.6 (273.4) | 707 (485–857) | 464.0 (382.4) | 357 (209–582) | <0.001 |
Urinary renalase, ng/ml | 141.6 (41.3) | 144 (116–170) | 171.9 (116.6) | 147 (102–193) | 0.78 |
Plasma concentrations of adrenaline and noradrenaline in CKD patients were significantly higher than those in the control group, whereas the concentrations of dopamine were significantly lower. There were no significant differences in urinary concentrations of adrenaline and noradrenaline, whereas dopamine concentrations were significantly higher in CKD patients than in controls (Table 3).
A comparison of renalase concentrations between patients stratified according to their CKD stage and controls is presented in Table 4. Serum renalase concentrations were significantly increased in CKD stages 1–5 in comparison with controls, renalase concentrations in erythrocytes were significantly lower in CKD stages 1–4, whereas there were no significant differences between urinary renalase concentrations in CKD stages 1–5 and controls.
Parameter | Controls (n = 30) | CKD stage 1 (n = 34) | CKD stage 2 (n = 35) | CKD stage 3 (n = 44) | CKD stage 4 (n = 33) | CKD stage 5 (n = 9) | P valuea | ||||
CKD stage 1 vs controls | CKD stage 2 vs controls | CKD stage 3 vs controls | CKD stage 4 vs controls | CKD stage 5 vs controls | |||||||
Data are presented as mean (SD) and median (Q1–Q3).
a Mann–Whitney test
b Renalase concentrations calculated per Hb concentration (ng of renalase/1 g Hb in lysates)
Abbreviations: see Table 1 | |||||||||||
Serum renalase, ng/ml | 19.6 (5.0), 17.7 (16.3–21.8) | 122.1 (87.6), 105 (61.3–145) | 113.5 (76.8), 88.8 (55.9–167) | 182.5 (324.4), 113 (67.1–132) | 144.2 (138.6), 78.9 (47.3–183) | 141.1 (135.0), 101 (64.3–179) | <0.001 | <0.001 | <0.001 | <0.001 | <0.001 |
Renalase in erythrocytes, ng/ml | 233.2 (83.1), 254 (166–293) | 99.2 (73.3), 70.7 (54.1–125) | 112.1 (68.6), 107 (60.1–139) | 167.8 (119.4), 144 (92.5–209) | 166.1 (101.0), 135 (107–215) | 226.0 (152.8), 248 (103–308) | <0.001 | <0.001 | <0.001 | 0.004 | 0.84 |
Renalase Hbb, ng/1 g Hb | 697.6 (273.4), 707 (485–857) | 294.8 (218.0), 219 (151–363) | 351.5 (216.4), 324 (179–451) | 527.2 (358.4), 470 (291–655) | 569.3 (429.5), 446 (324–653) | 845.0 (764.2), 654 (320–1145) | <0.001 | <0.001 | 0.004 | 0.02 | 0.89 |
Urinary renalase, ng/ml | 141.6 (41.3), 144 (116–170) | 141.0 (54.1), 148 (102–178) | 146.3 (97.2), 127 (76.3–194) | 182.4 (132.1), 150 (98.7–190) | 221.6 (158.4), 167 (110–293) | 162.0 (36.8), 157 (146–164) | 0.91 | 0.37 | 0.85 | 0.15 | 0.29 |
There were no significant associations between renalase levels and the causes of CKD. Patients with CKD presented the whole spectrum of CKD stages from 1 to 5. Therefore, instead of comparing the study parameters between all these stages, we decided to assess the correlations of the parameters with eGFR values (calculated with the CKD‑EPI equation), which are the basis for CKD staging. We analyzed the correlations of renalase concentrations in serum, erythrocytes, and urine as well as renalase concentrations calculated per gram of hemoglobin with plasma and urinary concentrations of adrenaline, noradrenaline, and dopamine, serum levels of total protein and albumin, and eGFR (Table 5).
Parameter | Serum renalase | Renalase in erythrocytes | Renalase Hba | Urinary renalase | ||||
Rs | P value | Rs | P value | Rs | P value | Rs | P value | |
a Renalase concentrations calculated per Hb concentration (ng of renalase/1g Hb in lysates)
Abbreviations: Rs, Spearman rank correlation coefficient; others, see Table 1 | ||||||||
Plasma adrenaline | 0.21 | 0.01 | –0.03 | 0.68 | –0.01 | 0.93 | 0.04 | 0.60 |
Plasma noradrenaline | 0.02 | 0.80 | 0.20 | 0.01 | 0.23 | 0.004 | 0.03 | 0.72 |
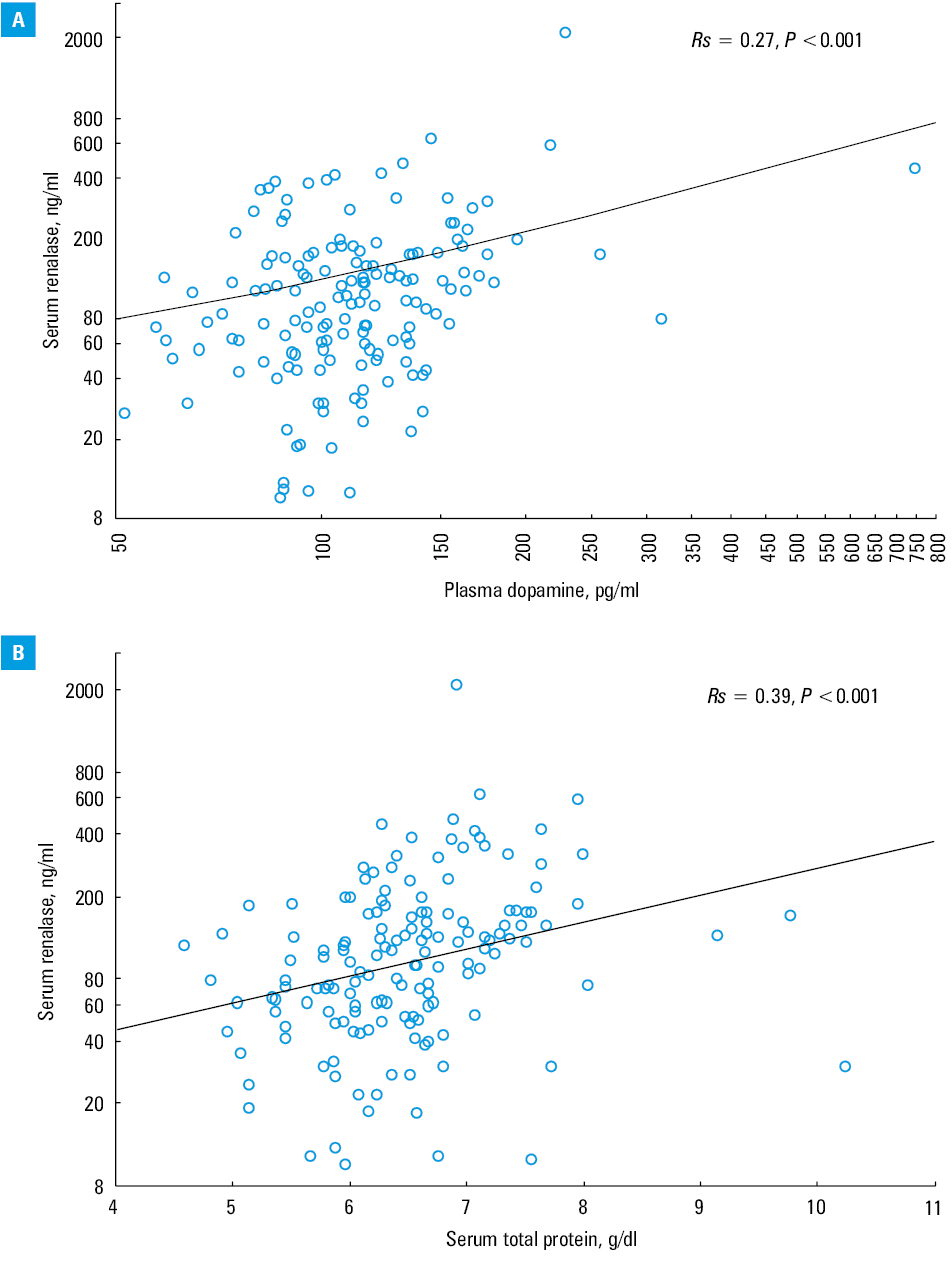
Plasma dopamine | 0.27 | <0.001 | 0.14 | 0.08 | 0.18 | 0.03 | 0.18 | 0.03 |
Urinary adrenaline | 0.20 | 0.01 | –0.15 | 0.07 | –0.12 | 0.15 | 0.02 | 0.80 |
Urinary noradrenaline | 0.32 | <0.001 | –0.12 | 0.13 | –0.08 | 0.34 | –0.02 | 0.83 |
Urinary dopamine | –0.19 | 0.02 | –0.11 | 0.18 | –0.16 | 0.049 | –0.09 | 0.26 |
Serum total protein | 0.39 | <0.001 | 0.04 | 0.65 | 0.07 | 0.37 | –0.08 | 0.33 |
Serum albumin | –0.03 | 0.68 | –0.02 | 0.83 | –0.04 | 0.66 | –0.22 | 0.008 |
eGFR | –0.04 | 0.66 | –0.33 | <0.001 | –0.35 | <0.001 | –0.17 | 0.04 |
Serum renalase levels were positively correlated with plasma concentrations of adrenaline and dopamine (Figure 1A) as well as urinary concentrations of adrenaline and noradrenaline, and with serum total protein levels (Figure 1B). There was a negative correlation between serum renalase and urinary dopamine concentrations. Renalase levels in erythrocytes were positively correlated with plasma noradrenaline and negatively with eGFR (Figure 1C). Renalase concentrations calculated per gram of hemoglobin were positively correlated with plasma noradrenaline and dopamine and negatively with urinary dopamine levels and eGFR. Urinary renalase concentrations were positively correlated with plasma dopamine concentrations and negatively with eGFR and serum albumin levels (Figure 1D).
The multivariate GLM analysis adjusted for age, sex, and eGFR of patients with CKD showed that a higher logarithm of plasma dopamine and higher total protein concentrations were independent predictors associated with a higher logarithm of serum renalase concentrations (β = 0.32, P <0.001 and β = 0.25, P <0.001, respectively). Lower eGFR was the only independent predictor of a higher logarithm of erythrocyte renalase concentrations (β = –0.47, P <0.001), and lower serum albumin levels were the only independent predictor of a higher logarithm of urinary renalase concentrations (β = –0.18, P = 0.04).
Discussion
Our study showed that serum renalase concentrations were significantly higher, while the concentrations in erythrocytes were significantly lower, in patients with CKD compared with controls. Moreover, renalase levels in urine and erythrocytes were positively correlated with serum creatinine levels and negatively with eGFR. We also observed elevated levels of adrenaline and noradrenaline and reduced levels of dopamine in patients with CKD. Our results indicate that serum renalase concentrations are elevated in patients with CKD, while renalase concentrations in urine and erythrocytes are correlated with impaired kidney function.
In our study, renalase concentrations in serum, erythrocytes, and urine were measured using the ELISA kit WuHan EIAab (Wuhan). Previous research conducted by other groups repeatedly indicated that serum renalase levels in renal patients are usually higher than in healthy people, regardless of the type and manufacturer of an ELISA test (which there are a few on the market). Therefore, in our research, we relied on our own knowledge and experience that the immunoenzymatic (ELISA) method used in the evaluation of serum renalase levels seems to be more suitable for such analyses than other methods. The advantage of the immunoenzymatic method is that it is quantitative, unlike Western blot, which is semiquantitative.
The limitation of our study is the lack of detailed knowledge about the potential cross‑reactivity of the ELISA test with other proteins, although according to the manufacturer, no cross‑reactivity was observed with renalase analogues.
Previous studies have indicated that renalase is mainly produced in the kidneys; however, the expression of this enzyme was detected in various other tissues and organs, such as the liver, cardiomyocytes, skeletal muscles, central and peripheral nervous systems, adrenal glands, endothelium, adipose tissue, and intestines.8,9 Renalase is involved in renal and urinary turnover of catecholamines. Several studies have examined renalase in patients with CKD, and the results are conflicting.
Early studies indicated that renalase levels were reduced in patients with CKD, suggesting a correlation between decreased levels of serum renalase and increased catecholamine concentrations. In the study by Xu et al,3 plasma concentrations of renalase were significantly reduced in patients with end‑stage renal disease, as compared with healthy individuals. Moreover, Desir15 suggested that renalase deficiency in CKD is associated with increased levels of catecholamines and contributes to hypertension and cardiovascular diseases.11 Studies on a rat model suggested that nephrectomy was associated with reduced plasma levels of renalase.15
In contrast, Polish investigators indicated increased levels of plasma renalase in patients with CKD, as well as among kidney and heart allograft recipients.12-14,16,17 Moreover, the elevated plasma renalase level in allograft recipients was negatively correlated with kidney function. Renalase concentrations were also associated with age and time after transplantation, systolic and diastolic blood pressure, serum creatinine levels, and eGFR. Elevated plasma renalase levels were also detected in hemodialyzed patients. Increased renalase levels were correlated with impaired renal function. Studies from other centers suggested that serum renalase levels (measured by ELISA) were positively correlated with impaired kidney function.18 Stojanovic et al19 reported that renalase levels were negatively correlated with eGFR and positively with creatinine levels. Baek et al20 indicated that in patients with CKD, renalase was correlated with a higher risk of mortality and adverse renal outcomes.
Unfortunately, the function and properties of renalase remain poorly understood. Some studies suggested positive effects of renalase in CKD, indicating that this enzyme increases cell survival and protects against ischemic kidney injury.6,15 In our study, we detected elevated levels of renalase in the serum of patients with CKD, whereas renalase levels in erythrocytes were lower than those in healthy controls. Previous studies suggested that increased renalase synthesis may correlate with elevated levels of catecholamines.12,21Gu et al22 suggested that the kidney may produce additional renalase to compensate for the metabolism of excess catecholamines. Increased plasma renalase levels observed in patients with CKD may be induced by elevated catecholamine levels and may be the mechanism leading to a reduction in catecholamine levels. Previous studies indicated that the negative correlation between renalase and eGFR may be due to the impaired secretion of renalase; however, it is possible that renalase synthesis is primarily impaired in patients with CKD and increases with disease development. The clinical significance and interpretation of the results is difficult because elevated serum levels of renalase may be related to a compensatory mechanism of renoprotective action of renalase, or reduced levels of renalase may be due to the impaired secretion of renalase, as initially reported by Desir.11 There may be numerous hypotheses explaining the different renalase concentrations in patients with CKD; however, further studies are needed to fully elucidate the role of renalase in this population.
Erythrocytes are morphotic elements that are involved in renalase storage and transport. Renalase in erythrocytes is probably in a state of exchange with plasma. So far, renalase levels in erythrocytes have not been investigated. The decreased renalase levels in the erythrocytes of CKD patients in comparison with healthy controls observed in our study may confirm the hypothesis that the synthesis of renalase in CKD may be primarily reduced due to a decreased release of renalase by the impaired kidney, and elevated plasma renalase levels may reflect the compensatory production of renalase induced by the elevated levels of catecholamines observed in patients with CKD. The decreased renalase levels reported by some investigators are likely due to the selection of patients with early‑stage CKD. Recent studies have suggested that renalase may improve mitochondrial function and reduce oxidative stress, and it may also have an antifibrotic effect on the kidneys.23,24
The results of our study indicate that renalase levels are elevated in the serum and decreased in the erythrocytes of patients with CKD. We hypothesize that increased circulating renalase levels may be a result of the compensatory synthesis of this enzyme induced by elevated levels of catecholamines. Moreover, the synthesis of renalase in CKD is primarily decreased, and this reflects the reduced renalase levels in erythrocytes. Nevertheless, the function and properties of renalase remain poorly understood and require further research.
- Wybraniec MT, Chudek J, Mizia‑Stec K. Association between elevated urinary levels of kidney injury molecule type 1 and adverse cardiovascular events at 12 months in patients with coronary artery disease. Pol Arch Intern Med. 2018; 128: 301‑309.
- Krzanowski M, Krzanowska K, Gajda M, et al. Pentraxin 3 as a new indicator of cardiovascular‑related death in patients with advanced chronic kidney disease. Pol Arch Intern Med. 2017; 127: 170‑177.
- Xu J, Li G, Wang P, et al. Renalase is a novel, soluble monoamine oxidase that regulates cardiac function and blood pressure. J Clin Invest. 2005; 115: 1275‑1280. | Crossref
- Desir GV, Tang L, Wang P, et al. Renalase lowers ambulatory blood pressure by metabolizing circulating adrenaline. J Am Heart Assoc. 2012; 1: e002634. | Crossref
- Wang S, Lu X, Yang J, et al. Regulation of renalase expression by D5 dopamine receptors in rat renal proximal tubule cells. Am J Physiol Renal Physiol. 2014; 306: F588‑F596. | Crossref
ARTICLE INFORMATION