Effect of air pollution on the number of hospital admissions for acute coronary syndrome in elderly patients
Key words: acute coronary syndrome, air pollution, Białystok, particulate matter


 CC BY-NC-SA 4.0
Effect of air pollution on the number of hospital admissions for acute coronary syndrome in elderly patients
Introduction: Air pollution is a documented risk factor for cardiovascular diseases.
Objectives: The aim of the study was to assess the effect of air pollution on the number of hospital admissions for acute coronary syndrome (ACS) in elderly patients.
Patients and methods: The medical records of 26695 patients hospitalized for ACS between 2008 and 2017 were examined. Weather conditions and the following components of air pollution were analyzed: sulfur dioxide, nitrogen dioxide, and particulate matter with a diameter of 2.5 μm or less (PM2.5) and a diameter of 10 μm or less (PM10).
Results: The study included 1618 inhabitants of Białystok in Poland (mean [SD] age, 75 [6.4] years; men, 52.6%). The norm for PM2.5 was exceeded on 23.5% of days, while for PM10, on 5.3% of days. Elevated PM10 levels were associated with a higher number of hospitalizations for ACS on the day of exposure (mean [SD], 0.61 [0.78] vs 0.44 [0.69]; P <0.001), and this effect persisted in the subsequent days (mean [SD], 1.07 [1.07] vs 0.88 [1.00]; P = 0.02). An increase of PM10 concentrations by 10 μg/m3 was associated with an increase in the number of hospitalizations due to unstable angina, and significant effects were observed even after 6 days (rate ratio, 1.16; 95% CI, 1.03–1.32; P = 0.02).
Conclusions: Increased exposure to air pollution, in particular, elevated PM10 levels, is associated with a higher incidence of ACS both on the day of exposure and over the following days.
What's new?
The city of Białystok, known as the capital of the Green Lungs of Poland, is potentially free of air pollution. However, our study reveals that even in the areas with low mean concentrations of air pollution, the number of hospital admissions for acute coronary syndrome (ACS) is affected by fluctuations in the levels of pollutants. Particulate matter with a diameter of 10 μm or less (PM10) is an air pollutant with the strongest relationship with hospital admissions in elderly patients (aged >65 years). On the days when the PM10 concentration exceeds the normal range, a higher number of hospitalizations for ACS is recorded. This effect is noticeable on the day of exposure and persists in the subsequent days. The reduction of pollution sources and the expansion of air quality monitoring networks should become a priority in social and health policy at the local and national levels, also in the areas potentially free of air pollution.
Introduction
In 1974, Marc Lalonde, Canada’s Minister of Health at the time, published a groundbreaking report titled “A new perspective on the health of Canadians,” presenting his studies about concepts in the fields of healthcare. His statement that our health depends in 50% on our lifestyle, 20% on the environment we live in, 20% on our genes, and only 10% on a healthcare system, is one of the current paradigms of public health.1 However, while special attention is still being paid to proper control of medical risk factors and lifestyle changes as prophylactic measures for cardiovascular diseases, environmental factors, such as air quality, are often ignored, although in the light of modern studies, their health impact is indisputable.2-6
Currently, the greatest threat to the health and life of people and the leading cause of death in Poland are cardiovascular diseases. A well‑known risk factor for the development of these diseases is air quality.7 The first incident of mass illness reported due to air pollution was the Meuse Valley fog. The city of Liège in Belgium evolved as a center for chemical industries since the beginning of the industrial revolution. In early December 1930, a very thick fog was observed in this area, which led to respiratory insufficiency among the local residents. Within 3 days, several thousand inhabitants were affected by symptoms and tens of them died. However, the influence of air pollution on human health was put in focus for the first time only in the early 1950s after the Great Smog of London. At the time, 4000 people died from circulatory and respiratory insufficiency between the 5th and 9th of December 1952, while another 8000 people died in the following weeks.8 Since then, the city’s authorities had taken intensive action to reduce air pollution.
Air pollution is caused by a complex mixture of various chemical substances. Some of these components are formed directly as a result of fuel burning, while others derive from photochemical reactions that occur in the air under the influence of ultraviolet radiation. In recent years, the following components of air pollution that are commonly associated with the development of coronary artery disease have gained attention: sulfur dioxide (SO2), nitrogen dioxide (NO2), carbon monoxide (CO), benzo(a)pyrenes, particulate matter (PM) with a diameter of 2.5 µm or less (PM2.5), PM with a diameter of 10 µm or less (PM10), and ultrafine particles (size <0.1 µg). Moreover, a growing body of evidence confirms their harmful effects on human health.5,6,9-15
According to the European Environment Agency, air pollution contributes to the premature death of approximately 500000 citizens of the European Union (EU) every year.16 However, the influence of air pollution on the occurrence of acute coronary syndrome (ACS) has not been thoroughly investigated, especially in the elderly population. Therefore, this study aimed to analyze this relationship using the data recorded in the city of Białystok, Poland. The objective was specifically to assess the effect of air pollution on the number of hospital admissions for ACS in elderly patients.
Patients and methods
The study was conducted at the Clinical Hospital of the Medical University of Bialystok, which was the only center in the city with 24‑hour services available for cases related to invasive cardiology during the entire follow‑up (2008–2017). Based on the medical records, a total of 1618 men and women, aged above 65 years, and hospitalized for ACS were selected for further analysis. All patients lived within the borders of Białystok (an area of 102 km2), with the maximal distance from the measuring station of 6 km. The demographic and clinical data of the patients and their type of ACS were evaluated. Data on mortality that were recorded on November 9, 2018, were obtained from the registry of the Ministry of Digital Affairs.
Patients with ACS were divided into 3 groups based on hospitalization for the following conditions: ST‑segment elevation myocardial infarction (STEMI), non–ST‑segment elevation myocardial infarction (NSTEMI), and unstable angina (UA). The diagnosis of STEMI, NSTEMI, and UA was made by physicians on the basis of symptoms, levels of biochemical markers of myocardial necrosis, and electrocardiographic results.
The exceedance of PM concentrations was determined based on the Directive of the European Parliament 2008/50/EC (May 21, 2008) on ambient air quality and cleaner air for Europe (OJEUL152 of June 11, 2008, p. 1) and Regulation of the Minister of Environment of the Republic of Poland (August 24, 2012).17 Furthermore, the PM concentrations were analyzed in reference to the guidelines of the 2005 World Health Organization (WHO) concerning air quality.18
The EU has limited the concentration levels of PM10 to 50 µg/m3 (24‑hour mean, exceedance permitted for a maximum of 35 times per year) and 40 µg/m3 (annual mean) and those of PM2.5 to 20 µg/m3 (annual mean). However, the 24‑hour and annual mean concentration levels recommended by the WHO for PM10 are 50 µg/m3 and 20 µg/m3, respectively, and for PM2.5, 25 µg/m3 and 10 µg/m3, respectively. The EU limit for the 24‑hour mean concentration level of SO2 is 125 µg/m3, whereas the WHO limit is 20 µg/m3. For NO2, the annual mean concentration level fixed by both the WHO and EU is the same (40 µg/m3). The permitted hourly NO2 standard fixed by the WHO and EU is 200 µg/m3, and that of SO2, 350 µg/m3.
The mean daily and weekly concentrations were determined for all physical components, and the number of 1- and 2‑day hospitalizations due to STEMI, NSTEMI, and UA was obtained from the medical records.
The study protocol was approved by the ethics committee of the Medical University of Bialystok (R‑1‑002/18/2019).
Data collection
The measurements of standardized air quality in Podlaskie Voivodeship were carried out in 5 stationary and 1 mobile measuring stations. The analysis conducted in the present study included fine PM2.5, PM10, SO2, and NO2 as pollutants with a proven effect on the circulatory and respiratory systems. The results of measurements taken from 2 stations of the Voivodeship Inspectorate for Environmental Protection in Bialystok, that is, at ul. Waszyngtona 16 (Environment AF22E—SO2, Teledyne API T200—NO2, MetOne BAM 1020—PM2.5) and Warszawska street (75 TEOM 1405F—PM10), between January 2008 and December 2017 were used in the analysis. Data on daily meteorological factors and the levels of relative humidity, temperature, and atmospheric pressure for the study period were obtained from the Institute of Meteorology and Water Management. Around 1.66% of the observations were missing during the study period, and these data were excluded from the analysis.
Statistical analysis
The distribution of variables was evaluated using the Kolmogorov–Smirnov test. The 2‑tailed Mann–Whitney test and analysis of variance were used for comparative analysis. The Spearman rank correlation test was applied to evaluate the relationships between the levels of air pollution and the number of recorded cardiovascular events. Multivariate Poisson regression with a delay time of 0 to 6 days was used to assess the delayed effect of the particles, the concentration levels of gases, and the weather conditions. To exclude the impact of seasonal variations, the time‑stratified model was used (simple indicator variables). Associations were considered significant at a P value of less than 0.05. All analyses were performed using the Statistica 12 software (StatSoft, 2017, Kraków, Poland).
Results
A total of 1618 patients, aged above 65 years, were eligible for the study. The majority of the study population were male (851, 52.6%), with a mean (SD) age of 75 (6.4) years. Among the patients, 444 (27.4%) were hospitalized for STEMI, 673 (41.6%) for NSTEMI, and 501 (31%) for UA (Table 1).
Parameter | ACS (n = 1618) | STEMI (n = 444) | NSTEMI (n = 673) | UA (n = 501) | P value |
Data are prsented as number (percentage) of patients unless otherwise indicated.
Abbreviations: ACS, acute coronary syndrome; CABG, coronary artery bypass grafting; COPD, chronic obstructive pulmonary disease; MI, myocardial infarction; NSTEMI, non–ST‑segment myocardial infarction; PCI, percutaneous coronary intervention; STEMI, ST‑segment elevation myocardial infarction; UA, unstable angina | |||||
Age, y, mean (SD) | 75.0 (6.4) | 74.5 (6.4) | 75.7 (6.2) | 73.8 (6.6) | <0.001 |
Male sex | 851 (52.6) | 239 (53.8) | 390 (57.9) | 222 (44.3) | <0.001 |
Obesity | 495 (30.6) | 112 (25.2) | 232 (34.5) | 151 (30.1) | 0.004 |
Arterial hypertension | 1304 (80.6) | 315 (70.9) | 560 (83.2) | 429 (85.6) | <0.001 |
Hyperlipidemia | 890 (55) | 230 (51.8) | 372 (55.3) | 288 (57.4) | 0.19 |
Type 2 diabetes mellitus | 447 (27.6) | 98 (22.1) | 175 (26.0) | 174 (34.7) | <0.001 |
Atrial fibrillation | 304 (18.8) | 89 (20.0) | 140 (20.8) | 75 (15) | 0.02 |
COPD | 92 (5.7) | 14 (3.2) | 35 (5.2) | 43 (8.5) | 0.002 |
Lower respiratory tract infections | 159 (9.8) | 49 (10.8) | 94 (14.9) | 17 (3.4) | <0.001 |
Previous PCI | 223 (13.8) | 22 (5) | 98 (14.6) | 103 (20.6) | <0.001 |
Previous CABG | 61 (3.8) | 8 (1.8) | 18 (2.7) | 35 (6.9) | <0.001 |
Previous MI | 261 (16.7) | 70 (15.7) | 101 (15) | 99 (19.7) | 0.61 |
Invasive treatment | 1594 (98.5) | 444 (100) | 657 (97.6) | 493 (98.4) | 0.005 |
In‑hospital mortality | 70 (4.3) | 33 (7.4) | 31 (4.6) | 6 (1.2) | <0.001 |
30‑day mortality | 121 (7.5) | 62 (13.9) | 53 (7.8) | 6 (1.2) | <0.001 |
Hospital admissions due to ACS were not normally distributed. Of all the analyzed days, the days with 1 hospitalization accounted for 26.8%, while those with 2 hospitalizations or more, for 8.2%. The mean daily number of hospitalizations for ACS during the follow‑up was 0.44. The average number of hospitalizations for the fourth quarter of the year (October–December) was 0.48, while it was the lowest (0.38; P <0.001) for the third quarter (July–September). Data are presented in Table 2.
Parameter | ACS (n = 1618) | STEMI (n = 444) | NSTEMI (n = 673) | UA (n = 501) |
Abbreviations: IQR, interquartile range; others, see Table 1 | ||||
Annual statistics | ||||
2008 | 205 | 69 | 65 | 71 |
2009 | 176 | 46 | 75 | 55 |
2010 | 160 | 56 | 62 | 42 |
2011 | 138 | 41 | 55 | 42 |
2012 | 129 | 40 | 53 | 36 |
2013 | 116 | 24 | 58 | 34 |
2014 | 142 | 34 | 62 | 46 |
2015 | 169 | 50 | 73 | 46 |
2016 | 169 | 39 | 71 | 59 |
2017 | 214 | 45 | 99 | 70 |
Total | 1618 | 444 | 673 | 501 |
Daily statistics | ||||
Days with 1 hospitalization, n (%) | 979 (26.8) | 390 (10.7) | 528 (14.5) | 425 (11.6) |
Days with 2 hospitalizations, n (%) | 225 (6.2) | 27 (0.7) | 118 (3.2) | 33 (0.9) |
Days with 3 hospitalizations, n (%) | 47 (1.3) | 0 (0.0) | 27 (0.7) | 2 (0.05) |
Days with 4 hospitalizations, n (%) | 12 (0.3) | 0 (0.0) | 0 (0.0) | 1 (0.02) |
All time, mean, median, (IQR) | 0.44, 0 (1) | 0.12, 0 (0) | 0.18, 0 (0) | 0.14, 0 (0) |
January–March, mean, median (IQR) | 0.46, 0 (1) | 0.13, 0 (0) | 0.18, 0 (0) | 0.15, 0 (0) |
April–June, mean, median (IQR) | 0.45, 0 (1) | 0.13, 0 (0) | 0.18, 0 (0) | 0.14, 0 (0) |
July–September, mean, median (IQR) | 0.38, 0 (1) | 0.09, 0 (0) | 0.17, 0 (0) | 0.12, 0 (0) |
October–December, mean, median (IQR) | 0.48, 0 (1) | 0.14, 0 (0) | 0.20. 0 (0) | 0.13, 0 (0) |
Patients with NSTEMI were the oldest in the study population (mean [SD] age, 75.7 [6.2] years). The subgroup hospitalized due to UA was found to be the most burdened with the risk factors for coronary artery disease such as arterial hypertension, hyperlipidemia, and diabetes mellitus. Every fifth patient in this subgroup had undergone percutaneous coronary intervention in the past, and 35 patients (6.9%) had a history of coronary artery bypass grafting (Table 1).
The total in‑hospital mortality rate was 4.3%. The highest mortality rate was observed in patients hospitalized for STEMI (Table 1).
In the analysis, the mean concentrations of SO2, NO2, PM2.5, and PM10 as well as the levels of humidity, temperature, and atmospheric pressure over 10 consecutive years beginning from 2008 were taken into account. A detailed analysis based on the norms for 2020 established by the EU revealed that no hourly or annual norms of SO2 and NO2 concentrations were exceeded. In the analysis based on the WHO guidelines, SO2 was rarely observed to exceed the 1‑day norm (18 days, 0.49% of the analyzed days; Table 3).
Parameter | NO2, μg/m3 | SO2, μg/m3 | PM2.5, μg/m3 | PM10, μg/m3 | Temperature, °C | Humidity, % | Barometric pressure, hPa |
Abbreviations: EU, European Union, NA, not applicable; ND, no data; NO2, nitrogen dioxide; PM2.5, particulate matter with a diameter of 2.5 μm or less; PM10, particulate matter with a diameter of 10 μm or less; SO2, sulfur dioxide; WHO, World Health Organization | |||||||
2008 annual mean | 14.508 | 2.636 | ND | 23.922 | 8.2 | 81.9 | 997.0 |
2009 annual mean | 14.370 | 1.564 | 18.833 | 25.948 | 7.2 | 83.2 | 996.5 |
2010 annual mean | 15.155 | 3.607 | 23.929 | 27.825 | 6.8 | 81.2 | 995.2 |
2011 annual mean | 16.039 | 3.757 | 20.853 | 27.831 | 7.6 | 83.7 | 998.7 |
2012 annual mean | 14.539 | 3.321 | 22.289 | 27.785 | 7.1 | 82.0 | 996.9 |
2013 annual mean | 14.406 | 3.217 | 19.288 | 22.902 | 7.6 | 79.0 | 997.0 |
2014 annual mean | 13.662 | 4.244 | 21.895 | 24.889 | 8.1 | 77.6 | 998.1 |
2015 annual mean | 14.871 | 4.107 | 21.309 | 25.006 | 8.7 | 79.6 | 998.9 |
2016 annual mean | 13.456 | 3.172 | 17.485 | 19.776 | 8.0 | 81.3 | 997.4 |
2017 annual mean | 13.093 | 3.461 | 17.687 | 21.066 | 7.9 | 78.3 | 996.7 |
Daily minimum | 1.40 | 0.004 | 1.16 | 2.68 | – 29.9 | 38.3 | 959.6 |
Daily maximum | 70.05 | 37.60 | 139.20 | 192.50 | 34.6 | 100 | 1025.5 |
Daily mean, (SD) | 14.398 (6.5) | 3.286 (3.1) | 20.354 (15.1) | 24.531 (15.2) | 7.8 (8.7) | 81.1 (12.0) | 997.3 (8.5) |
Daily median | 13.135 | 2.622 | 15.900 | 21.000 | 7.9 | 82.9 | 997.4 |
Exceeded hours mean | 0 | 0 | NA | NA | NA | NA | NA |
Exceeded daily mean EU 2020 norm, no. of days | NA | 0 | NA | 172 | NA | NA | NA |
Exceeded daily mean WHO guideline, no. of days | NA | 18 | 688 | 172 | NA | NA | NA |
Exceeded annual mean EU 2020 norm, no. of years | 0 | NA | 5 | 0 | NA | NA | NA |
Exceeded annual mean WHO guideline, no. of years | 0 | NA | 9 | 9 | NA | NA | NA |
The highest daily concentration of PM2.5 (139.20 µg/m3; WHO norm exceeded 5‑fold) was noted on February 14, 2012, and of PM10 (192.50 µg/m3; EU and WHO norm exceeded by nearly 4‑fold), on January 6, 2009. According to the analysis based on the WHO guidelines, exceedance of the daily norm for PM2.5 occurred on 688 days (23.5%). The daily norm for PM10 is 50 µg/m3, which is the same both in the EU and WHO guidelines. During the follow‑up, this norm was exceeded on 172 days (5.30%). Data are presented in Table 3.
A very strong positive correlation was found between the concentration of PM2.5 and PM10, and a strong positive correlation was observed between the concentrations of particulates and gases. On the other hand, a moderate negative correlation was found between the values of temperature and the concentration of PM2.5 and PM10 (Table 4).
Parameter | NO2, μg/m3, daily mean (n = 3620) | SO2, μg/m3, daily mean (n = 3597) | PM2.5, μg/m3, daily mean (n = 2929) | PM10, μg/m3, daily mean (n = 3240) | Temperature, °C, daily mean (n = 3653) | Humidity, %, daily mean (n = 3653) | Barometric pressure, hPa, daily mean (n = 3653) |
A P value of less than 0.05 was considered significant.
Abbreviations: see Table 3 | |||||||
NO2, μg/m3, daily mean (n = 3620) | 1 | 0.278 | 0.529 | 0.494 | –0.409 | 0.145 | 0.222 |
SO2, μg/m3, daily mean (n = 3597) | 0.278 | 1 | 0.454 | 0.404 | –0.326 | 0.093 | –0.062 |
PM2.5, μg/m3, daily mean (n = 2929) | 0.529 | 0.454 | 1 | 0.843 | –0.475 | 0.167 | 0.219 |
PM10, μg/m3, daily mean (n = 3240) | 0.494 | 0.404 | 0.843 | 1 | –0.32 | 0.027 | 0.221 |
Temperature, °C, daily mean (n = 3653) | –0.409 | –0.326 | –0.475 | –0.32 | 1 | –0.356 | –0.257 |
Humidity, %, daily mean (n = 3653) | 0.145 | 0.093 | 0.167 | 0.027 | –0.356 | 1 | –0.178 |
Barometric pressure, hPa, daily mean (n = 3653) | 0.222 | –0.062 | 0.219 | 0.221 | –0.257 | –0.178 | 1 |
In the analysis of correlations between the mean daily concentration of PM and gases and the number of hospitalizations due to ACS, a weak positive correlation was noted between the concentration of NO2 and the number of hospitalizations due to UA. A weak positive correlation was also observed between the NO2 concentration and the number of hospitalizations due to ACS, as well as between the PM10 concentration and the number of hospitalizations due to ACS, UA, and STEMI. However, these results were not significant. In addition, a strong negative correlation was found between the values of temperature and the number of hospitalizations due to STEMI (Table 5).
Parameter | ACS, daily number (n = 3653) | UA, daily number (n = 3653) | STEMI, daily number (n = 3653) | NSTEMI, daily number (n = 3653) |
A P value of less than 0.05 was considered significant.
| ||||
NO2, μg/m3, daily mean (n = 3620) | 0.032 | 0.044 | 0.016 | –0.001 |
SO2, μg/m3, daily mean (n = 3597) | –0.001 | –0.014 | 0.022 | –0.008 |
PM2.5, μg/m3, daily mean (n = 2929) | 0.019 | 0.031 | 0.018 | –0.009 |
PM10, μg/m3, daily mean (n = 3240) | 0.026 | 0.027 | 0.026 | 0.001 |
Temperature, °C, daily mean (n = 3653) | –0.026 | –0.030 | –0.05 | –0.011 |
Humidity, %, daily mean (n = 3653) | –0.002 | –0.008 | 0.013 | 0.001 |
Barometric pressure, hPa, daily mean (n = 3653) | –0.021 | –0.02 | 0.01 | –0.022 |
On the days when the norm for the PM10 concentration was exceeded, a higher number of hospitalizations due to ACS was noted in the population of patients over 65 years old (mean [SD], 0.61 [0.78] vs 0.44 [0.69]; P <0.001), and this effect was also noted on the following day (mean [SD], 1.07 [1.07] vs 0.88 [1.00]; P = 0.02). In the analysis of patients hospitalized due to UA, an increase in the number of hospitalizations was observed after the norm for the PM10 concentration was exceeded (0.22 [0.49] vs 0.13 [0.37]; P = 0.002), and this effect was also significant for 2‑day hospitalizations (mean [SD], 0.40 [0.64] vs 0.27 [0.53]; P = 0.002; Table 6). However, no such influence of elevated PM10 concentrations on the number of hospitalizations due to ACS was noted in the case of PM2.5 (Table 6).
Parameter | Days with exceeded daily limit values for PM10 (n = 172) | Days without exceeded daily limit values for PM10 (n = 3068) | P valuea | Days with exceeded daily limit values for PM2.5 (n = 688) | Days without exceeded daily limit values for PM2.5 (n = 2241) | P valueb |
Data are presented as mean, median (interquartile range).
a Days with vs without exceeded daily limit values for PM10
b Days with vs without exceeded daily limit values for PM2.5
| ||||||
ACS | 0.61, 0 (1) | 0.4, 0 (1) | <0.001 | 0.41.0 (1) | 0.45, 0 (1) | 0.18 |
ACS, the next 2 days (48 h) | 1.07, 1 (2) | 0.88. 1 (1) | 0.02 | 0.81, 1 (1) | 0.89, 1 (1) | 0.07 |
UA | 0.22, 0 (0) | 0.13. 0 (0) | 0.002 | 0.14, 0 (0) | 0.13, 0 (0) | 0.55 |
UA, the next 2 days | 0.40, 0 (1) | 0.27, 0 (0) | 0.002 | 0.27, 0 (0) | 0.28, 0 (0) | 0.66 |
STEMI | 0.15, 0 (0) | 0.12, 0 (0) | 0.27 | 0.11, 0 (0) | 0.12, 0 (0) | 0.50 |
STEMI, the next 2 days (48 h) | 0.26, 0 (1) | 0.24, 0 (0) | 0.61 | 0.22, 0 (0) | 0.25, 0 (0) | 0.16 |
NSTEMI | 0.24, 0 (0) | 0.18, 0 (0) | 0.08 | 0.16, 0 (0) | 0.19, 0 (0) | 0.12 |
NSTEMI, the next 2 days (48 h) | 0.41, 0 (1) | 0.37, 0 (1) | 0.42 | 0.32, 0 (1) | 0.37, 0 (1) | 0.07 |
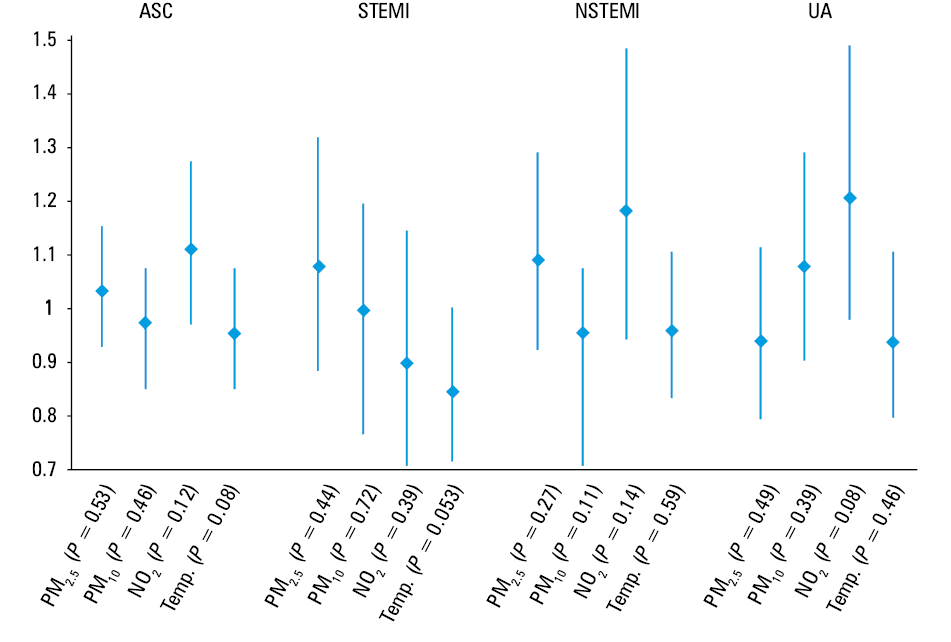
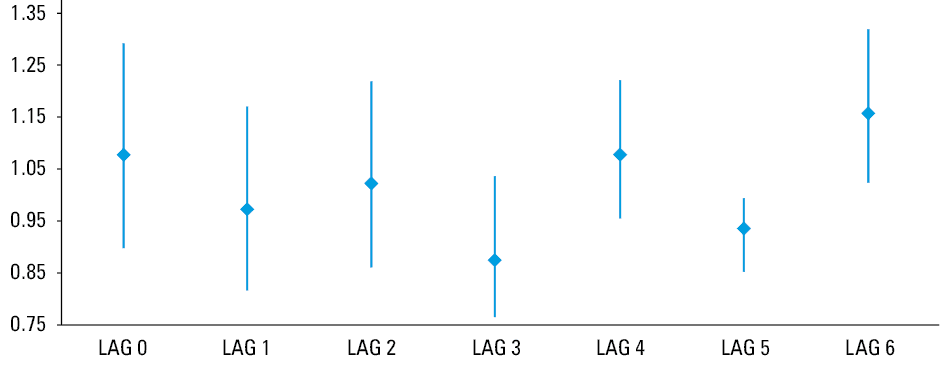
The delayed effect of air pollution for a lag of 0 to 6 days was assessed using Poisson regression. Excluding the season effect, no significant impact on ACS admissions was noted for PM2.5, NO2, and SO2 (Figure 1). For UA, the increase in the PM10 concentration was associated with an increase in the number of hospitalizations on the day of exposure, and this effect also persisted in the following days. The relationship between the increase of PM10 concentrations and the number of hospitalizations was significant on day 6 (rate ratio, 1.16; 95% CI, 1.03–1.32; P = 0.02) (Figure 2).
Discussion
Three independent processes are involved in the pathogenesis of cardiovascular incidents induced by air pollution: generalized inflammatory response, activation of the sympathetic system, and direct impact of the components of air pollution on the circulatory system.2,5,19,20 In the cited studies, an elevated concentration of lymphocytes, mast cells, and inflammatory cytokines in lung tissue and an elevated concentration of leukocytes and thrombocytes in systemic circulation were observed in individuals who were exposed to poor‑quality air. Irritation of nerve endings in lung tissue may lead to the stimulation of the sympathetic nervous system, while an elevated concentration of inflammatory mediators, along with chronic stimulation of the sympathetic nervous system, accelerates the progression of atherosclerotic changes in the arteries, probably including the coronary arteries.14,21 Exposure to air pollution also increases blood coagulability and platelet count. The rise in platelet count occurs after exposure to small particles and also results from the influence of inflammatory mediators released from the lung tissue following exposure to particulates and gases. An increase of fine PM suspended in the air also raises the concentration of fibrinogen, which increases the coagulability and reduces blood fibrynolysis. Due to the mechanisms that are dependent on and independent of the endothelium, high concentrations of air pollutants also lead to vasoconstriction, impairment of capillary function, and an increase in arterial blood pressure.22-24 In addition, studies on human and animal models showed that exposure to air pollution leads to a reduction in the parasympathetic activity, contributing to vasoconstriction, which may impair the coronary blood flow in patients with existing coronary artery disease or the occurrence of ACS through the instability of atherosclerotic plaque.25
Air pollution contributes to the premature death of 45000 Poles every year. According to the European Environment Agency, people who are at the greatest risk of death due to air pollution are the residents of poorer regions and the elderly.16
Białystok is the capital of Podlaskie Voivodeship. In the past, there was a number of textile manufactories, built in the second half of the 19th century. Hence, the city was once even known as Manchester of the North. Currently, there are only a few factories in Białystok, the dominant branch of the city’s economy being commerce and services, and the main sources of air pollution emission are household furnaces and boilers as well as road traffic. This is a consequence of insufficient ecological education provided to people along with poor fuel quality and socioeconomic conditions. Burning landfills is also a significant source of air pollution. This is confirmed by our results, as a strong positive correlation was observed between the NO2 concentration and PM. Oxygen and nitrogen poorly react at low temperature, while they combine much faster to form nitrogen oxides at high temperature. In urban conditions, this process takes place, for example, in furnaces and boilers, as well as during the combustion of fuels in the engine chambers, mainly diesel. Car traffic is also an important source of NO2 pollution, which does not come from fuel combustion and is related to the wear of tires and brake pads.
The highest mean annual concentration of PM2.5 was noted in 2010, whereas the highest concentration of PM10 was observed in 2011. Since that time, a gradual reduction in the average annual concentrations of these particles has been observed. The detailed analysis of annual PM2.5 concentrations revealed that the EU norms were exceeded every 5 years, while the norms included in the WHO guidelines were exceeded every year. Similar to PM2.5, high concentrations were noted for PM10, but no exceedances of the EU norm were observed. However, it is worth noting that the WHO norm, which is twice as low as the EU norm, was exceeded in 9 out of the 10 years covered by the study.
On the days when the norm for PM10 concentration was exceeded, a greater number of hospitalizations for ACS was noted in the population of patients over 65 years old, and this effect persisted on the following day. In the analysis of patients hospitalized due to UA, an increased number of hospitalizations was also noted after the norm for PM10 concentrations was exceeded. The correlation was significant only for UA out of all types of ACS, which may be explained by the fact that patients who had suffered from UA had the highest rate of coronary artery disease burden. Previous studies determined that not only long‑term exposure to air pollution has a negative impact on the respiratory and circulatory systems and enhances the risk of cancer, but also short‑term exposure may increase the prevalence of ACS. In a meta‑analysis by Mustafic et al,26 a significant correlation was found between the rise in the concentration of the most frequently evaluated components of air pollution and the occurrence of myocardial infarction. Numerous subsequent studies conducted in Europe and the United States also confirmed this hypothesis.27-30
Of note, the UA group showed the highest frequency of chronic obstructive pulmonary disease (COPD). Respiratory insufficiency might have worsened myocardial hypoxia in these patients. Moreover, numerous publications have reported a higher risk of ACS following COPD exacerbation.31,32 It was also demonstrated that an increase in PM10 was linked to a greater number of hospitalizations due to COPD exacerbations and pneumonia.33 These findings confirm the influence of air pollution on COPD exacerbation.
The relationship between increased concentrations of PM2.5, NO2, SO2, and CO and the frequency of hospitalizations due to arrhythmia and total mortality was described in a report titled “Short‑term exposure to air pollution and cardiac arrhythmia.”6 An Asian study, AIRCMD‑China, reported that an increase in PM2.5 levels was linked to a higher systolic arterial pressure, deterioration of glucose metabolism, and vascular endothelial function.34 A meta‑analysis by Teng et al6 demonstrated that the effects of exposure to elevated PM2.5 concentrations such as an increased incidence of ACS and higher mortality can be observed for up to 4 days after exposure. An increase in the number of deaths related to elevated PM2.5 concentrations was also noted in an Iranian study, which analyzed the data concerning air quality during 2017 and 2018 in Tehran. The study proved that the number of deaths in the population increased along with an elevation in the PM2.5 concentration in the city.35
A majority of studies26indicate the contribution of PM2.5 to the etiology of ACS. The results of our study also demonstrated the greater contribution of PM10 to ACS, which may be due to the city’s specific environment. Additionally, it should be emphasized that the composition of suspended PM depends on geographic conditions. The absence of industries means that the exceedance of PM2.5 and PM10 norms is mainly due to the burning of solid fuels and road traffic, as shown in this study. The highest daily concentration of PM2.5 (139.20 µg/m3; WHO norm exceeded over 5‑fold) was noted in February 2012, which we can link to the burning of a landfill near Białystok at the time.
Numerous studies also confirmed the effect of PM10 on the frequency of hospitalization for cardiopulmonary conditions, particularly among elderly people. In a meta‑analysis by Bhaskaran et al11, which analyzed the results of 26 studies, a significant adverse effect of both PM2.5 and PM10 was identified. In an American study conducted in the urban areas of Utah, a relationship was observed between the concentrations of PM2.5 and PM10 and the number of hospitalizations for all types of ACS, with the greatest effect noted for STEMI.30 Similar results were obtained in a Belgian study on patients with STEMI, which revealed that an increase in the concentration of PM2.5, PM10, and NO2 alike was linked to an increase in the number of hospitalizations due to STEMI. This effect was mostly found in the group of patients over 75 years old. In a study by Romieu et al36 conducted in South America in 2012, an increased number of hospitalizations was observed for both pulmonary and cardiovascular events related to an increase in PM10 concentrations, particularly in patients aged above 65 years.36
Similar studies on the topic of air pollution in Poland are underway. Preliminary results of the studies by investigators from Silesian Center for Heart Diseases in Zabrze confirmed that during the period when the norms for air pollution were exceeded, the number of cases of myocardial infarction raised by approximately 12%, and the mortality rate of residents, by 6%. An increase in the number of hospitalizations for ACS was also reported in a study by Buszman et al4 conducted in southern Poland. An association between the concentrations of PM2.5 and PM10 together with a decrease in temperature and the number of admissions for ACS was also reported by Konduracka et al37 in Kraków. In our study, the multifactorial Poisson regression analysis also confirmed the above results, and in line with the current knowledge on the effect of temperature on the frequency of hospitalizations due to ACS, the increase in temperature was associated with a decrease in the frequency of ACS.
Although there is a limited number of studies that failed to demonstrate the impact of air pollution on the frequency of cardiac events, the relationship between suspended PM and ACS appears to be unquestionable.12,38
The implementation of effective strategies for the prevention of the adverse effects of air pollution should be a priority for the local and national authorities. In particular, such activities should be specifically oriented towards the groups at the greatest risk, including the elderly, children, and people with a high cardiovascular burden. Besides the standard areas of public health activity, it seems necessary to expand the network of air quality monitoring stations.
Limitations
The effect of smoking was not assessed in the study population, which may be the main limitation of our study. Smoking is the second leading risk factor for myocardial infarction, and the effect of air pollution may also cover the outcomes of smoking.39 Additionally, it has been documented that the history of smoking was associated with greater estimated effects of PM2.5 on the frequency of ACS.30,40
The underdeveloped air pollution monitoring system in the city is also a significant limitation. Air pollution is characterized by high fluctuations in the levels of pollutants in urban areas, which might have affected the results.40
Previous studies demonstrated that the influence of air pollution on ACS may be associated with the destabilization and rupture of atherosclerotic plaques as a result of oxidative stress, inflammation, endothelial dysfunction, and imbalance of the autonomic nervous system. However, further studies are required to understand the mechanism that triggers the rupture of coronary plaque by exposure to air pollution.
Conclusion
Increased exposure to air pollution is linked to a greater number of ACS incidents. The main air pollutant that is associated with ACS in elderly people in the city of Białystok is PM10. The effect of increased concentrations of PM10 was observed on the day of exposure and also persisted in the following days. The reduction of pollution sources and the expansion of air quality monitoring networks should become a priority in social and health policy of the government at the local and national levels.
- Wysocki M, Miller M. Lalonde’s paradigm, WHO and new public health . Przegl Epidemiol. 2003; 505‑512.
- Hajat A, Allison M, Diez‑Roux AV, et al. Long‑term exposure to air pollution and markers of inflammation, coagulation, and endothelial activation: a repeat‑measures analysis in the Multi‑Ethnic Study of Atherosclerosis (MESA). Epidemiology. 2015; 26: 310‑320. | Crossref
- Simoni M, Baldacci S, Maio S, et al. Adverse effects of outdoor pollution in the elderly. J Thorac Dis. 2015; 7: 34‑45.
- Buszman PE, Derbisz K, Kwasiborski P, et al. Impact of air pollution on hospital patients admitted with ST- and non‑ST‑segment elevation myocardial infarction in heavily polluted cities within the European Union. Cardiol J. 2018. .
- Green R, Broadwin R, Malig B, et al. Long- and short‑term exposure to air pollution and inflammatory/hemostatic markers in midlife women. Epidemiology. 2016; 27: 211‑220. | Crossref
ARTICLE INFORMATION