Detecting adrenal insufficiency in patients with immunoglobulin A nephropathy, lupus nephritis, and transplant recipients qualified for glucocorticoid withdrawal
Key words: adrenal insufficiency, cortisol, Cushing syndrome, dehydroepiandro-sterone sulfate, glucocorticoid treatment


 CC BY-NC-SA 4.0
Detecting adrenal insufficiency in patients with immunoglobulin A nephropathy, lupus nephritis, and transplant recipients qualified for glucocorticoid withdrawal
Introduction: Long‑term glucocorticoid (GC) therapy is the most common cause of secondary adrenal insufficiency (AI), which undiagnosed may lead to life‑threatening adrenal crisis.
Objectives: The aim of the study was to evaluate AI in patients treated long‑term with GCs, receiving a low maintenance dose (≤5 mg of prednisone or equivalent), namely, its prevalence and persistence, risk factors, and diagnostic accuracy of morning cortisol and dehydroepiandrosterone sulfate (DHEA‑S) levels.
Patients and methods: Adrenal function was evaluated in 40 patients before and after GC withdrawal and at least 1 year later. Based on morning cortisol levels and short Synacthen test, patients were divided into 3 groups: AI, intermediate (partial AI), and AS (adrenal sufficiency). Receiver operator characteristic curves were calculated to assess the diagnostic value of morning cortisol and DHEA‑S levels before GC withdrawal.
Results: Before GC withdrawal, 42.5% of patients had AI or partial AI, which together persisted in 64.3% of those patients after withdrawal. After more than a year, the adrenal function returned to normal only in 14% of patients. Cushingoid feature occurred more often in the AI group compared with the AS group (60% vs 13%; P = 0.03). Morning cortisol levels of 14.91 μg/dl or higher (411 nmol/l) gave 100% negative predictive value to rule out AI. Morning cortisol of 6.51 μg/dl or less (179.6 nmol/l) gave 100% positive predictive value to rule in AI. DHEA‑S proved to be a worse parameter for AI diagnosis.
Conclusions: AI is common in patients treated with GCs and may persist for years after GC withdrawal. Cushingoid features are associated with a higher risk of AI. Morning cortisol levels may facilitate AI diagnosis.
What's new?
Our study evaluated the adrenal function in patients on long‑term treatment with oral glucocorticoids (GCs) who remained on a low maintenance dose (≤5 mg per day of prednisone or equivalent) for at least 4 weeks. These doses are considered substitution and have not been associated with high risk of adrenal insufficiency (AI) so far. Routine diagnostic workups of AI are not recommended after gradual GC withdrawal. We found that 42.5% of participants had insufficient adrenal function before GC withdrawal and that it can persist even years after gradual withdrawal. Moreover, our results indicate that morning cortisol, which is an easily accessible test, may be helpful to detect AI, rendering the stimulation tests unnecessary. Due to the risk of life‑threatening adrenal crisis and the wide use of GCs, we believe that our findings will draw clinicians’ attention to this issue and will help increase recognition of AI.
Introduction
Secondary adrenal insufficiency (AI) is characterized by suppression of the hypothalamic–pituitary–adrenal (HPA) axis, the most common cause of which is long‑term glucocorticoid (GC) therapy.1,2 GC‑induced AI has been known since the early 1950s3 but it still remains a major diagnostic and therapeutic challenge. Recent studies suggested that the prevalence of AI in patients treated systematically with GCs varies from 14% to 100%.3-10 To date, no guidelines have been proposed for GCs withdrawal schedules to reduce the risk of AI.4 Moreover, the adrenal function is often not evaluated after a gradual withdrawal, which may result in the risk of overlooking AI. Due to the fact that nearly 1% of people in the general population are treated with GCs on a long‑term basis,4 many patients could potentially have undiagnosed AI, which may lead to a life‑threatening adrenal crisis.
Clinicians also face diagnostic difficulties due to no definite recommendation on how to properly interpret the results of cortisol levels and stimulation tests after GC withdrawal. There are 4 available tests used to evaluate HPA axis function: the insulin tolerance test (ITT), the overnight metyrapone test, corticotropin‑releasing hormone stimulation test, and the short Synacthen test (SST) (standard and low dose, 250 µg and 1 µg of Synacthen, respectively). The SST is considered to be a reliable and safe method11 and is now commonly used for the diagnosis of AI.1,4,12,13 However, the cutoff values for secondary AI are not clearly defined. The most recently used criteria are cortisol concentrations of 18 µg/dl (500 nmol/l) at minute 30 of the SST and peak cortisol concentrations of 18 µg/dl or 20 µg/dl (550 nmol/l),14 but it is believed that peak cortisol of less than 22 µg/dl (600 nmol/l) does not exclude AI.1
The aims of our study were to assess 3 aspects of AI in patients treated long term with oral GCs who remained on a low maintenance dose of GCs (≤5 mg per day of prednisone or equivalent) for at least 4 weeks. A dose of 5 mg prednisone is the equivalent of a daily adrenal GC output15 and has not been associated with a high risk of AI so far.16
Primarily, we evaluated the prevalence of AI before GC withdrawal and its persistence right after withdrawal and during a minimum of 1‑year follow‑up. Next, we aimed to identify the risk factors for the development of AI. Finally, we sought to assess the diagnostic accuracy of morning cortisol and dehydroepiandrosterone sulfate (DHEA‑S) concentrations measured before GC withdrawal, without the need to perform stimulation tests.
Patients and methods
Study group
The study is part of a larger prospective study evaluating the relapse rates of the underlying disease that was an indication for the use of GCs, after GC withdrawal (autoimmune diseases or renalorliver transplantation—baseline characteristics, see Table 1). Forty participants were recruited from the Department of Immunology, Transplantology and Internal Diseases of Medical University of Warsaw. All patients were on long‑term treatment with oral GCs and were qualified to withdraw the GC therapy. Initially, the treatment included higher doses (maximum 500 mg of prednisone in pulses). The patients were enrolled in the study after reducing the dose to a maximum 5 mg of prednisone daily (or equivalent), taken for a period of 4 weeks to 120 months (median 12 months). Before withdrawal, the entire study group was admitted for the first visit between January 2015 and June 2017 to the Department of Internal Diseases and Endocrinology of Medical University of Warsaw. Patients with diagnosed adrenal dysfunction had then follow‑up visits completed in July 2018. The study protocol was approved by the bioethical committee of the Warsaw University of Medicine (no. KB/241/2013).
Workup
We assessed the adrenal function at 3 time points: initially before GC withdrawal in the entire study group and in patients with adrenal dysfunction at follow‑up visits; after the attempt of withdrawal (median [range] time, 9 [6–12]weeks); and at least at the last follow‑up visit (median [range] time, 1.86 [1.25–3] years]).
Data on the following parameters were collected from all patients: sex, age, body weight, height, underlying and concomitant diseases, medications, duration and dose of GCs. The patients did not take any drugs affecting measurement of total cortisol level. We assessed symptoms and signs of Cushing syndrome (including hypertension, muscle weakness and atrophy, easy bruising, mental disorders, backache or fractures as symptoms of osteoporosis, polydipsia or polyuria as symptoms of diabetes, impotence, oligomenorrhea or amenorrhea, rounding of the face, facial plethora, truncal obesity, adipose tissue accumulation around the supra‑clavicular and cervical regions, striae, thinning of the skin) and symptoms and signs of AI (including fatigue, loss of appetite, muscle weakness, weight loss >3 kg, nausea, vomiting, muscle pain, abdominal pain, hypotension).17-19 Patients who had at least 2 of 4 signs most specific for Cushing syndrome (plethora, striae, bruises, muscle atrophy)17were regarded as having Cushingoid features.
Laboratory tests during each visit included: morning serum cortisol, DHEA‑S, sodium, potassium, glucose, creatinine, lipids, and alanine transaminase.
Diagnostic algorithm
The diagnostic algorithm is shown in Figure 1. We evaluated morning cortisol levels in all patients before GC withdrawal and then performed the standard dose (250 μg) SST if the cortisol levels were between 3 to 16 μg/dl (83 nmol/l–440 nmol/l). We used the SST as it is considered to be safe and reliable,11 has been validated against the ITT,9,10 and is now commonly used for the diagnosis of AI.1,4,12,13 The described algorithm was repeated at each visit.
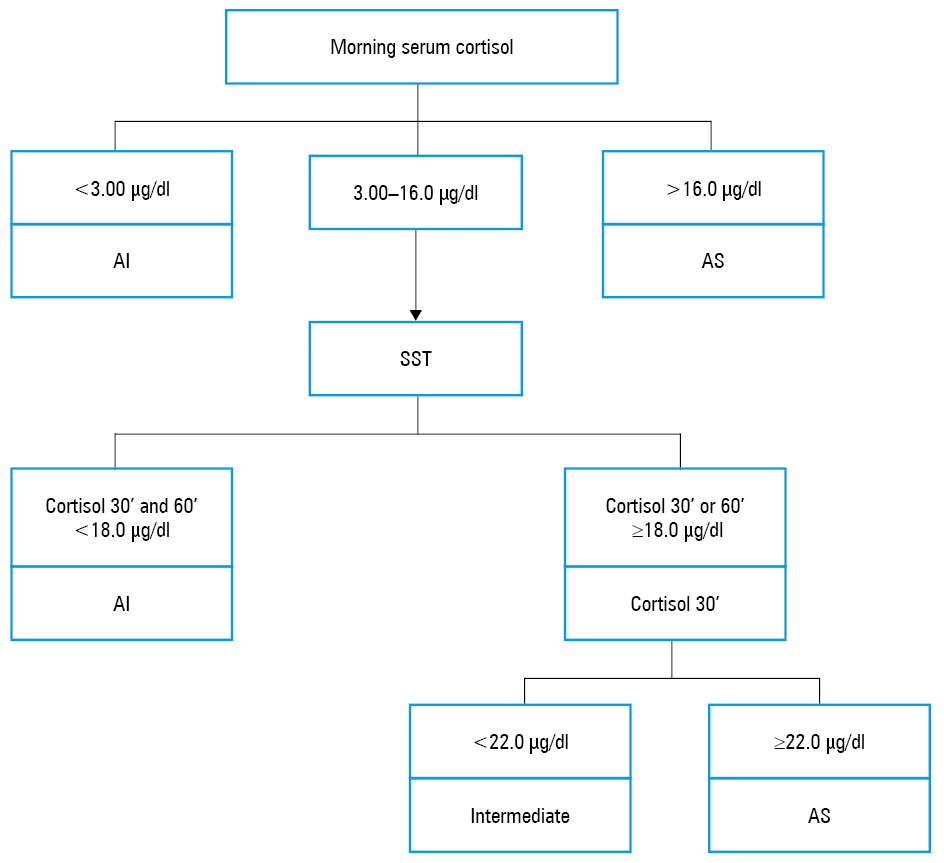
The patients were divided into 3 groups based on the following criteria1,14,20-22: 1) AI group (recognized AI) with morning cortisol levels of less than 3.00 µg/dl or cortisol levels of less than 18.0 μg/dl at minute 30 and 60 of the SST; 2) AS group (adrenal sufficiency, AI excluded) with morning cortisol levels of more than 16.0 μg/dl or cortisol levels of 22.0 μg/dl or more at minute 30 of the SST; 3) intermediate group (partial AI with decreased adrenal cortical reserve) with cortisol levels of 18.0 μg/dl or more at minute 30 or 60 of the SST and cortisol levels of less than 22.0 μg/dl at minute 30 of the SST.
At the first visit a total of 31 patients (out of 40) had the SST (Figure 1). Two patients were diagnosed with AI based on the morning cortisol levels of less than 3 μg/dl and in 7 patients AI was excluded based on morning cortisol of more than 16.0 μg/dl. The patients with recognized AI were recommended GC replacement therapy and patients with partial AI were recommended only stress doses of GCs.
Laboratory evaluation
Baseline cortisol values were measured in a blood sample taken between 7:00 and 9:00 in the morning. The SST was performed in a similar setting and at a similar time (8:00–10:00 morning) after an overnight fast and cessation of GC administration for at least 24 hours. Cortisol was measured in blood samples collected prior to intramuscular administration of 250 μg tetracosactide (1–24‑adrenocorticotropic hormone [ACTH], Synacthen, Novartis, Naples, Italy and SIGMA‑TAU, Roma, Italy) and then 30 and 60 minutes after administration.
Cortisol concentrations were measured by the electrochemiluminescence assay using Elecsys Cortisol II Cobas diagnostic kits (Roche Diagnostics, Mannheim, Germany). The immunoassay for the in vitro quantitative determination of cortisol in human serum or plasma has a detection range of 0.054 to 63.4 μg/dl (1.5–1750 nmol/l). Reference values for morning cortisol are: 4.82 to 19.5 μg/dl (133–537 nmol/l). DHEA‑S concentrations were measured by the electrochemiluminescence assay using Elecsys DHEA‑S Cobas diagnostic kits (Roche Diagnostics). The assay for the in vitro quantitative determination of DHEA‑S in human serum or plasma has a detection range of 0.010 to 100 ng/ml (0.003–27.0 μmol/l). Reference values are age and sex dependent.
Statistical analysis
The results are expressed as medians with ranges for continuous variables, and as numbers and percentages for categorical variables. Comparisons between groups regarding continuous variables were made using the Mann–Whitney test. Categorical variables were compared using the χ2 test and the Fisher exact test. For comparisons between 2 groups, the t test for independent samples was used. Significance was assumed when a null hypothesis could be rejected at a P value of less than 0.05. We decided to compare only 2 out of 3 study groups (AI vs AS). We did not include the intermediate group in comparisons in order to present only 2 clearly defined groups with different clinical characteristics and background in terms of hormone levels.
To assess morning cortisol and DHEA‑S ratios as predictors of AI diagnosis, receiver operator characteristic (ROC) curves analyses were performed with true positive results (sensitivity) plotted against false positive results (1‑specificity). The area under the curve (AUC) analysis was used to express the overall diagnostic accuracy of the assessed criterion. The Youden index (J) was used to determine the optimal empirical cutoff value of basal cortisol (value for which [sensitivity + specificity – 1] is maximized). We then examined alternative cutoffs, considering a minimum specificity (ruling in) or sensitivity (ruling out) requirement of 95%. DHEA‑S ratios were converted by dividing DHEA‑S value by the lower limit of the reference range for all participants, to make a clear comparison between the results of the recent study.23
Patients who dropped out of the study (n = 3) were excluded from the analysis. Statistical analyses were performed using STATISTICA software version 13.3 (TIBCO Software, Palo Alto, California, United States) and R version 3.5.3 (The R Foundation for Statistical Computing, Wien, Austria).
Results
Overall, 40 patients (27 women and 13 men) were evaluated. The baseline characteristics are shown in Table 1.
Variable | Total (n = 40) | AI (n = 10) | Intermediate (n = 7) | AS (n = 23) | P value (AI vs AS) | |
Data are presented as median (range min–max) or number (percentage).
a The Mann–Whitney test for comparisons between groups
b The Fisher exact test for comparisons between groups
c IgA nephropathy (n = 14), minimal change disease (n = 1), focal segmental glomerulosclerosis (n = 1)
d Systemic lupus erythematosus (n = 14), autoimmune hepatitis (n = 1), IgA vasculitis (n = 1)
e ≥1 of drugs included: cyclosporine (n = 8), tacrolimus (n = 5), mycophenolate mofetil (n = 6), azathioprine (n = 5)
Abbreviations: BMI, body mass index; GC, glucocorticosteroid; intermediate, partial adrenal insufficiency group; IgA, immunoglobulin A; KTx, kidney transplantation; LTx, liver transplantation; others, see Figure 1 | ||||||
Age, y | 42 (21–75) | 54 (25–70) | 30 (21–61) | 38 (21–75) | 0.12a | |
Sex | Male | 13 (32.5) | 2 (20.0) | 2 (28.6) | 9 (39.1) | 0.26b |
Female | 27 (67.5) | 8 (80.0) | 5 (71.4) | 14 (60.9) | ||
BMI, kg/m2 | 25.0 (17.3–41.8) | 27.1 (18.9–35.5) | 22.5 (18.6–29.7) | 24.9 (17.3–41.8) | 0.22a | |
GC indication | Nephropathyc | 16 (40) | 2 (20) | 1 (14.3) | 13 (56.5) | 0.054b |
Autoimmune diseasesd | 16 (40) | 5 (50) | 4 (57.1) | 7 (30.4) | ||
After LTx | 6 (15) | 3 (30) | 2 (28.6) | 1 (4.35) | ||
After KTx | 2 (5) | 0 | 0 | 2 (8.70) | ||
GCs | Prednisone | 23 (57.5) | 4 (40.0) | 3 (42.9) | 16 (69.6) | 0.06b |
Methylprednisolone | 15 (37.5) | 7 (70.0) | 1 (14.3) | 7 (30.4) | ||
Deflazacort | 2 (5.0) | 0 | 2 (28.6) | 0 | ||
Duration of GC therapy, mo | 75 (8–420) | 74 (8–420) | 72 (8–360) | 78 (18–288) | 0.81a | |
Duration of low‑dose treatment, mo | 12 (1–120) | 10 (1–36) | 6 (2–72) | 12 (2–120) | 0.19a | |
Other immunosuppressive drugse | 18 (45) | 5 (50) | 4 (57.1) | 9 (39.1) | 0.42b | |
Concomitant diseases | Diabetes | 7 (17.5) | 4 (40) | 0 | 3 (13) | 0.10b |
Hypertension | 29 (72.5) | 10 (100) | 3 (42.9) | 17 (73.9) | 0.09b | |
Dyslipidemia | 22 (55) | 6 (60) | 4 (57.1) | 12 (52.2) | 0.49b | |
Osteoporosis | 5 (12.5) | 1 (10) | 1 (14.3) | 3 (13) | 0.65b | |
The prevalence and persistence of adrenal insufficiency
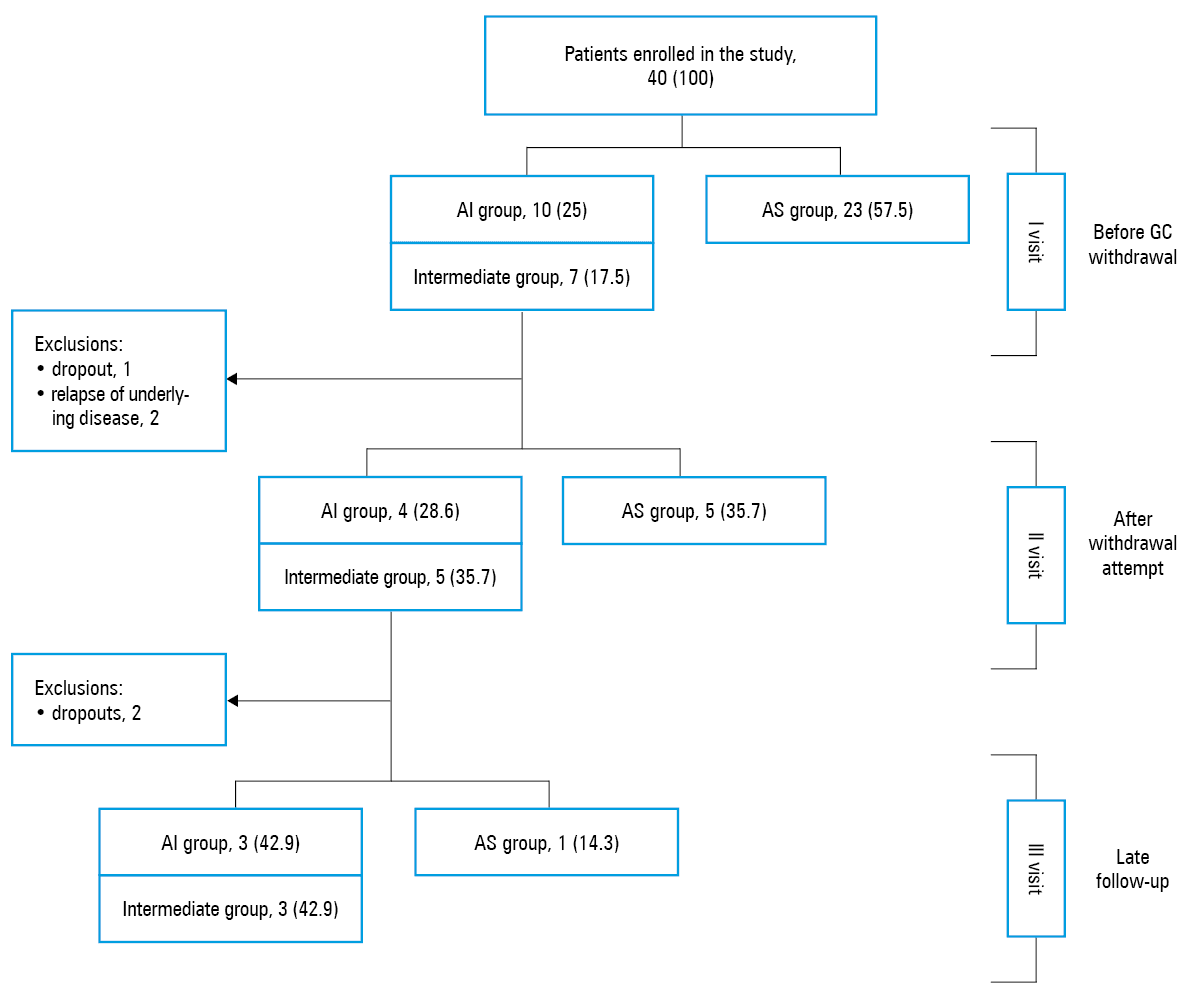
The study flowchart is shown in Figure 2. Before GC withdrawal, AI was diagnosed in 10 patients (25%) and partial AI (intermediate group) in 7 patients (17.5%). After the first visit, 3 patients were excluded (1 dropped out and 2 due to relapses of underlying disease). After GC withdrawal, in 4 patients AI and in 5 patients partial AI persisted (28.6% and 35.7% of the remaining 14 patients, respectively). At late follow‑up visit adrenal function returned to normal only in 1 out of 7 patients (2 patients were lost to follow‑up).
Risk factors of adrenal insufficiency
Cushingoid feature (regarded as 2 or more of the 4 most specific Cushing syndrome signs, such as facial plethora, striae, easy bruising, muscular atrophies)17 occurred more often in the AI compared with the AS group (60% vs 13%; P = 0.01). Among individual signs of Cushing syndrome muscular atrophy occurred more often in the AI group (Table 2). Moreover, 8 out of 11 participants (72.7%) with Cushingoid features had impaired adrenal function (6 AI and 2 partial AI).
Parameter | AI (n = 10) | Intermediate (n = 7) | AS (n = 23) | P value AI vs AS |
Data are presented as number (percentage). The Fisher exact test was used to compare groups.
a ≥2/4 described signs
Abbreviations: see Figure 1 | ||||
Cushingoid featurea | 6 (60) | 2 (28.6) | 3 (13) | 0.01 |
Plethora | 2 (20) | 2 (28.6) | 4 (17.4) | 0.61 |
Striae | 3 (30) | 0 | 3 (13) | 0.25 |
Easy bruising | 7 (70) | 6 (85.7) | 10 (43.5) | 0.15 |
Muscular atrophies | 5 (50) | 1 (14.3) | 1 (4.35) | 0.005 |
No significant differences were found between the groups in anthropometric parameters (age, sex, body mass index), type of GC, duration of GC therapy, duration of treatment with a low dose, indications for GC therapy, and concomitant diseases (Table 1).
No differences were found between the groups regarding the prevalence of AI symptoms, which were present in 3 out of 10 patients in the AI group, 3 out of 7 patients in the intermediate group and in 4 out of 23 patients in the AS group (AI vs AS group, P = 0.42; AI vs intermediate group, P = 0.59; and AS vs intermediate group, P = 0.16). Morning cortisol values did not differ significantly in patients presenting with these symptoms compared with the remaining group (P = 0.18).
No significant differences between the groups in terms of other basic biochemical parameters (sodium, potassium, glucose, creatinine, lipids, alanine transaminase, C reactive protein, urinalysis) were found (data not shown).
The diagnostic accuracy of morning cortisol and dehydroepiandrosterone sulfate levels before glucocorticoid withdrawal
Laboratory findings of the study group before GC withdrawal (n = 40) are shown in Table 3. There were significant differences in baseline morning cortisol values in AI, intermediate, and AS groups (median cortisol levels, 4.68 μg/dl [129 nmol/l], 11.2 μg/dl [309 nmol/l], and 15.3 μg/dl [422 nmol/l], respectively; P <0.001 for comparison of AI and AS). During the SST, cortisol values at each time point and Δ cortisol were also higher in the AS group compared with the AI group (P <0.001). DHEA‑S levels were significantly lower in the AI compared with the AS group (P = 0.002). Moreover, 12 out of 19 participants (63.2%) with DHEA‑S levels below reference values had impaired adrenal function.
Parameter | AI (n = 10) | Intermediate (n = 7) | AS (n = 23) | P value (AI vs AS) |
Data are presented as median (range min–max) or number (percentage) of patients.
a The Mann–Whitney test
b The χ2 test
c Peak serum cortisol levels in the short Synacthen test subtracted by baseline serum cortisol
d Measurements not available for all patients. The short Synacthen test was performed in patients with a suspicion of AI, with morning cortisol values between 3.00 to 16.0 μg/dl (n = 31).
SI conversion factors: to convert cortisol to nmol/l, multiply by 27.59; DHEA‑S to nmol/l, by 2.714.
| ||||
Morning cortisol, μg/dl | 4.68
(0.68–8.13) | 11.2
(7.83–14.9) | 15.3
(10.8–20.9) | 0.001a |
Cortisol at 30’ of SST, μg/dld | 12.2
(8.05–14.9) | 19.1
(17.7–21.0) | 25.2
(22.0–33.4) | 0.001a |
Cortisol at 60’ of SST, μg/dld | 13.8
(9.31–17.6) | 23.4
(20.3–26.2) | 28.9
(24.7–41.2) | 0.001a |
∆Serum cortisol, μg/dlc,d | 5.99
(3.71–9.70) | 10.8
(8.1–24.4) | 15.5
(7.64–27.8) | 0.001a |
DHEA‑S, μg/dl | 12.6
(1.4–166.1) | 49.4
(9.2–261.4) | 106.5
(14.1–244.1) | 0.002a |
DHEA‑S below reference values | 8 (80) | 4 (57.1) | 7 (30.4) | 0.009b |
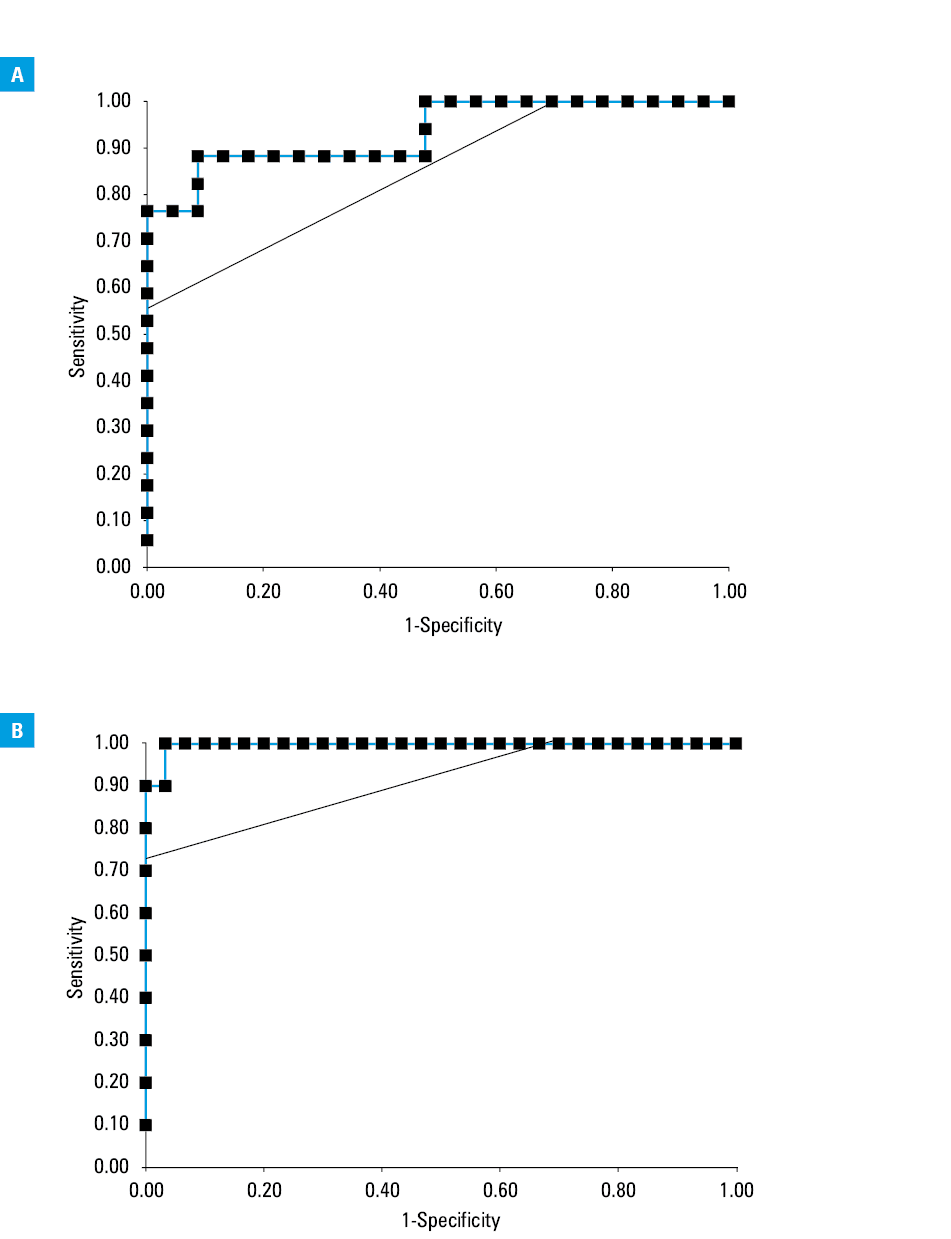
The ROC analyses were based on morning cortisol and DHEA‑S measurements before GC withdrawal (n = 40) as predictors of AI diagnosis. To find the optimal cutoff values to rule out and to rule in AI, we compared the AS versus AI and intermediate group and the AI versus AS and intermediate group. The AUC of morning cortisol for these 2 comparisons was 0.93 and 0.997, respectively (ROC curves, Figure 3A and 3B). Table 4 shows sensitivities, specificities, positive predictive values (PPV), negative predictive values (NPV), positive likelihood ratios, and negative likelihood ratios of morning cortisol at different cutoffs, including those determined by the Youden index. A good cutoff to rule out AI was a baseline cortisol level of 14.91 μg/dl (411 mmol/l) with sensitivity of 100% and specificity of 52% (PPV 61%, NPV 100%) (Figure 3A). A good cutoff to rule in AI was a baseline cortisol level of 6.51 μg/dl (179.6 nmol/l) with specificity of 100% and sensitivity of 90% (PPV 100%, NPV 97%) (Figure 3B).
Morning cortisol, μg/dl | Sensitivity, % | Specificity, % | PPV, % | NPV, % | J | LR+ | LR– |
a Optimal cutoff point according to Youden index (J)
b Optimal cutoff point to rule out AI
c Optimal cutoff point to rule in AI
SI conversion factors: to convert to nmol/l, multiply by 27.59.
Abbreviations: J, Youden index; LR+, positive likelihood ratio; LR–, negative likelihood ratio; NA, not applicable; NPV, negative predictive value; PPV, positive predictive value; others, see Figure 1 | |||||||
AS group vs AI and intermediate groups | |||||||
11.69a | 88 | 91 | 88 | 91 | 0.80 | 10.15 | 0.13 |
14.80 | 94 | 52 | 59 | 92 | 0.46 | 1.97 | 0.11 |
14.91b | 100 | 52 | 61 | 100 | 0.52 | 2.09 | 0 |
15.27 | 100 | 48 | 59 | 100 | 0.48 | 1.92 | 0 |
AI group vs AS and intermediate groups | |||||||
6.51c | 90 | 100 | 100 | 97 | 0.90 | NA | 0.10 |
7.83 | 90 | 97 | 90 | 97 | 0.87 | 27.00 | 0.10 |
8.13a | 100 | 97 | 91 | 100 | 0.97 | 30.00 | 0 |
9.40 | 100 | 93 | 83 | 100 | 0.93 | 15.00 | 0 |
DHEA‑S concentrations as the only criterion for the diagnosis of AI proved to be a worse parameter than morning cortisol levels. The AUC of ROC curves of DHEA‑S ratios corresponding to Figure 3A and Figure 3B curves of baseline cortisol was 0.78 in both cases.
Discussion
The prevalence of GC‑induced AI varies from 14% to 100%.3-10 Data about the prevalence in patients taking low doses of GCs are scarce. Schlaghecke et al,6 in their study on 60 patients taking less than 5 mg of prednisone per day, found a normal response to corticotropin‑releasing hormone stimulation test only in 37% of patients. On the other hand, Hicklin et al15 found abnormal results of the SST only in 10% from 39 patients taking 5 mg of prednisone. Among our 40 patients, insufficient adrenal response (AI or partial AI) occurred in 42.5% patients before GC withdrawal, which is in agreement with the study by Borresen et al24 that demonstrated an insufficient response to the SST in 39% of 33 patients receiving 5 mg prednisolone daily. Such a high prevalence is alarming, especially considering that currently in patients taking these doses of GCs, it is suggested to test HPA axis function only when abrupt discontinuation is being considered or a patient is exposed to acute stress.16 To reduce the risk of overlooking AI, we advise evaluating adrenal function before GC therapy withdrawal in all cases, regardless of the dose. It could be helpful to identify patients who need extended withdrawal time and/or being at risk of persisted AI after GC withdrawal.
Our study suggests that impaired adrenal function can be detected in 22.5% of patients after GC withdrawal and in 15.0% of patients at late follow‑up visit. Our data are in agreement with previous reports that GC‑induced AI could last from few days to more than a year7,10,11 and with a study by Jamilloux et al7 who showed insufficient response to the SST in 10% of the study group 2 years after GC withdrawal.
The best known risk factors for AI development are: daily doses of more than 20 mg of prednisone (or equivalent) taken for more than 3 weeks, evening doses of 5 mg or more of prednisone taken for more than a few weeks, and a Cushingoid appearance.16 We found no significant differences between the study groups in terms of duration of GC therapy, but our results may be caused by a small sample size. On the other hand, our data are in agreement with evidence suggesting that Cushingoid features increase the risk of AI.
Despite known factors affecting the HPA axis function, it is still hard to predict which of the patients taking GCs will develop an iatrogenic Cushing syndrome and/or AI.25-27 It may be caused by individual variations in GC metabolism and genetic differences in regulation of GC receptor activity.27
As many as 90% of patients with GC‑induced AI may be asymptomatic.28 Moreover, AI and adrenal crisis may also have atypical course.29,30 In our study, only 6 of 17 patients from the AI and intermediate groups had symptoms of AI. This shows that AI would be missed in 64.7% if adrenal function was evaluated in symptomatic patients only. In our study group, 1 patient with AI with no symptoms at first visit developed an adrenal crisis during follow‑up in the course of gastrointestinal infection. For this reason, it is extremely important to evaluate adrenal function in all patients taking long‑term GCs, even those who are asymptomatic.
For HPA axis evaluation, we used the SST which is now commonly used for the diagnosis of AI.1,4,12,13 Our decision about the cutoff values of the SST was based on the available literature and supported by assessment of clinical status. However, we assessed the value of morning cortisol and DHEA‑S in facilitating AI diagnosis. Morning cortisol measurements are safe, accessible in all outpatient clinics, and may significantly reduce the cost of diagnostic workup if there is no need to perform stimulation tests. A strong positive correlation between morning cortisol and stimulated cortisol levels during ITT was described previously.31 Although several cortisol cutoff values have been used, most contemporary studies showed that the concentration of less than 3.6 μg/dl (100 nmol/l) strongly suggests AI.9,20,31-33 The cutoff value for AI exclusion, however, varies depending on the study, from 5.07 μg/dl (140 nmol/l) to 18.34 μg/dl (506 nmol/l).1,9,19-21,31,34,35 Woods et al,9 in their study in 404 patients taking GCs, found the best cutoff value to rule out AI at baseline cortisol was 14.86 μg/dl (410 nmol/l). Sbardella et al,34 in an analysis of a group of 2050 SSTs performed with the Roche Modular System assay, found this value at 18.34 μg/dl (506 nmol/l). The authors drew attention to the fact that this limit may be lower in patients receiving GCs, which is in agreement with our results, demonstrating that a morning cortisol level of 14.91 μg/dl (411 nmol/l) gave 100% NPV for ruling out AI. But in ruling in AI, we found with 100% specificity that the value of cortisol concentration may be higher, not 3.6 μg/dl, but 6.51 μg/dl. If we could adopt these 100% cutoffs in our study, 9 out of 31 SSTs (29%) would not have to be performed because the results of the SST could have been predicted based on the morning cortisol alone.
Previous studies have suggested that a normal DHEA‑S level in patients with pituitary masses is a strong indicator of adrenal sufficiency and normal ACTH secretion.36,37 It is considered that GCs cause suppression of DHEA‑S secretion, which could last even months after GC secretion returns to normal.36 Studies including patients treated with GCs demonstrated that DHEA‑S still exhibits good prediction of HPA function, but a number of these patients was small (10 out of 46 patients)23 or unknown.38 To the best of our knowledge, our study is the first to evaluate only patients taking GCs. Despite significantly lower concentrations in the AI group compared with the AS group, we found the lower diagnostic value of DHEA‑S measurement to diagnose AI compared with the study by Charoensri et al23, who showed the AUC of ROC curves at level 0.92, compared with 0.78 in our study. Our results indicate that DHEA‑S may have lower diagnostic value after GC therapy, but there is a need for larger studies to validate this result.
We acknowledge several important limitations of our study: 1) small sample size; 2) heterogeneous group of patients in terms of indications for GC therapy, the duration and type of used GCs; 3) lack of SST and ACTH measurement in the entire study group; 4) no follow‑up in the entire study group. Moreover, due to long‑term treatment in most patients (up to 35 years) it was not possible to evaluate precisely the cumulative dose of taken GC. Finally, as a potential hypothesis‑generating study, we did not apply corrections for multiple testing.39 Therefore, the results of our study need to be replicated in a larger, prospective trial.
In conclusion, the prevalence of secondary AI in patients who received long‑term low‑dose GC is high. It may persist even years after gradual withdrawal of GC. Due to the risk of adrenal crisis, it is truly important to evaluate HPA axis function in all patients before withdrawal. We suggest the morning cortisol measurement for initial assessment of HPA axis function as it is a safe simple and easily accessible test. Values of 14.91 μg/dl or higher with 100% sensitivity suggest adrenal sufficiency and values of 6.51 μg/dl or less with 100% specificity suggest AI. It should be interpreted together with a clinical presentation (features of iatrogenic Cushing syndrome, signs and symptoms of AI). Further studies are needed to assess the value of DHEA‑S in the diagnosis of AI.
- Arlt W, Allolio B. Adrenal insufficiency. Lancet. 2003; 361: 1881‑1893. | Crossref
- Bornstein SR. Predisposing factors for adrenal insufficiency. N Engl J Med. 2009; 360: 2328‑2339. | Crossref
- Joseph RM, Hunter AL, Ray DW, et al. Systemic glucocorticoid therapy and adrenal insufficiency in adults: A systematic review. Semin Arthritis Rheum. 2016; 46: 133‑141. | Crossref
- Sacre K, Dehoux M, Chauveheid MP, et al. Pituitary‑Adrenal Function After Prolonged Glucocorticoid Therapy for Systemic Inflammatory Disorders: An Observational Study. J Clin Endocrinol Metab. 2013; 98: 3199‑3205. | Crossref
- Ambroziak U, Bluszcz G, Bednarczuk T, Miśkiewicz P. The influence of Graves’ orbitopathy treatment with intravenous glucocorticoids on adrenal function. Endokrynol Pol. 2017; 68: 430‑433. | Crossref
ARTICLE INFORMATION