Presence of copy number aberration and clinical prognostic factors in patients with acute myeloid leukemia: an analysis of effect modification
Key words: acute myeloid leukemia, clinical prognostic factors, copy number aberrations


 CC BY-NC-SA 4.0
Presence of copy number aberration and clinical prognostic factors in patients with acute myeloid leukemia: an analysis of effect modification
Introduction: Acute myeloid leukemia (AML) is characterized by multiple acquired genetic events, chromosomal abnormalities such as copy number aberrations (CNAs), disease progression, and low survival rates.
Objectives: We assessed the utility of a multiplex ligation–dependent probe amplification (MLPA) assay in AML as well as correlations of CNAs with various biological and clinical features of patients with AML, including somatic mutations in the FLT3, NPM1, and DNMT3A genes and survival.
Patients and methods: The study included 283 patients with AML. The MLPA was used for investigation of CNAs. The status of somatic mutations was analyzed in all cases.
Results: The presence of CNAs was associated with the adverse (high) risk category according to the European LeukemiaNet (ELN) classification (PFDR <0.0001). The significant predictors of mortality were age of 65 years or older (hazard ratio [HR], 2.30; 95% CI, 1.71–3.09), ELN high‑risk category (HR, 1.71; 95% CI, 1.15–2.56), and the Eastern Cooperative Oncologic Group Scale (ECOG) performance status grade of 3 or higher (HR, 2.43; 95% CI, 1.80–3.30), but not the presence of CNA. An interaction between CNAs and the ECOG performance status was shown (HRinteraction, 2.24; 95% CI, 1.09–4.57, P = 0.02). The presence of CNAs was positively correlated with the risk of death in patients with an ECOG grade of 3 or higher (HR, 2.02; 95% CI, 1.30–3.12), while for patients with the performance status of 2 or lower, the presence of CNAs was a protective factor against the risk of death.
Conclusions: The presence of CNAs may modify the effect of the ECOG performance status on survival. Independent predictors of mortality in patients with AML include age, ELN adverse risk category, and the ECOG grade of at least 3.
What's new?
This is the first study to assess the association of copy number aberrations (CNAs) with European LeukemiaNet (ELN) adverse (high‑risk) category, somatic mutations, biological features, and overall survival in patients with acute myeloid leukemia (AML). The presence of CNAs is associated with the FLT3 D835 mutation, but not with other recurrent somatic mutations, age, or other clinical features of patients with AML. The combination of CNAs and the type of mutated status in the FLT3, NPM1, and DNMT3A gene mutations resulted in a difference in survival rates. The presence of CNAs may modify the effect of the Eastern Cooperative Oncologic Group Scale (ECOG) performance status on the overall survival.
Introduction
Acute myeloid leukemia (AML), the most common acute leukemia in adults, is a heterogeneous, complex, and dynamic disease, characterized by multiple somatically acquired genetic events, progression over time, and low survival rates.1,2 Chromosomal abnormalities and gene mutations are important prognostic factors in AML, but also in other types of leukemia, such as chronic lymphocytic leukemia (CLL).3,4
An increased number of recurrent cytogenetic abnormalities are identified in AML, and specific AML disease entities focusing on significant cytogenetic and molecular genetic subgroups were defined by the World Health Organization (WHO) classification of myeloid neoplasms and acute leukemia.3 An important part of chromosomal aberrations is detectable by cytogenetic analysis, which is considered the gold standard for identifying abnormalities used for risk stratification.5,6 Based on the 2017 European LeukemiaNet (ELN) recommendations, the conventional cytogenetic investigation is mandatory for the evaluation of an AML patient at the time of diagnosis.1 Cytogenetic abnormalities identified at diagnosis are the most powerful predictor of outcome and allow a classification of patients with AML into 3 prognostic groups: favorable (low‑risk), intermediate (intermediate‑risk), and adverse (high‑risk).7,8 Unfortunately, some patients may have metaphases that cannot be analyzed, or the resolution of the chromosome banding is too low, or recurrent numerical and structural chromosomal abnormalities that are useful in risk stratification of AML patients cannot be identified.9 In such cases, it is necessary to use additional methods for evaluation of chromosomal abnormalities, including copy number aberrations (CNAs) of chromosomal regions known to have a significant diagnostic or prognostic role in leukemia.
Recently, new molecular methods such as a multiplex ligation‑dependent probe amplification (MLPA) assay, array comparative genomic hybridization, and high‑resolution single nucleotide polymorphism array have been proved useful for detection of CNAs in AML,9-12 acute lymphoblastic leukemia,13,14 and CLL.15 Vázquez‑Reyes et al13 reported that MLPA results correlated with those identified by karyotype, and in some cases, it could detect more chromosomal abnormalities than the karyotype in acute lymphoblastic leukemia. They suggested that MLPA could be an alternative technique for assessment of aneuploidy in leukemia.13 Recently, Marcinkowska‑Swojak et al16 developed a new MLPA‑based method for a simultaneous detection of nucleophosmin‑1 (NPM1) gene mutations and analysis of CNAs. They concluded that the MLPA‑based technique is a fast, simple, and reliable tool that allows a concomitant identification of more CNAs and certain mutations in acute leukemia. A few MLPA studies have been performed in patients with AML, but they included a small number of samples.10,11,16
Recurrent CNAs might represent an important prognostic marker in AML and might guide clinical decision making, especially in AML. Their identification by molecular methods could be helpful in cases with inconclusive cytogenetic analysis.12 Therefore, it is necessary to assess the utility of a fast and inexpensive method as well as commercially available probe technique that might be used in combination with or instead of the conventional cytogenetic analysis in patients with AML.
This study aimed to assess the usefulness of the MLPA assay as first‑tier testing in detecting CNAs as well as its role in routine investigation of CNAs and prognosis in AML. We attempted not only to identify recurrent CNAs but also to correlate them with various biological and clinical features of patients with AML, such as somatic mutations in the FLT3, NPM1, and DNMT3A genes as well as survival.
Patients and methods
Patients
The study included 283 consecutive AML patients from central and north‑western regions of Romania. The samples were collected at diagnosis on admission of patients to hematology units in Târgu Mureș and Cluj‑Napoca before starting chemotherapy.
The inclusion criteria were as follows: diagnosis of AML, age older than 18 years, and written informed consent to participate in the study.
The mean (SD) age of patients was 56 (16.7) years (range, 18–87 years). We enrolled 230 patients (81.3%) with de novo AML; 48 (17%), with secondary AML; and 5 (1.8%), with therapy‑related AML in those with prior chemotherapy. Based on the European LeukemiaNet (ELN) risk stratification, most of our patients were categorized as intermediate risk (n = 145), followed by high (n = 79) and favorable risk (n = 58). According to Eastern Cooperative Oncologic Group Scale (ECOG), the performance status grade 3 and 4 was observed in 60.8% of the patients (n = 172), while the grade of 2 or lower, in 39.2% (n = 111).
The samples were collected after patients provided written informed consent to participate in the study. The study was performed in accordance with the Declaration of Helsinki and was approved by the Ethics Committee of the George Emil Palade University of Medicine, Pharmacy, Science and Technology of Târgu Mureș, Romania (no. 67; April 14, 2017).
Methods
Genomic DNA (gDNA) was extracted from fresh blood using DNA Quick‑gDNA MiniPrep kits (Zymo Research, Irvine, California, United States), Wizard Genomic DNA Purification kits (Promega, Madison, Wisconsin, United States), and PureLink Genomic DNA Mini Kits (ThermoFischer Scientific, Waltham, Massachusetts, United States), following the manufacturers’ instructions. We used a multiplex polymerase chain reaction (PCR) method, namely, MLPA for examination of the most common CNAs (deletions and duplications) associated with hematologic malignancies. For each MLPA reaction, 5 µl of DNA (with a quantity of 50–100 ng) was used.
For the analysis of CNAs, different SALSA MLPA kits were used, including P377 Hematologic Malignancies, P437 Familial MDS‑AML, P202 IKZF1, P414 MDS, and P040 CLL probemix (MRC‑Holland, Amsterdam, the Netherlands). For aneuploidy detection at diagnosis, SALSA MLPA P070 Subtelomeres Mi × 2B and P036 Subtelomeres Mi × 1 probemix were used (MRC‑Holland).
All patients were investigated using SALSA MLPA Subtelomeres and Hematologic Malignancies probemix, and all abnormalities identified by that kit were investigated using the other SALSA MLPA kits (P437 Familial MDS‑AML, P202 IKZF1 [IKAROS], P414 MDS, and P040 CLL probemix). Data were analyzed using Coffalyser.Net, a free MLPA analysis software developed by MRC‑Holland. In each case, the data obtained were normalized to reference probes and control samples.
In each run of MLPA, at least 3 reference samples were used. In the case of a run with an increased number of AML samples (>21), we used one additional reference sample for each 7 AML samples. All control samples were obtained from healthy adults with no acute leukemia or other types of malignancy.
FLT3-ITD, FLT3-D835 (c.2503 G>C/A/T; c.2504 A>C/T; c.2505 T>A/G), DNMT3A (c.2644 C>G/A/T, c.2645G>A/C/T), and NPM1 (c.860_863dupTCTG, c.862_863insCATG, c.863_864insCATG/CGTG/CCTG/TTTG/TAAG/CTTG/TATG) mutational status was analyzed in each AML case using the protocols described previously,17-20 with minor modifications.10 NPM1 mutations were confirmed by high‑resolution melt analysis (in‑house method), and NPM1 c.860_863dupTCTG, also by competitive allele‑specific TaqMan PCR.
Statistical analysis
The demographic characteristics and clinical factors were presented as mean and SD or absolute and relative frequencies. The significant difference in age distribution between AML patients with and without CNAs was tested by the t test for independent samples with equal variances, while the bivariate associations between the presence of CNAs and clinical factors (considered as qualitative variables) were assessed by the χ2 test or Fisher exact test. In the case of a significant correlation between the presence of CNAs and a clinical factor (defined as a nominal variable), a post hoc analysis for pairwise comparisons was performed using the permutation χ2 test, and estimated significance levels (P) were adjusted by the false discovery rate (FDR) method. The Benjamini‑Hochberg procedure was used to control the expected proportion of false discoveries among the rejected hypotheses (FDR), because together with the Benjamini–Yekutieli procedure, it is considered more powerful than the other methods.21,22
The CNAs (defined as presence or absence or as a categorical variable with 3 groups: the absence of CNAs, a single CNA, and more than 2 CNAs) were tested for prognostic impact on overall survival (OS). The median OS was calculated using the Kaplan–Meier analysis, and the 95% CI for the median was estimated using the log‑log transform method. The relationship between the combination of CNAs and somatic mutations with OS was also analyzed. For all these exploratory analyses, log‑rank tests were separately applied, and the significance was considered at a P value of less than 0.05.
To explore the effects of CNAs on the risk of death in AML patients, the univariable and multivariable Cox proportional hazards regression analyses were used. In the univariable analysis, we tested the potential clinical prognostic factors,and all the factors with an estimated P value of 0.25 or less were then included in the multivariable analysis. The multivariable analysis was conducted using 2 different models to investigate whether CNAs and clinical factors were multiplicatively related to the risk of death. The models were as follows: 1) main effect model was adjusted by age at diagnosis (<65 years, ≥65 years), sex (male, female), ELN risk (low, intermediate, and high), AML subtypes (de novo, secondary), ECOG performance status (grade ≤2; grade ≥3), and somatic mutations (FLT3, NPM1, DNMT3A); and 2) interaction effect model included the interaction variable (CNAs × ECOG performance status) in the main effect model. The effects were estimated by multivariable‑adjusted hazard ratios (HRs) with 95% CIs. Effect modification by CNAs was assessed on a multiplicative scale using the likelihood ratio test of a cross‑product term between CNAs and ECOG performance status considered as dichotomous variables.
The statistical analysis was performed using custom‑written scripts in the R software, version 3.6.0 (R Foundation for Statistical Computing, Vienna, Austria). The libraries used in R were survival and survminer.23
Results
Characterization of AML patients
Clinical characteristics of all studied patients as well as separately of those with the presence or absence of CNAs are presented in Table 1. Among the 283 adults evaluated for CNA presence, 90 (31.8%) had at least 1 CNA identified (64 patients, 1 CNA; 11 patients, 2 CNAs; and 15 patients, 3 or more CNAs).
Variable | All AML cases (n = 283) | AML without CNAs (n = 193) | AML with CNAs (n =90) | P valuea |
Variable | All AML cases (n = 283) | AML without CNAs (n = 193) | AML with CNAs (n = 90) | P valuea |
Data are presented as number (percentage).
a P values were obtained by the χ2 or Fisher exact test.
b The χ2 test was applied for ELN 2017 risk groups defined as low‑risk, intermediate, and high‑risk.
Abbreviations: AML, acute myeloid leukemia; ECOG, Eastern Cooperative Oncologic Group Scale performance status; ELN, European LeukemiaNet; LDH, lactate dehydrogenase; PLT, platelet count; WBC, white blood cell | ||||
Age, y | ||||
18–39 | 57 (20.1) | 34 (17.6) | 23 (25.6) | 0.50 |
40–59 | 100 (35.3) | 72 (37.3) | 28 (31.1) | |
≥60 | 126 (44.5) | 87 (45.1) | 39 (43.3) | |
<65 | 193 (68.2) | 134 (69.4) | 59 (65.6) | 0.51 |
≥65 | 90 (31.8) | 59 (30.6) | 31 (34.4) | |
Sex | ||||
Men | 150 (53) | 103 (53.4) | 47 (52.2) | 0.97 |
Women | 133 (47) | 90 (46.6) | 43 (47.8) | |
WBC, cells/mm3 | ||||
<50000 | 226 (79.9) | 157 (81.3) | 69 (76.7) | 0.42 |
≥50000 | 57 (20.1) | 36 (18.7) | 21 (23.3) | |
PLT, cells/mm3 | ||||
<40000 | 130 (45.9) | 84 (43.5) | 46 (51.1) | 0.43 |
≥40000 | 153 (54.1) | 109 (56.5) | 44 (48.9) | |
Hemoglobin, g/dl | ||||
<10 | 208 (73.5) | 136 (70.5) | 72 (80.0) | 0.07 |
≥10 | 75 (26.5) | 57 (29.5) | 18 (20.0) | |
LDH, IU/l | ||||
<600 | 115 (40.6) | 84 (43.5%) | 31 (34.4) | 0.09 |
≥600 | 168 (59.4) | 109 (56.5%) | 59 (65.6) | |
Blasts (in bone marrow), % | ||||
<70 | 177 (62.5) | 121 (62.7) | 56 (62.2) | 0.70 |
≥70 | 106 (36.5) | 72 (37.3) | 34 (37.8) | |
ECOG performance status | ||||
0 | 6 (2.1) | 5 (2.6) | 1 (1.1) | 0.59 |
1 | 54 (19.1) | 39 (20.2) | 15 (16.7) | |
2 | 51 (18.0) | 37 (19.2) | 14 (15.6) | |
3 | 107 (37.8) | 69 (35.7) | 38 (42.2) | |
4 | 65 (23.0) | 43 (22.3) | 22 (24.4) | |
FLT3 mutation (ITD, D835, or both) | ||||
Positive | 52 (18.4) | 30 (15.5) | 22 (24.4) | 0.09 |
Negative | 231 (81.6) | 163 (84.5) | 68 (75.6) | |
FLT3-ITD mutation | ||||
Positive | 42 (14.8) | 27 (14.0) | 15 (16.7) | 0.69 |
Negative | 241 (85.2) | 166 (86.0) | 75 (83.3) | |
FLT3 D835 mutation | ||||
Positive | 15 (5.3) | 6 (3.1) | 9 (10.0) | 0.019 |
Negative | 268 (94.7) | 187 (96.9) | 81 (90.0) | |
DNMT3A mutation | ||||
Positive | 35 (12.4) | 24 (12.4) | 11 (12.2) | 0.92 |
Negative | 248 (87.6) | 169 (87.6) | 79 (87.8) | |
NPM1 mutation | ||||
Positive | 48 (17.0) | 37 (19.2) | 11 (12.2) | 0.19 |
Negative | 235 (83.0) | 156 (80.8) | 79 (87.8) | |
Response to treatment | ||||
Complete remission | 43 (15.2) | 32 (16.6) | 11 (12. 6) | 0.95 |
Partial remission | 51 (18.0) | 34 (17.6) | 17 (18.9) | |
Resistance | 71 (25.1) | 48 (24.9) | 23 (26.6) | |
Relapse | 69 (24.4) | 46 (23.8) | 23 (25.6) | |
No response/induction death | 49 (17.3) | 33 (17.1) | 16 (17.8) | |
ELN 2017 risk groups | ||||
Low‑risk (favorable prognosis) | 59 (20.5) | 49 (25.4) | 9 (10.0) | <0.001b |
Intermediate‑risk | 145 (21.2) | 115 (59.6) | 30 (33.3) | |
High‑risk (adverse) | 79 (27.9) | 28 (14.5) | 51 (56.7) | |
Not available | 1 (0.4) | 1 (0.5) | 0 (0.0) | |
Differences in overall survival according to clinical and biological features
We observed differences in the OS curves in patients with high lactate dehydrogenase (LDH) levels (<600 IU/l) at diagnosis compared with those with low LDH levels (<600 IU/l): median OS, 11 (95% CI, 7.9–14.1) and 5 (95% CI, 3.7–6.4), respectively (P = 0.001). We noted that patients with WBC counts higher than 50000 cells/mm3 at diagnosis had a shorter median OS (6 months) than those with WBC counts of less than 50000 cells/mm3 at diagnosis (8 months) (P = 0.07). Patients with AML with hemoglobin levels below 10 g/dl had a lower median OS (6 moths) than those with hemoglobin level of 10 g/dl or higher (9 months) (P = 0.06). Also, there was a smaller OS difference in patients with AML with platelet count below 40000 cells/mm3 compared with those with count of 40000 cells/mm3 or higher, but this was not significant (P = 0.08).
Bivariate associations between copy number aberrations and clinical factors
No differences were observed regarding age and sex distribution between patients with and without CNAs (P = 0.51 and P = 0.85, respectively). No differences were also observed for higher WBC count (P = 0.31), PLT count (P = 0.23), and LDH levels (P = 0.14) between patients with or without CNAs. Lower hemoglobin levels were observed with a similar frequency between patients with and without CNAs (80.5% and 70.4%, respectively; P = 0.09). No associations were found between the presence of CNAs and blast percentage (P = 0.94), ECOG performance status (P = 0.73), and AML subtype according to the WHO classification (P = 0.70).
The presence of CNAs was associated with the FLT3 D835 mutation (P = 0.02), with the mutation being more frequent in patients with CNAs. The FLT3 ITD mutation showed no association with the presence of CNAs (P = 0.55). Also, no difference in the frequency of NPM1 and DNMT3A mutations between patients with or without CNAs was noted (P = 0.14 and P = 0.96, respectively).
The presence of CNAs was significantly associated with ELN risk categories. The post hoc analysis (pairwise comparisons made with the permutation χ2 test) revealed significant correlation with the ELN high‑risk category. Therefore, the frequency of CNAs was different in patients with the ELN high‑risk than that in patients with ELN low‑risk and intermediate‑risk categories (PFDR <0.001). No differences were shown between patients with and without CNAs in terms of the response to treatment (P = 0.92).
Effect of copy number aberrations on overall survival: a univariable analysis
Patients with CNAs had a similar median OS as those without CNAs (median OS, 6 months [95% CI, 2.4–9.6] vs 7 months [95% CI, 5.6–8.4; P = 0.54). No difference in the OS was also observed regarding the presence of CNAs (defined as the absence of CNAs or the presence of 1, 2, or 3 CNAs, P = 0.93). Patients with 2 or more CNAs had similar OS to those without or with only 1 CNA (median OS, 4 months vs 7 months vs 8 months; P = 0.83). In the univariable Cox regression analysis, the presence of CNAs was not a significant predictor of death (HR, 1.09; 95% CI, 0.82–1.46), while the significant predictors included age older than 65 years (HR, 2.30; 95% CI, 1.71–3.09), ELN high‑risk category (HR, 1.71; 95% CI, 1.15–2.56), and the ECOG grade of 3 or higher (HR, 2.43; 95% CI, 1.80–3.30).
Effect of copy number aberrations on overall survival: a multivariable analysis
We conducted the multivariable Cox regression analysis to assess the risk of death using 2 different Cox models (Figures 1 and 2). The main effect model showed no significant effect of CNAs on death after controlling for important demographic and clinical covariates (HR, 0.89; 95% CI, 0.64–1.25).
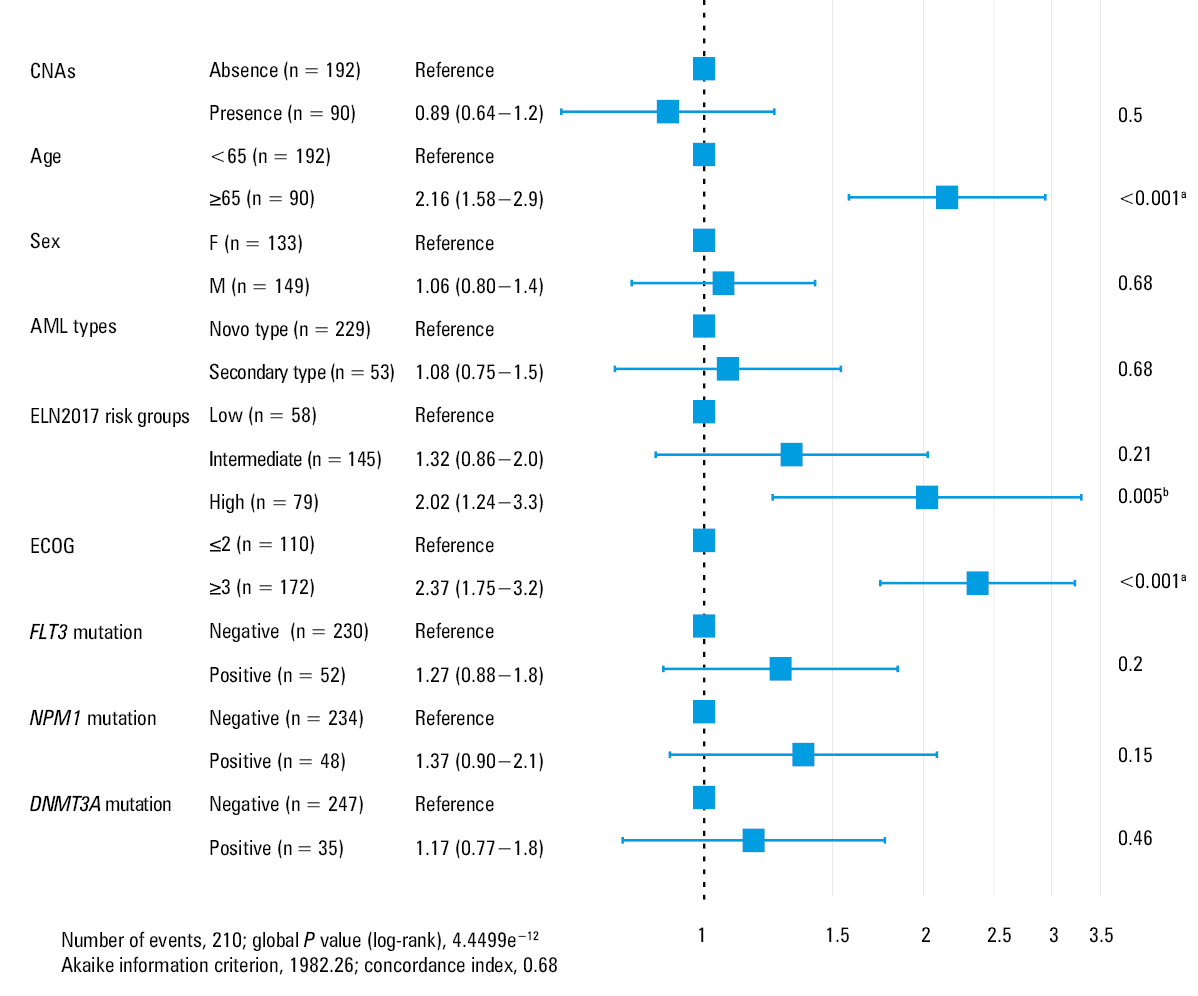
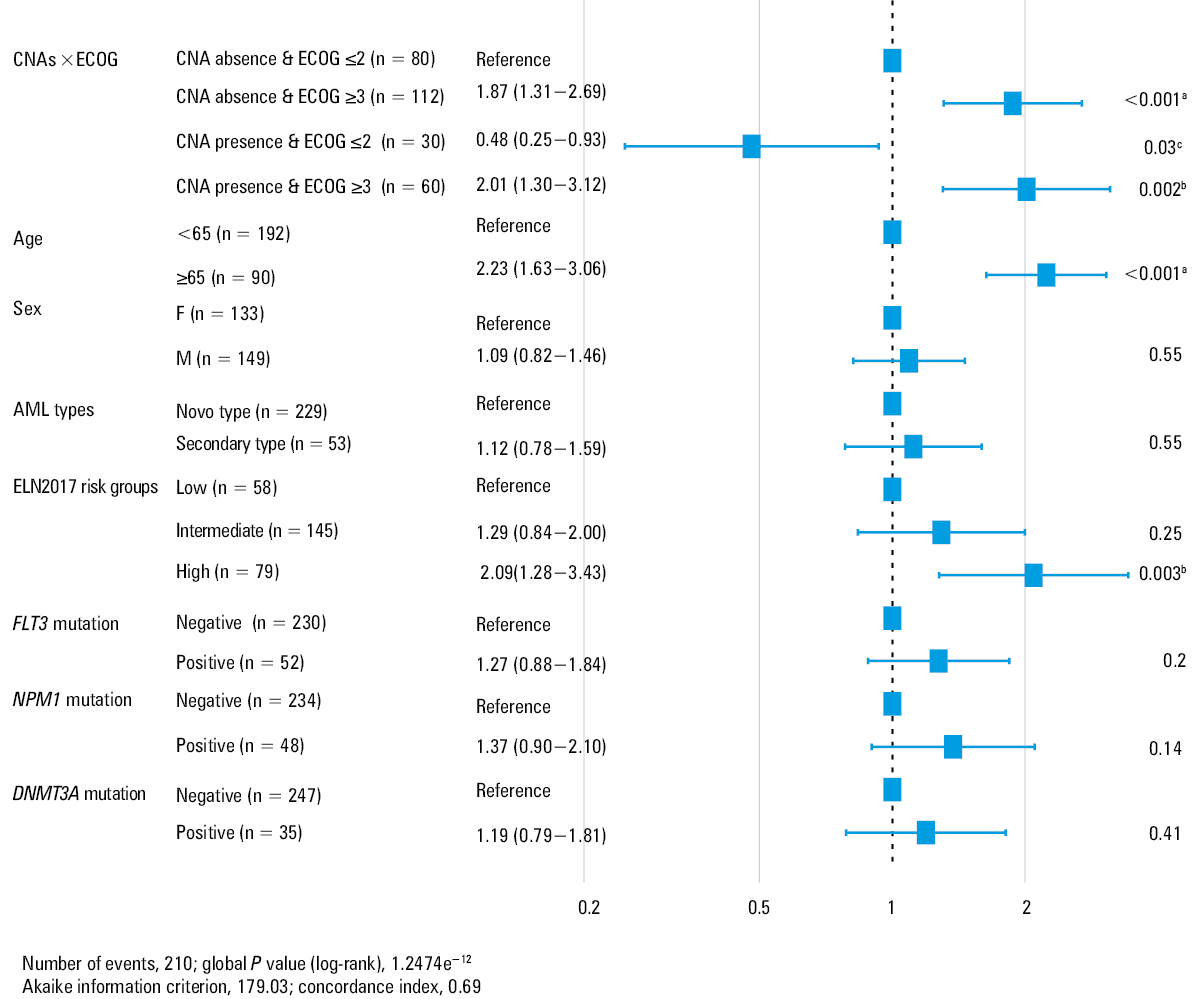
After we defined the main model, we tested the 2‑way interactions between CNAs and each of the variables included in the main model. The significance was shown only for the interaction between CNAs and the ECOG performance status. The results of the likelihood ratio test (LR χ2) comparing the 2 models were significant, indicating that the addition of the interaction term improved the goodness to fit: LR χ2 = 5.23, df = 1, P = 0.02. The interaction effect model showed that CNAs significantly interacted with the ECOG status: HRinteraction was 2.24 (95% CI, 1.09–4.57), P = 0.02.
For patients with the ECOG grade 2 or lower, the presence of CNAs was associated with a decreased risk of death (HR, 0.48; 95% CI, 0.25–0.93), while for patients with the grade of 3 or higher, the presence of CNAs was associated with an increased risk of death (HR = 1.07 obtained from HRinteraction = 2.23). In Figure 2, we presented HRs for death for all subgroups determined by the presence of at least 1 out of 2 factors (ECOG, CNAs), with patients without CNAs and ECOG of less than 3 as the reference group (eg, patients with CNAs and ECOG ≥3 had an HR of 2.2 in comparison with patients without CNAs and ECOG <3; patients with ECOG ≥3 and without CNAs had an HR of 1.87 in comparison with patients without CNAs and ECOG <3).
Combination of copy number aberrations, somatic mutations, and overall survival
Patients with AML and the FLT3 ITD mutation had a lower OS than those with no FLT3 ITD mutation (median OS, 3 months vs 8 months; P = 0.001 in the log‑rank test). No difference in OS was found regarding the presence of the FLT3 D835 mutation (P = 0.59) or NPM1 and DNMT3A mutations (P >0.05). Patients with and without the FLT3 mutation (the presence of D835, ITD, or both) had a similar median OS (5 and 7 months, respectively; P = 0.06). We observed a trend towards an increased risk of death in AML patients with the FLT3 mutation (HR, 1.38; 95% CI, 0.98–1.94).
We found no differences in the survival rate in the subgroups of patients defined by the combination of CNAs (presence or absence) with each somatic mutation (FLT3, NPM1, or DNMT3A). The Kaplan–Meier curves generated using the 3 pairs of variables were similar for patients with CNAs (P = 0.20 for CNAs+FLT3, P = 0.5 for CNAs+NPM1, and P = 0.4 for CNAs+DNMT3A) to those without CNAs and the above mutations. Similar results were obtained for patients with at least 2 CNAs (P = 0.5 for FLT3, P = 0.3 for DNMT3A, and P = 0.4 for NPM1).
We also found a significant difference in the survival rate in the subgroups of patients defined by the CNAs and the type of mutated status associated with the presence of FLT3, NPM1, and DNMT3A gene mutations (P = 0.03). The post hoc analysis for comparison of the Kaplan–Meier survival curves generated using 8 pairs of variables showed a difference in OS in patients without CNAs and triple mutational status versus those with no CNAs and no mutational status (PFDR = 0.046).
Discussion
The application of MLPA in the evaluation of acute leukemia has been described in several studies performed in relatively small patient cohorts.10-14 We evaluated CNAs by the MLPA method in patients with AML, providing the first such data in a representative Romanian population. Of the 283 patients with AML, the presence of CNAs was identified in 90 samples. The frequency of CNAs was lower than that reported by Kim et al24 in a small Korean population of patients with AML (23 patients [76.7%] with copy number variations) but higher than that identified in a Finnish study (15% of cases presented with cryptic CNAs).25 Nibourel et al12 detected CNAs by genome‑wide single nucleotide polymorphism array analysis in about 50% of the 367 patients with AML. They suggested that the identification of CNAs at diagnosis might have important clinical significance for risk stratification in patients with AML in whom the cytogenetic analysis was not performed or was inconclusive. The difference between the presented results might be explained by the different methods used for identification of the aberrations and by various ethnic groups included in the studies.
We also investigated the differences in the OS according to the demographic and clinical features, but no significant associations were observed between OS and sex (P = 0.54) or AML subtype (de novo, secondary, or therapy‑related, P = 0.18). In the present study, survival was similar in patients with AML with and without CNAs, which is in line with the findings reported by Wang et al26 in patients with myelodysplastic syndromes. A shorter survival was observed in patients with the presence of all somatic mutations but without CNAs. In line with our findings, low complete remission rates and shorter OS have been recently reported by El Gammal et al27 in patients with AML with the FLT3 and DNMT3A mutations. Similarly, it was reported that the presence of concomitant FLT3 ITD and DNMT3A R882 mutations in patients with AML is an unfavorable prognostic factor.28-30 In this study, we identified a significant association of CNAs with the FLT3 D835 mutation, but not with age, WBC and platelet counts, LDH and hemoglobin levels, blast percentage, or the ECOG performance status.
We observed no significant associations between the presence or an increasing number of CNAs and the OS. This may be explained by a relatively small size of our study sample. We showed that the age above 65 years had a significant negative effect on the OS in patients with AML. Our results are in line with a study by Roloff et al,31 who reported that age at diagnosis is one of the most powerful predictors of survival in patients with AML. Bănescu et al32 also showed that the age of 65 years or older had a negative influence on the OS.32
Our analysis of the unadjusted prognostic impact of clinical factors on survival revealed a significantly shorter OS in patients older than 65 years, with high LDH levels at diagnosis (≥600 IU/l), and with the FLT3 ITD mutation. An association between the FLT3 mutation in patients with AML and shorter survival (P <0.001) was previously reported in a smaller group of patients.33
In our study, the univariate regression analysis showed a significant association between ELN high‑risk group and death in patients with AML. Moreover, we found that the LDH level of 600 IU/l or higher and the ECOG grades 3 and 4 were significantly associated with mortality.
In the multivariable Cox model including an interaction between the high ECOG performance status and the presence of CNAs, the variables identified to be independent predictors of death were age above 65 years, ELN high‑risk category, and the ECOG grades 3 and 4. In a study on 194 patients with newly diagnosed AML, Wass et al34 suggested that comorbidities as well as the ECOG grade higher than 2 in addition to age had an impact on survival in older patients (≥60 years, P = 0.042). It was reported that patients older than 60years and with ELN high‑risk category (adverse or poor prognosis category according to the ELN 2017 risk stratification system) had a much shorter survival (the 3‑year OS was about 4%).1,8
Our findings revealed that the effect of ECOG performance status on the OS was modified by the presence of CNAs: in patients without CNAs and with the ECOG grade 3 or 4, the risk of death was 1.87‑fold higher than in patients without CNAs and the ECOG grade of 2 or lower, while in patients with CNAs and the ECOG grade of at least 3, the risk of death was 4.17‑fold higher than in patients with CNAs and the ECOG grade of 2 or lower.
Our results regarding the differences in the OS according to the clinical and biological features (WBC and PLT counts, hemoglobin and LDH levels, blast percentage) were in line with a recent study that showed a negative association between the OS and the ECOG grade of 2 or higher, PLT count lower than 40000 cells/mm3, and LDH levels at diagnosis of 600 IU/l or higher.32 Our findings revealed an association between the ELN risk category and OS (P = 0.02): patients in the high‑risk category had the shortest median OS (4 months), followed by those with the intermediate‑risk category (7 months) and the low‑risk category (12 months).
Recently, it has been reported that the MLPA technique is highly specific for establishing the molecular karyotype and for revealing the gains or losses of the chromosomes, but it requires at least 20% of cells with chromosomal abnormalities of the total population in a sample.35,36 Our study showed that MLPA is a useful method for screening for recurrent CNAs, and, as shown previously,37 it can be used as a first‑tier test at diagnosis in patients with AML, especially that certain CNAs may help clinicians predict the prognosis of AML. It is also a useful technique for unraveling cryptic and recurrent CNAs, which are used for classification and risk stratification of AML.
To the best of our knowledge, this is the first study that investigated the utility of MLPA, the frequency of CNAs, as well as the association of CNAs with ELN high‑risk category, somatic mutations, and other biological features in a large number of patients with AML. However, our study has several limitations. First, the karyotype was not successfully performed in all patients. Second, we were unable to perform array comparative genomic hybridization analysis (considering that MLPA might not identify low levels of cell clones and balanced rearrangements).
In conclusion, the presence of CNAs, identified by MLPA, was associated with the FLT3 D835 mutation but not with other recurrent somatic mutations (FLT3 ITD, NPM1, and DNMT3A), age, or other clinical features of AML patients. Patients with AML with CNAs and the ECOG grade of 3 or higher have an increased risk of death, and the presence of CNAs may modify the effect of the ECOG performance status on the OS. Independent predictors of mortality in patients with AML are age, ELN high‑risk category, and the ECOG grade 3 and 4. Further studies are needed to confirm the usefulness of the MLPA technique for detecting CNAs as well as their association with the FLT3 gene mutation and the risk of death.
- Döhner H, Estey E, Grimwade D, et al. Diagnosis and management of AML in adults: 2017 ELN recommendations from an international expert panel. Blood. 2017; 129: 424‑447. | Crossref
- Bănescu C, Iancu M, Trifa AP, et al. From Six gene polymorphisms of the antioxidant system, only GPX Pro198Leu and GSTP1 Ile105Val modulate the risk of acute myeloid leukemia. Oxid Med Cell Longev. 2016; 2016: 2536705. | Crossref
- Arber DA, Orazi A, Hasserjian R, et al. The 2016 revision to the World Health Organization classification of myeloid neoplasms and acute leukemia. Blood. 2016; 127: 2391‑2405. | Crossref
- Putowski M, Podgórniak M, Piróg M, et al. Prognostic impact of NOTCH1, MYD88, and SF3B1 mutations in Polish patients with chronic lymphocytic leukemia. Pol Arch Intern Med. 2017; 127: 238‑244. | Crossref
- Chilton L, Harrison CJ, Ashworth I, et al. Clinical relevance of failed and missing cytogenetic analysis in acute myeloid leukemia. Leukemia. 2017; 31: 1234‑1237. | Crossref
ARTICLE INFORMATION