Trends in antithrombotic management of patients with atrial fibrillation. A report from the Polish part of the EURObservational Research Programme – Atrial Fibrillation General Long-Term Registry
Key words: antithrombotic therapy, atrial fibrillation, non-vitamin K antagonist oral anticoagulants, vitamin K antagonists


 CC BY-NC-SA 4.0
Trends in antithrombotic management of patients with atrial fibrillation. A report from the Polish part of the EURObservational Research Programme – Atrial Fibrillation General Long-Term Registry
Introduction: Data on antithrombotic treatment among patients with atrial fibrillation (AF) in Poland are limited.
Objectives: We aimed to describe antithrombotic management within the Polish part of the EUROobservational Research Programme on Atrial Fibrillation General Long‑Term Registry.
Patients and methods: We analyzed data collected at baseline and at 1‑year follow‑up from 701 Polish patients treated at 25 Polish centers between 2013 and 2016.
Results: Any antithrombotic therapy was administered to 94% of patients (vitamin K antagonists [VKAs], 53%; non‑VKA oral anticoagulants [NOACs], 36%; antiplatelet therapy [APT], 4.8%). However, 78% of patients considered as “low‑risk” (CHA2DS2-VASc = 0 in men or 1 in women) were prescribed oral anticoagulants and 12% were on APT. Independent predictors of NOAC and VKA use were first‑detected AF and device therapy. Predictors of VKA use were lone AF, history of ischemic stroke, and pulmonary embolism or deep vein thrombosis; of NOAC use, permanent AF; of APT use, history of hemorrhagic events and first‑detected or persistent AF; and of no antithrombotic treatment, young age. Incorrect NOAC prescription was more common in the reduced‑dose group than in the full‑dose group (30% vs 7%). During follow‑up, the all‑cause mortality rate was 5.2%, 0.8%, 15%, and 7% (P <0.0001) and the risk of thromboembolic events was 0.4%, 0.5%, 6.2%, and 0% (P = 0.04) in patients on VKA, NOAC, APT, and no treatment, respectively.
Conclusions: Patients with the lowest stroke risk are often overtreated. The choice of proper antithrombotic strategy does not depend solely on factors incorporated in the CHA2DS2-VASc score. Higher mortality is observed among APT‑treated patients and those without antithrombotic treatment.
What's new?
The analysis of the Polish part of EURObservational Research Programme on Atrial Fibrillation General Long‑Term Registry provides an overview of atrial fibrillation management in Poland. Treatment with antithrombotic drugs had a high frequency and was associated with various clinical features. Patients with the lowest risk of stroke (CHA2DS2-VASc = 0) were often overprescribed or received an inappropriate dose of antithrombotic drugs. One‑year follow‑up revealed an overall low occurrence of thromboembolic and hemorrhagic events, although mortality remains high, especially among patients treated with antiplatelet therapy alone or those without antithrombotic treatment.
Introduction
Atrial fibrillation (AF) is the most common arrhythmia in clinical practice and is associated with a significant risk of morbidity and mortality, mainly due to an increased risk of stroke and systemic embolism.1 Prevention of embolism with oral anticoagulation (OAC) is recommended for AF patients with at least 1 risk factor for stroke (ie, a CHA2DS2-VASc score of ≥1 in men or ≥2 in women).2-4
Randomized controlled trials are considered the gold‑standard method to evaluate the effectiveness and safety of simple therapeutic interventions such as OAC. However, clinical trials have limited generalizability because they are performed in conditions that differ from routine clinical practice.5,6 In consequence, recommended OAC may be underused in a significant proportion of patients, but antithrombotic drugs can be also overprescribed in many patients.7-9
There are limited data on contemporary antithrombotic treatment of patients with AF in Poland. Therefore, we aimed to describe antithrombotic management within the Polish part of the EURObservational Research Programme Atrial Fibrillation (EORP‑AF) General Long‑Term Registry. Moreover, we evaluated associations between patients’ clinical characteristics and drug choice as well as between the type of antithrombotic management and long‑term outcomes.
Patients and methods
Study population
Data reported herein are based on the results calculated for Polish participants of the EORP‑AF Long‑Term General registry, which was conducted from 2013 to 2016. The methodology of this registry was described previously.10 In brief, the aim of the registry was to assess the rate of complications related to AF across Europe in order to confirm adherence of cardiologists to the 2012 recommendations of the European Cardiac Society (ESC) on the treatment of AF.3 The registry population consisted of consecutive patients presenting to cardiologists with AF as the main or comorbid condition. Additionally, patients included in the registry had to have AF within the last year, as recorded on electrocardiography, but they did not need to be in arrhythmia at the time of enrollment. Finally, 701 consecutive patients from 25 Polish centers were included in the registry. Participating investigator sites presented a broad range of medical care units (tertiary, secondary, general hospitals, and outpatient clinics). The registry schedule assumed 1 baseline visit and 1 visit per year over a 3‑year follow‑up, but only data collected at baseline and at 1 year were included in this analysis.
Appropriateness of non–vitamin K antagonist oral anticoagulant dosing
A prescription was reported as inappropriate if the patient met at least 1 inappropriate dosing criterion according to the ESC guideline for AF and the summary of product characteristics as registered with the European Medicine Agency.11 The dosing criteria that were used to evaluate the appropriateness of the prescriptions are summarized in Supplementary material (Table S1). Prescriptions that were classified as inappropriate solely based on a missing value or multiple missing values were reported as “unknown inappropriateness.”
Ethical approval
The registry was approved by local ethical review boards according to the regulations of each participating country. The study was performed according to the European Union Note for Guidance on Good Clinical Practice CPMP/ECH/135/95 and the Declaration of Helsinki. A signed informed consent was obtained from each patient after providing detailed information on the registry.10
Statistical analysis
Data were presented as a median and interquartile range or number of patients and percentages, as appropriate. The statistical significance of differences was analyzed using the Kruskal–Wallis test. Frequencies of parameters or events were compared using the χ2 test or Fisher exact test, as appropriate. For all tests, a P value of less than 0.05 was considered significant. To determine predictors of different type of antithrombotic management, univariable and multivariable logistic regression analyses were performed. Statistical analysis was performed with StatsModels: Statistic in Python – v0.10.1 documentation (Seabold, Skipper, and Josef Perktold. “Statsmodels: Econometric and statistical modeling with Python.” Proceedings of the 9th Python in Science Conference 2010).
Results
Baseline characteristics
Of the 701 patients enrolled, 10 were excluded due to missing data on antithrombotic treatment (Supplementary material, Figure S1). Any antithrombotic regimens were administered during study enrollment to 94% of Polish patients. Vitamin K antagonists (VKAs) were the most commonly prescribed antithrombotic drugs, followed by non‑VKA oral anticoagulants (NOACs), whereas antiplatelet therapy (APT) was administered only to a small fraction of Polish patients (53%, 36%, and 4.8%, respectively). Patients receiving various regimens of antithrombotic treatment differed with respect to several baseline characteristics. Those on APT were older, had a greater prevalence of coronary artery disease (mainly in the form of myocardial infarction), more often had a history of heart failure, current malignancy, as well as more often were diagnosed with first‑detected or permanent AF as compared with the remaining patients. Patients on NOACs more often had persistent AF and hypertension, whereas those without antithrombotic treatment more often had lone AF as compared with the other groups. The median CHA2DS2-VASc and HAS‑BLED scores were higher in patients treated with APT (Table 1). Both patients treated with reduced doses of rivaroxaban and dabigatran were characterized by older age, more often were female, more often had coronary artery disease, and had higher thromboembolic or bleeding risk compared with those on full NOAC doses (Table 2). Detailed characteristics of patients with AF treated with different antithrombotic regimens are presented in Supplementary material, Table S2, while detailed characteristics of rivaroxaban- and dabigatran‑treated groups (both using standard and reduced doses) are shown in Supplementary material, Table S3.
Variable | VKA (n = 366) | NOAC (n = 249) | APT (n = 33) | No antithrombotic therapy (n = 43) | P value |
Data are presented as number (percentage) of patients unless otherwise indicated. Number provided after the semicolon indicates the total number of patients available for that variable.
Abbreviations: APT, antiplatelet therapy; CAD, coronary artery disease; CHA2DS2-VASc, congestive heart failure, hypertension, age ≥75 years, diabetes mellitus, history of stroke or thromboembolism, vascular disease, age 65 to 74 years, female sex; CRT, cardiac resynchronization therapy; ICD, implantable cardioverter‑defibrillator; IQR, interquartile range; HAS‑BLED, hypertension, abnormal renal/liver function, stroke, bleeding history or predisposition, labile international normalized ratio, elderly, drugs/alcohol concomitantly; MI, myocardial infraction; NOAC, non–vitamin K antagonist oral anticoagulants; OAC, oral anticoagulation; PCI, percutaneous coronary intervention; PM, pacemaker; PTCA, percutaneous transluminal coronary angioplasty; VKA, vitamin K antagonist | |||||
Demographics | |||||
Age, y, median (IQR) | 67 (61–74) | 68 (61–76) | 73 (63–80) | 68 (51–73) | 0.07 |
Female sex, n (%) | 156 (43) | 110 (44) | 11 (33) | 17 (40) | 0.67 |
Atrial fibrillation | |||||
First‑diagnosed | 10 (2.7); 365 | 24 (9.6); 248 | 5 (15) | 2 (4.7) | <0.0001 |
Paroxysmal | 107 (29); 365 | 80 (32); 248 | 10 (30) | 20 (46) | 0.14 |
Long‑standing persistent | 38 (10); 365 | 20 (8); 248 | 1 (3) | 3 (7) | 0.43 |
Persistent | 67 (18); 365 | 67 (27); 248 | 1 (3) | 5 (12) | 0.001 |
Permanent | 143 (39); 365 | 57 (23); 248 | 16 (49) | 13 (30) | <0.0001 |
Lone | 18 (4.9) | 20 (8) | 3 (9.1) | 10 (23) | <0.0001 |
Concomitant diseases and interventions | |||||
Hypertension | 208 (57); 364 | 157 (64); 247 | 16 (49); 32 | 17 (40) | 0.02 |
CAD | 135 (39); 350 | 80 (34); 237 | 21 (64) | 8 (21); 39 | 0.001 |
Previous MI | 66 (19); 350 | 32 (14); 237 | 15 (46) | 5 (13); 39 | <0.0001 |
Previous PCI/PTCA | 65 (19); 350 | 28 (12); 237 | 12 (36) | 3 (7.7); 39 | 0.001 |
Heart failure | 201 (55); 364 | 107 (43); 247 | 24 (73) | 18 (42) | 0.001 |
Dilated cardiomyopathy | 35 (9.6); 364 | 14 (5.6); 245 | 3 (9.1) | 3 (7) | 0.37 |
Hypertrophic cardiomyopathy | 11 (3); 364 | 2 (0.8); 245 | 0 | 2 (4.7) | 0.15 |
Restrictive cardiomyopathy | 0; 364 | 0; 245 | 0 | 1 (2.3) | 0.002 |
Device therapy (PM/CRT/ICD) | 88 (24); 361 | 27 (11); 248 | 7 (21) | 4 (10); 39 | <0.0001 |
Previous thromboembolic events | 52 (14); 363 | 23 (9.2) | 3 (9.1) | 2 (4.7) | 0.08 |
Hemorrhagic events | 23 (6); 364 | 19 (7.6); 248 | 8 (24) | 6 (14) | 0.001 |
Current malignancy | 4 (1.1); 360 | 2 (0.8) | 2 (6.1) | 2 (4.7) | 0.03 |
Thromboembolic and bleeding risk, median (IQR) | |||||
CHA2DS2-VASc score | 3 (2–4) | 3 (2–4) | 4 (3–6) | 3 (1–3) | 0.01 |
HAS‑BLED score | 1.5 (1–2) | 1 (0–2) | 2 (1–3) | 1 (0–2) | 0.02 |
Variable | Rivaroxaban | Dabigatran | P value | ||
Standard (n = 65) | Reduced (n = 24) | Standard (n = 114) | Reduced (n = 46) | ||
Data are presented as number (percentage) of patients unless otherwise indicated. Number provided after the semicolon indicates the total number of patients for that variable.
Abbreviations: CKD, chronic kidney disease; others, see Table 1 | |||||
Demographic data | |||||
Age, y, median (IQR) | 67 (62–73) | 80 (75–84) | 64 (57–71) | 78 (70–83) | <0.0001 |
Female sex | 26 (40) | 15 (63) | 44 (39) | 25 (54) | 0.02 |
Atrial fibrillation | |||||
First‑diagnosed | 6 (9.2); 64 | 2 (8.3) | 14 (12) | 2 (4.3) | 0.28 |
Paroxysmal | 24 (37); 64 | 9 (38) | 34 (30) | 13 (28) | 0.61 |
Long‑standing persistent | 5 (7.7); 64 | 2 (8.3) | 11 (9.6) | 2 (4.3) | 0.47 |
Persistent | 9 (14); 64 | 2 (8.3) | 43 (38) | 13 (28) | 0.001 |
Permanent | 20 (31); 64 | 9 (38) | 12 (11) | 16 (35) | <0.0001 |
Lone | 4 (6.2) | 0 | 14 (12) | 2 (4.3) | 0.15 |
Concomitant diseases and interventions | |||||
CAD | 24 (38); 63 | 12 (55); 22 | 24 (21); 108 | 20 (44); 44 | 0.001 |
Previous MI | 5 (7.7); 63 | 6 (25); 22 | 10 (8.8); 108 | 11 (24); 44 | 0.003 |
Previous PCI/PTCA | 5 (7.7); 63 | 5 (23); 22 | 9 (7.9); 108 | 9 (20); 44 | 0.03 |
Angina | 16 (25); 63 | 8 (36); 22 | 5 (4.4); 108 | 10 (22); 44 | <0.0001 |
Valvular alterations moderate/severe | 21 (32); 64 | 14 (58) | 20 (18); 111 | 16 (35) | 0.001 |
Previous thromboembolic events | 2 (3.1) | 1 (4.2) | 16 (14) | 4 (8.7) | 0.14 |
Hemorrhagic events | 4 (6.2); 64 | 2 (8.3) | 7 (6.1) | 6 (13) | 0.26 |
CKD | 3 (4.6) | 5 (21) | 12 (11) | 18 (39) | <0.0001 |
Thromboembolic and bleeding risk, median (IQR) | |||||
CHA2DS2-VASc score | 3 (2–4) | 4 (3–5) | 2 (1–4) | 4 (3–5) | <0.0001 |
HAS‑BLED score | 1 (0–2) | 2 (1–2) | 1 (0–2) | 2 (1–2) | 0.001 |
Thromboembolic risk, bleeding risk, and antithrombotic therapy
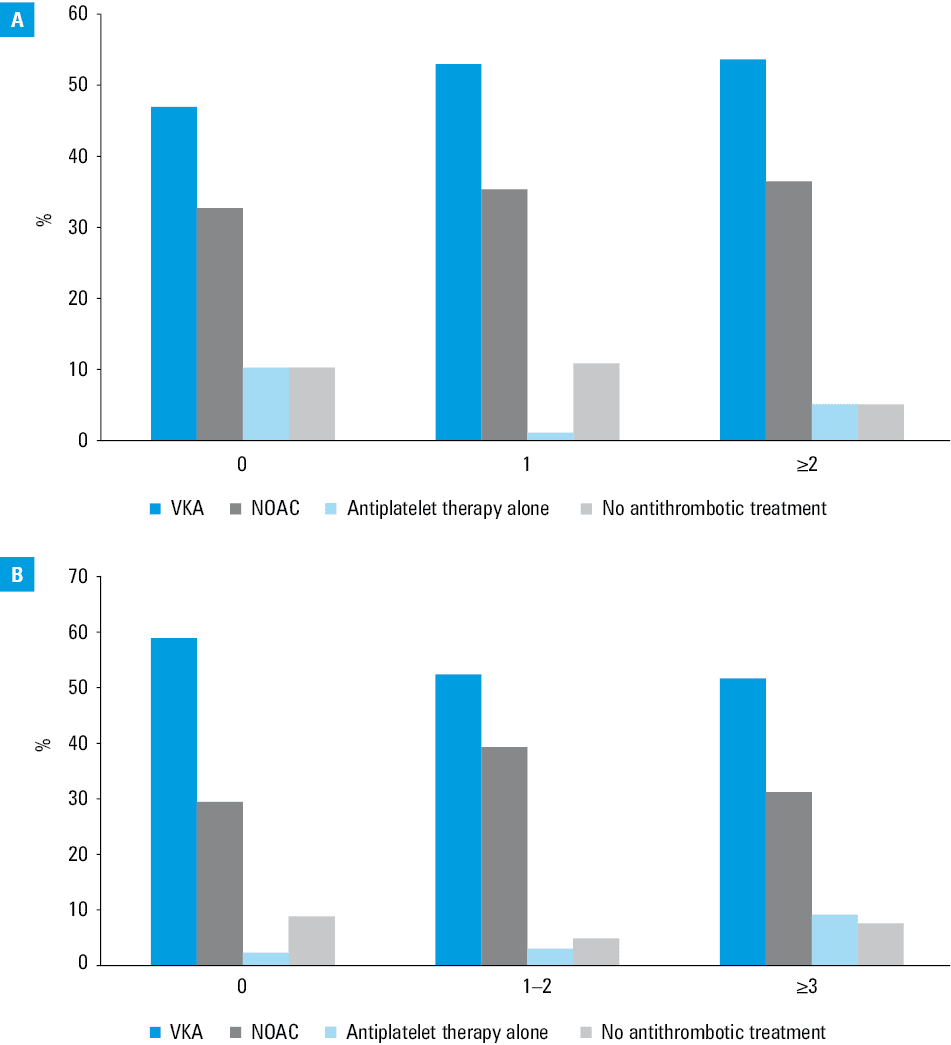
The use of different antithrombotic strategies stratified by CHA2DS2-VASc and HAS‑BLED scores is shown in Figure 1. Almost 95% of patients with indications (CHA2DS2-VASc ≥2) were treated with antithrombotic drugs (including VKAs, NOACs, and APT). One‑fifth of patients with indications who received antithrombotic treatment and one‑fourth of those who, despite indications, did not receive any antithrombotic drugs were at high risk of bleeding (HAS‑BLED >3) (Supplementary material, Table S4). However, still 78% of Polish patients who were considered “low‑risk” (CHA2DS2-VASc = 0), were prescribed anticoagulation and 12% were receiving APT (Figure 1). In our study, 30% of patients were prescribed lower doses of NOACs despite indications for a standard dose, whereas 7% of patients were prescribed full instead of reduced NOAC doses (Supplementary material, Figure S2).
Predictors of oral antithrombotic drug use
The predictors of the use of particular antithrombotic drugs are demonstrated in Table 3. Independent predictors of the use of both NOACs and VKAs were first‑diagnosed AF and device therapy. Additionally, lone AF, history of ischemic stroke, and pulmonary embolism or deep vein thrombosis turned out to be predictors of VKA use, whereas permanent AF was a predictor of NOAC use. History of hemorrhagic events as well as first‑diagnosed and persistent AF were all predictive for choosing APT, whereas young age predicted refraining from any antithrombotic treatment.
Variable | Univariable analysis | Multivariable analysis | ||||
OR | 95% CI | P value | OR | 95% CI | P value | |
Abbreviations: AF, atrial fibrillation; DVT, deep vein thrombosis; OR, odds ratio; others, see Table 1 | ||||||
Predictors of NOAC use | ||||||
First‑diagnosed AF | 2.66 | 1.4–5.07 | 0.003 | 1.97 | 1.00–3.84 | 0.047 |
Permanent AF | 0.46 | 0.32–0.66 | <0.0001 | 0.58 | 0.39–0.88 | 0.01 |
Device therapy (PM/CRT/ICD) | 0.41 | 0.26–0.65 | <0.0001 | 0.51 | 0.31–0.84 | 0.008 |
Predictors of VKA use | ||||||
Lone AF | 0.46 | 0.25–0.83 | 0.01 | 0.49 | 0.27–0.88 | 0.02 |
Ischemic stroke | 2.20 | 1.18–4.11 | 0.01 | 4.34 | 1.31–14.45 | 0.02 |
Pulmonary embolism/DVT | 9.15 | 1.17–71.89 | 0.04 | 23.06 | 2.29–231.85 | 0.008 |
First‑diagnosed AF | 0.27 | 0.13–0.55 | <0.0001 | 0.33 | 0.16–0.68 | 0.003 |
Device therapy (PM/CRT/ICD) | 2.38 | 1.57–3.61 | <0.0001 | 1.91 | 1.24–2.95 | 0.003 |
Predictors of APT use | ||||||
Hemorrhagic events | 4.24 | 1.81–9.93 | 0.001 | 0.24 | 0.11–0.53 | <0.0001 |
First‑diagnosed AF | 3.09 | 1.12–8.46 | 0.03 | 0.14 | 0.05–0.36 | <0.0001 |
Persistent AF | 0.12 | 0.02–0.86 | 0.04 | 0.01 | 0.01–0.06 | <0.0001 |
Predictors of no antithrombotic treatment | ||||||
Age (every 10 years) | 0.76 | 0.62–0.94 | 0.01 | 0.96 | 0.95–0.87 | <0.0001 |
One‑year outcomes
During 1‑year follow‑up, of the 691 patients enrolled, 176 patients had withdrawn their consent or were lost to follow‑up and 29 patients died. One‑year all‑cause mortality rates were 5.2%, 0.8%, 15%, and 7% for patients on VKA, NOAC, APT, and no antithrombotic treatment, respectively (P <0.0001). Most patients died from a cardiovascular cause (sudden cardiac death or heart failure). All patients treated with APT or who were on no antithrombotic treatment who died during follow‑up had indications for OAC (CHA2DS2-VASc >2). Patients without antithrombotic treatment were more often subjected to cardiovascular interventions (mainly a valvular surgery), and those on APT, to thromboembolic events during follow‑up. No significant differences between all analyzed groups were observed regarding rhythm control interventions and reasons for hospital admissions except more frequent general practitioner visits in the case of patients without antithrombotic treatment. Moreover, APT‑treated patients more often experienced thromboembolic and noncardiovascular events as compared with the remaining groups (Tables 4 and 5). According to patients on NOACs, there were no significant differences in long‑term outcomes between the type of a NOAC as well as between standard or reduced doses (Tables 6 and 7). During the 1‑year follow‑up, some patients were switched from one to another antithrombotic regimen, as shown in Supplementary material, Figure S1. Among patients without any antithrombotic treatment on enrollment, during 1‑year follow‑up, 9 patients were started on VKAs; 6 patients, on NOACs (mainly dabigatran); and 1 patient, on APT. Among the patients treated at baseline with NOACs, 10 were switched to VKAs (9 patients to dabigatran and 1 patient to rivaroxaban) or discontinued treatment (8 patients on dabigatran and 10 patients on rivaroxaban). On the other hand, 22 patients treated with VKAs were switched to NOACs (11 patients to dabigatran and 11 to rivaroxaban), and 3 patients, to APT. In the APT group, the majority of patients who were initially treated with APT and switched to another treatment, changed APT to VKA (5 patients).
Variable | VKA (n = 366) | NOAC (n = 249) | APT (n = 33) | No antithrombotic treatment (n = 43) | P value |
Data are presented as number (percentage) of patients unless otherwise indicated.
Abbreviations: see Table 1 | |||||
Follow‑up completed | 253 (69) | 187 (75) | 18 (55) | 28 (65) | 0.06 |
Death | 19 (5.2) | 2 (0.8) | 5 (15) | 3 (7) | <0.0001 |
Withdrawn consent/lost to follow‑up | 94 (26) | 60 (24) | 10 (30) | 12 (28) | 0.86 |
Variable | VKA (n = 253) | NOAC (n = 187) | APT (n = 18) | No antithrombotic treatment (n = 28) | P value |
Data are presented as number (percentage) of patients unless otherwise indicated. Number provided after the semicolon indicates the total number of patients for that variable.
Abbreviations: ACS, acute coronary syndrome; AFl, atrial flutter; AT, atrial tachycardia; CABG, coronary artery bypass graft; CV, cardiovascular; GP, general practitioner; LAAO, left atrial appendage occlusion; others, see Tables 1–3 | |||||
Clinical visits for CV reasons during follow‑up | |||||
Cardiology visits | 208 (90); 232 | 147 (81); 182 | 13 (81); 16 | 19 (76); 25 | 0.04 |
Emergency room admissions | 34 (15); 234 | 28 (15); 184 | 2 (13); 16 | 3 (12); 26 | 0.96 |
GP visits | 167 (74); 225 | 148 (86); 172 | 11 (73); 15 | 22 (96); 23 | 0.006 |
CV interventions | |||||
Overall | 26 (11); 239 | 5 (2.7); 184 | 2 (13); 16 | 3 (12); 26 | 0.01 |
PCI/PTCA | 5 (2.1); 239 | 4 (2.2); 184 | 0 (0); 16 | 1 (3.8); 26 | 0.87 |
CABG | 4 (1.7); 239 | 0 (0); 184 | 1 (6.2); 16 | 0 (0); 26 | 0.07 |
LAAO | 2 (0.8); 239 | 0 (0); 184 | 0 (0); 16 | 0 (0); 26 | 0.59 |
Transcatheter valve intervention | 2 (0.8); 239 | 0 (0); 184 | 0 (0); 16 | 0 (0); 26 | 0.59 |
Valvular surgery | 13 (5.4); 239 | 0 (0); 184 | 1 (6.2); 16 | 2 (7.7); 26 | 0.01 |
Heart transplant | 0 (0); 239 | 0 (0); 184 | 0 (0); 16 | 0 (0); 26 | 1.00 |
Other | 4 (1.7); 239 | 1 (0.5); 184 | 0 (0); 16 | 0 (0); 25 | 0.63 |
Reasons for hospital admission | |||||
AF/AFl/AT | 19 (8.2); 233 | 26 (14); 181 | 0 (0); 16 | 4 (15); 26 | 0.09 |
Thromboembolic events | 1 (0.4); 241 | 1 (0.5); 183 | 1 (6.2); 16 | 0 (0); 26 | 0.04 |
Hemorrhagic events | 3 (1.2); 241 | 3 (1.6); 183 | 0 (0); 16 | 0 (0); 26 | 0.87 |
ACS | 4 (1.7); 241 | 2 (1.1); 183 | 0 (0); 16 | 0 (0); 26 | 0.83 |
Overall CV events | 28 (12); 240 | 16 (8.7); 183 | 4 (25); 16 | 0 (0); 26 | 0.054 |
Non‑CV events | 8 (3.3); 240 | 15 (8.2); 183 | 3 (19); 16 | 1 (3.8); 26 | 0.02 |
Rhythm control interventions and device therapy | |||||
Pharmacological cardioversion | 11 (4.8); 231 | 11 (6.2); 178 | 0 (0); 16 | 1 (4.2); 24 | 0.71 |
Electrical cardioversion | 14 (6); 233 | 18 (10); 180 | 0 (0); 16 | 2 (8); 25 | 0.30 |
Catheter ablation for AF | 5 (2.2); 231 | 7 (3.9); 180 | 0 (0); 16 | 1 (4); 25 | 0.65 |
Catheter ablation for AFl | 1 (0.4); 232 | 1 (0.6); 180 | 0 (0); 16 | 1 (4); 25 | 0.21 |
AF surgery | 2 (0.8); 233 | 0 (0); 180 | 0 (0); 16 | 0 (0); 25 | 0.59 |
Device therapy (PM/ICD/CRT) | 7 (3); 233 | 5 (2.2); 180 | 0 (0); 16 | 1 (4); 25 | 0.84 |
Variable | Rivaroxaban (n = 89) | Dabigatran (n = 160) | P value | ||
Standard (n = 65) | Reduced (n = 24) | Standard (n = 114) | Reduced (n = 46) | ||
Data are presented as number (percentage) of patients unless otherwise indicated. | |||||
Death | 1 (1.5) | 0 (0) | 0 (0) | 1 (2.2) | 0.45 |
Follow‑up completed | 46 (71) | 17 (71) | 87 (76) | 37 (80) | 0.64 |
Withdrawn consent/lost to follow‑up | 18 (28) | 7 (29) | 27 (24) | 8 (17) | 0.59 |
Variable | Rivaroxaban (n = 63) | Dabigatran (n = 124) | P value | ||
Standard (n = 46) | Reduced (n = 17) | Standard (n = 87) | Reduced (n = 37) | ||
Data are presented as number (percentage) of patients unless otherwise indicated. Number provided after the semicolon indicates the total number of patients for that variable.
Abbreviations: see Tables 1–3 and 5 | |||||
Cardiology visits | 38 (83); 44 | 12 (75); 16 | 71 (84); 85 | 26 (70) | 0.24 |
Emergency room admissions | 10 (23); 44 | 4 (24) | 13 (15); 86 | 1 (2.7) | 0.06 |
GP visits | 35 (83); 42 | 14 (100) | 68 (84); 81 | 31(89); 35 | 0.39 |
CV interventions | |||||
Overall | 2 (4.5); 44 | 1 (5.9) | 1 (1.2); 86 | 1 (2.7) | 0.58 |
PCI/PTCA | 1 (2.3); 44 | 1 (5.9) | 1 (1.2); 86 | 1 (2.7) | 0.67 |
CABG | 0 (0); 44 | 0 (0) | 0 (0); 86 | 0 (0) | 1.00 |
LAAO | 0 (0); 44 | 0 (0) | 0 (0); 86 | 0 (0) | 1.00 |
Transcatheter valve intervention | 0 (0); 44 | 0 (0) | 0 (0); 86 | 0 (0) | 1.00 |
Valvular surgery | 0 (0); 44 | 0 (0) | 0 (0); 86 | 0 (0) | 1.00 |
Heart transplant | 0 (0); 44 | 0 (0) | 0 (0); 86 | 0 (0) | 1.00 |
Other | 1 (2.3); 44 | 0 (0) | 0 (0); 86 | 0 (0) | 0.36 |
Reasons for hospital admission | |||||
AF/AFl/AT | 6 (14); 44 | 0 (0) | 15 (18); 84 | 5 (14); 36 | 0.30 |
Thromboembolic events | 0 (0); 44 | 0 (0) | 1 (1.2); 85 | 0 (0) | 0.76 |
Hemorrhagic events | 2 (4.5); 44 | 0 (0) | 1 (1.2); 85 | 0 (0) | 0.35 |
ACS | 0 (0); 44 | 0 (0) | 1 (1.2); 85 | 1 (2.7) | 0.67 |
Overall CV events | 3 (6.8); 44 | 0 (0) | 9 (11); 85 | 4 (11) | 0.50 |
Non‑CV events | 7 (16); 44 | 1 (5.9) | 4 (4.7); 85 | 3 (8.1) | 0.18 |
Rhythm control interventions and device therapy | |||||
Overall | 8 (17) | 1 (5.9) | 20 (22) | 4 (12) | 0.36 |
Pharmacological cardioversion | 3 (7); 43 | 1 (6.2); 16 | 7 (8.3); 84 | 0 (0); 35 | 0.39 |
Electrical cardioversion | 2(4.5); 44 | 1 (6.2); 16 | 14 (17); 85 | 1 (2.9); 35 | 0.06 |
Catheter ablation for AF | 2 (4.5); 44 | 0 (0); 16 | 4 (4.7); 85 | 1 (2.9); 35 | 0.84 |
Catheter ablation for AFl | 0 (0); 44 | 0 (0); 16 | 0 (0); 85 | 1 (2.9); 35 | 0.19 |
AF surgery | 0 (0); 44 | 0 (0); 16 | 0 (0); 85 | 0 (0); 35 | 1 |
Device therapy (PM/ICD/CRT) | 1 (2.2); 44 | 0 (0); 16 | 3 (3.5); 85 | 1 (2.9); 35 | 0.56 |
Discussion
The EORP‑AF General Long‑Term registry provides an important view on contemporary antithrombotic strategies used in Polish patients with AF. There are several major findings of the present study. First, our country‑specific registry data suggest overuse of antithrombotic treatment in a significant proportion of patients at low risk of stroke or systemic embolism. Second, physicians’ clinical assessment of stroke risk and the subsequent choice of proper AF management appear to incorporate also factors beyond those included in the CHA2DS2-VASc score. Third, there is no association between the type of appropriate antithrombotic management (VKAs or NOACs) and long‑term thromboembolic and hemorrhagic outcomes in AF patients; however, higher mortality is observed among patients treated with APT only or those without antithrombotic treatment.
For decades, VKAs were the only available OAC therapy in patients with AF, reducing the risk of stroke by almost two‑thirds.12 The introduction of NOACs in 2010 changed the landscape of stroke prevention in AF. Indeed, the proportion of incident OAC users for NOACs increased rapidly from 8.1% in the fourth quarter of 2010 to 78.9% in the first quarter of 2017 and surpassed that of VKAs in the third quarter of 2013.13 In our study, among AF patients who received OAC, 41% and 59% were treated with NOACs and VKAs, respectively. It is in line with data from the CRAFT study (Multicentre Experience in AFib Patients Treated with OAC), which was recruiting Polish patients with AF at a similar period of time (2011–2016), in which 44% and 56% of patients were prescribed NOACs and VKAs, respectively.14
Even though the presented findings may seem outdated as a rapid increase in the NOAC use has changed trends in prescription patterns for anticoagulants with a consensual decrease of antiplatelet drugs, they strengthen the concept that OAC use has significantly reduced risk for thromboembolic complications, without an excess of bleeding complications in real‑life AF population. Obviously, our results do not allow to reconsider the role of APT in thromboembolic risk management but highlight the role of antiplatelet drugs in the management of concomitant vascular disease, which is often reported in AF patients.
In recent years, contemporary ESC guidelines have recommended prophylaxis with antithrombotic agents in people with AF and at least 1 other risk factor for stroke.15-17 However, a discordance between AF guideline recommendations,3,4,18,19 educational and organizational barriers in the implementation of guideline‑recommended AF,20 as well as anticoagulant prescription patterns has been reported in various international studies.21-25 The current study assessed adherence of cardiologists to the 2012 ESC recommendations as it was conducted in the years 2013 to 2016. According to those guidelines, anticoagulation was recommended in patients with a CHA2DS2-VASc score of 2 or higher and assigned a IIa A recommendation in patients with a CHA2DS2-VASc score of 1. Anticoagulation was not recommended in patients with a CHA2DS2-VASc score of 0 (I A); however, it was only not considered (IIa B) in female patients without any additional risk factors.
The current 2016 ESC guidelines4 strengthen the usefulness of the CHA2DS2-VASc score for predicting thromboembolic risk. Anticoagulation is not recommended in patients with a CHA2DS2-VASc score of 0, even in women (III A). Anticoagulation is assigned a IIa B recommendation in men and women with a single stroke risk factor and a I A recommendation in men with 2 or more risk factors and women with at least 3 risk factors. Thus, the female sex is no longer considered an independent risk factor when indications for anticoagulation are being assessed.
Two important differences regarding antithrombotic treatment in comparison with previous ESC guidelines (2012) are a clear declaration of preference for NOACs over VKAs (I A) and the fact that APT is no more recommended for stroke prevention in AF patients, regardless of stroke risk (III A). Interestingly, the recommendation for a switch to a NOAC when inadequate control of the international normalized ratio is achieved with a VKA was changed from I B in the 2012 guidelines to IIb A in the 2016 guidelines.
Compared with our results, in the whole EORP‑AF General Long‑Term registry, 42.1% of AF patients were treated with VKAs, 32.8% with NOACs, 7% with APT, and 6.1% received no antithrombotic treatment. The registry reported a low occurrence of thromboembolic and hemorrhagic events, although mortality was high. All‑cause death more often occurred in APT‑treated patients (8.8%) as compared with those on no antithrombotic therapy (5.1%), those on VKAs (4.8%), and those on NOACs (3.2%), which is in line with our results. Both VKAs and NOACs were associated with a lower risk of all main adverse outcomes, similarly to our study.26
Based on our study, there is still some overuse of antithrombotic treatment observed in real‑life patients with AF. Nearly 78% of patients with a CHA2DS2-VASc score of 0 in men and of 1 in women, who are considered “low‑risk”, received OAC, including 12% who received APT. This overuse pattern of anticoagulation is higher than that reported in such registries as GARFIELD (Global Anticoagulant Registry in the Field; 38.7%), Euro Heart (49.0%), or PREFER (Prevention of Thromboembolic Events – European Registry; 62.5% of ineligible patients received OAC). Almost 95% of patients with indications for anticoagulation (CHA2DS2-VASc ≥2) were taking at least 1 OAC, which suggests a better adherence to recommendations for OAC, as compared with the above studies (ie, GARFIELD, 59.3%; Euro Heart, 67%; PREFER, 85.6% of eligible patients received OAC).6-8 Compared with previous data from EORP‑AF Pilot where 65% of Polish patients with indications (CHA2DS2-VASc >2) and 67% of those without indications (CHA2DS2-VASc = 0) were prescribed OACs,27 our results demonstrate a clear trend towards more frequent OAC prescription. Also, APT was less frequently prescribed in patients at high risk of thromboembolic event (but still), as compared with previous studies.6,7
Recent studies have demonstrated a strong association between APT and an increased risk of all‑cause mortality.28,29 Vazquez et al29 reported that aspirin monotherapy was associated with a 66% increased likelihood of mortality. Our study also demonstrated that patients on APT were at higher risk of mortality and thromboembolic events as compared with other antithrombotic groups, even with patients on no antithrombotic treatment. Our finding of higher mortality in patients on no antithrombotic treatment is in line with previous studies.30,31
Despite differences in the mortality rate and thromboembolic events between study groups, there were no significant differences in terms of hemorrhagic events during follow‑up. This is in line with the results from the BLED‑AC study (Bleeding Effected by Direct Oral Anticoagulants), which demonstrated that among patients with OAC‑related hemorrhage, in‑hospital mortality was lower among patients with NOAC- than among those with VKA‑associated bleeding events (9.8% vs 15.2%). However, no significant differences in the risk of 30‑day mortality (12.6% vs 16.3%) was observed between groups.32
In our study, 30% of patients were prescribed lower doses of NOACs despite indications for a standard dose, whereas 7% of patients were prescribed full instead of reduced doses. This trend was more notable among patients prescribed rivaroxaban (Supplementary material, Table S1 and Figure S2). This is in line with previous studies.33,34 The absence of indications for NOAC dose reduction was identified in 16.4% of patients receiving reduced‑dose NOACs, as demonstrated by Jelonek et al.35 Steinberg et al30 found that 9.4% of patients receiving NOACs were underdosed and 3.4% received an inappropriately high dose. Importantly, they showed that over- and underdosing was associated with an increased risk of bleeding and cardiovascular events, respectively.30 A Danish registry reported no significant difference in the risk of stroke or other thromboembolic events between standard and reduced doses of NOAC.36
Our data indicate that physicians’ clinical judgment of stroke risk appears to incorporate factors beyond those included in the CHA2DS2-VASc score. In our study, patients were considered eligible for antithrombotic treatment not only on the basis of recommended factors such as the history of thromboembolic or hemorrhagic events and elderly age but also the type of AF. Similarly, a higher adjusted probability for prescription of OAC treatment in the GLORIA‑AF registry was found in patients with nonparoxysmal AF, previous stroke or transient ischemic attack, and those aged 65 years or older.37 On the other hand, younger age, heart failure, and history of embolic disease were significant predictors of OAC treatment in a study by Bista et al.38
Limitations of the study
The major limitation of our study was the lack of a significant part of data either because patients were lost to follow‑up or data were missing in the database. Moreover, registry‑based studies such as this are limited by numerous other shortcomings, including selection bias (patients included by cardiologists only) or inclusion of nonconsecutive patients (no log‑book). Consequently, our results should be interpreted with caution when attempting to extend them to the general AF population, as AF patients are often under the care of noncardiologists.
Compliance with treatment recommendations among patients with the lowest stroke risk remains suboptimal. The choice of proper antithrombotic strategy does not depend solely on factors incorporated into the guideline‑recommended scales but also on physicians’ and patients’ preference. There is no association between the type of appropriate antithrombotic management (VKAs or NOACs) and long‑term thromboembolic or hemorrhagic outcomes among AF patients; however, higher mortality was observed among those treated with APT alone and those without antithrombotic treatment.
- Lip G, Freedman B, De Caterina R, Potpara TS. Stroke prevention in atrial fibrillation: past, present and future. Comparing the guidelines and practical decision‑making. Thromb Haemost. 2017; 117: 1230‑1239. | Crossref
- Lip GYH, Banerjee A, Boriani G, et al. Antithrombotic therapy for atrial fibrillation: CHEST guideline and expert panel report. Chest. 2018; 154: 1121‑1201. | Crossref
- Camm AJ, Lip GY, De Caterina R, et al. 2012 focused update of the ESC Guidelines for the management of atrial fibrillation: an update of the 2010 ESC Guidelines for the management of atrial fibrillation. Developed with the special contribution of the European Heart Rhythm Association. Eur Heart J. 2012; 33: 2719‑2747.
- Kirchhof P, Benussi S, Kotecha D, et al. 2016 ESC Guidelines for the management of atrial fibrillation developed in collaboration with EACTS. Eur J Cardiothorac Surg. 2016; 50: e1‑e88. | Crossref
- Freedman B, Lip GY. “Unreal world” or “real world” data in oral anticoagulant treatment of atrial fibrillation. Thromb Haemost. 2016; 116: 587‑589. | Crossref
SUPPLEMENTARY MATERIAL
ARTICLE INFORMATION