Terra incognita: clinically suspected myocarditis in a patient with severe acute respiratory syndrome coronavirus 2 infection


 CC BY-NC-SA 4.0
Terra incognita: clinically suspected myocarditis in a patient with severe acute respiratory syndrome coronavirus 2 infection
The emerging outbreak of coronavirus disease 2019 (COVID‑19) was declared a pandemic by the World Health Organization on March 11, 2020.1 So far, there have been scarce data concerning cardiovascular involvement due to COVID‑19.2 Even though respiratory tract signs mostly characterize the clinical course of severe acute respiratory syndrome coronavirus 2 (SARS‑CoV‑2) infection, cardiac complications, such as myocarditis, may also occur alone.3 In this article, we present a patient whose clinical presentation raised our suspicion for underlying myocarditis.
A 74‑year‑old man with a recent history of normal left ventricular ejection fraction of 55% was admitted to the hospital due to hemodynamically unstable new‑onset ventricular tachycardia (VT) lasting 12 hours (Supplementary material, Figure S1A and S1B). After unsuccessful self‑administration of metoprolol, 200 mg orally, arrhythmia was managed with electrical cardioversion. Subsequently, symptomatic bradycardia and hypotension were observed. The patient did not present with fever or any symptoms of respiratory infection.
The patient had a history of atrial fibrillation, catheter ablation performed 3 times, arterial hypertension, type 2 diabetes, and hypothyroidism. As a medical professional, the patient might have been exposed to SARS‑CoV‑2.
On the following day, next episodes of VT occurred. Serum electrolytes and thyroid hormone levels were within normal limits. Overdrive pacing with a rate of 95 pulses per minute, magnesium infusion, and intravenous amiodarone stabilized the rhythm. On the third day of hospitalization, the temporary pacemaker was removed, and follow‑up examination did not reveal any VT recurrence.
The patient’s laboratory findings were as follows: neutrophil‑to‑lymphocyte ratio higher than 3 (reference range, 1–3), elevated levels of high‑sensitivity cardiac troponin T, from 72 ng/l to 102 ng/l (reference range <14 ng/l), dynamically evolving C‑reactive protein levels, from 1.2 mg/l to 1.8 mg/l and 94 mg/l (reference range <6 mg/l), elevated levels of N‑terminal fragment of the prohormone brain natriuretic peptide, 2451 ng/l (reference range <125 ng/l), lactic acid dehydrogenase, 369 U/l (reference range, 80–240 U/l), D‑dimers, 1.39 mg/l (reference range <0.5 mg/l), aspartate aminotransferase, 159 U/l (reference range <45 U/l), alanine aminotransferase, 163 U/l (reference range <35 U/l), but procalcitonin levels (reference range <0.05 ng/ml) were normal. Due to suggestive laboratory results, particularly in the light of the COVID‑19 outbreak,2,4 a reverse transcription–polymerase chain reaction test for SARS‑CoV‑2 was performed on the sixth day of hospitalization and yielded a positive result. Consequently, the patient received a single 500‑mg dose of azithromycin and a single 75‑mg dose of oseltamivir. On day 7, he was transferred in good general condition to a COVID‑19‑specialized hospital for further treatment. On day 17, the patient’s pharyngeal swab specimen was still positive for SARS‑CoV‑2 after the reverse transcription–polymerase chain reaction test, and the man presented no respiratory symptoms.
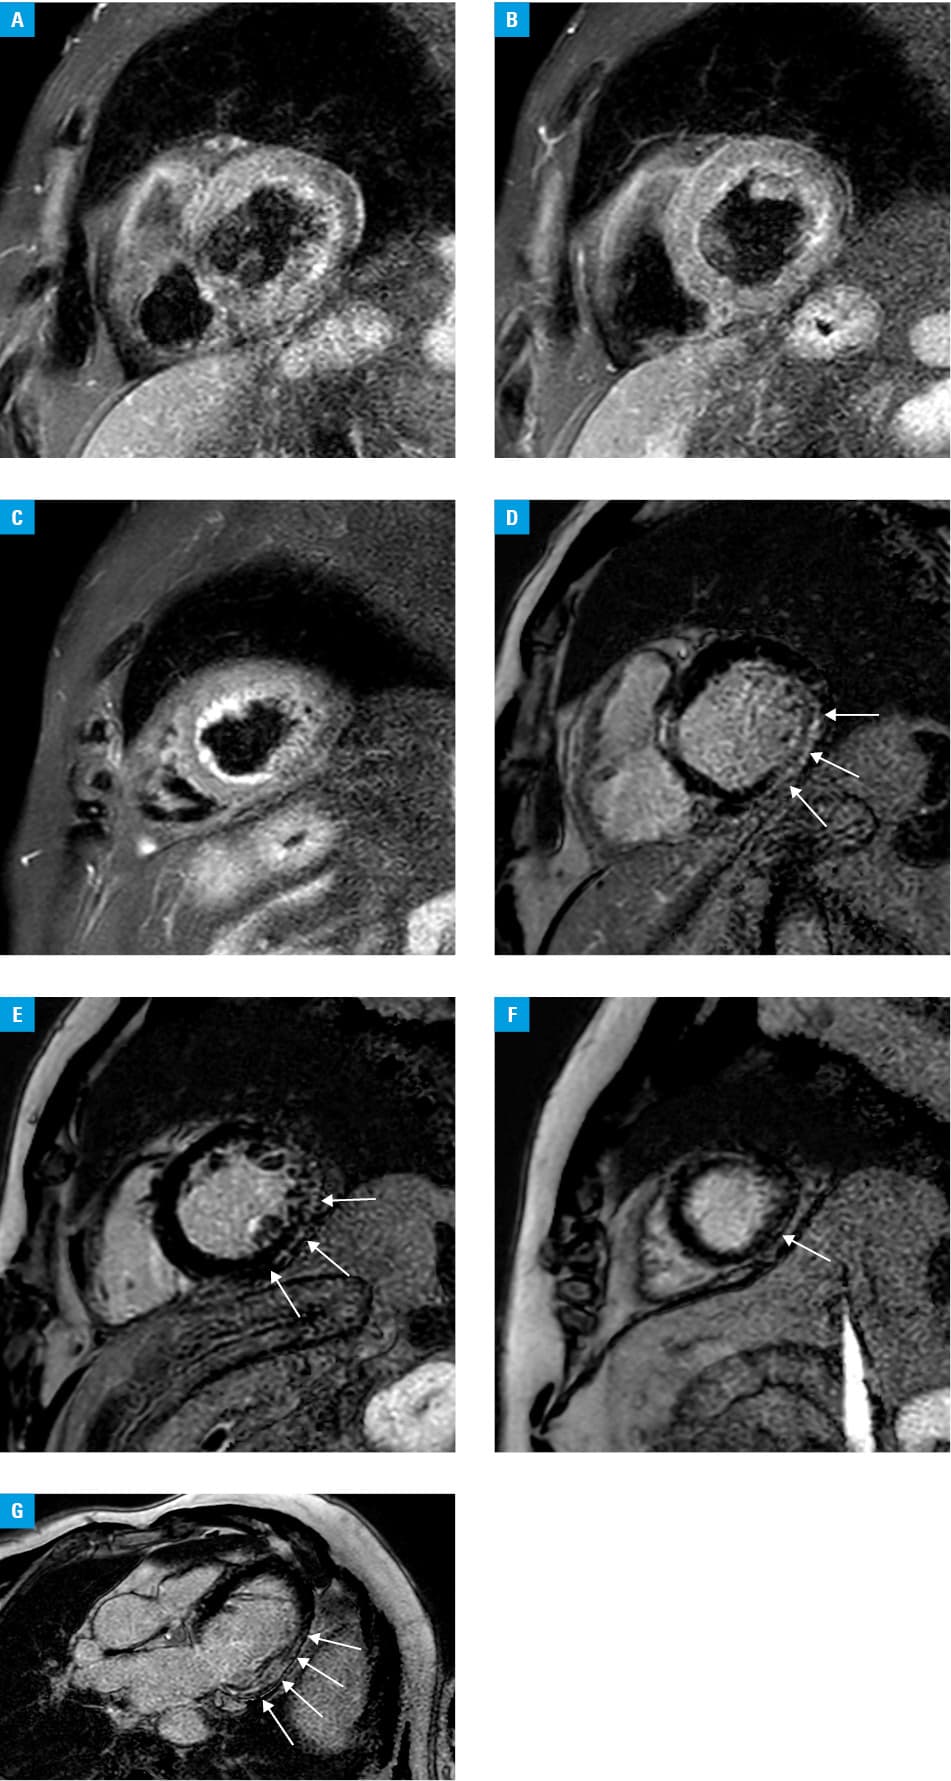
Cardiac magnetic resonance imaging, performed with a 1.5 Tesla scanner, revealed left atrial enlargement and global left ventricular hypokinesia with ejection fraction of 20%. The T2‑weighted sequence did not show myocardial edema (Figure 1A–1C). In contrast, imaging with the use of late gadolinium enhancement demonstrated a large, patchy, and linear nonischemic pattern of fibrosis localized subepicardially and intramurally in the basal and mid‑cavity segments of the inferior and inferolateral wall and in the apical segments of the inferior wall (Figure 1D–1G).
As shown in this case, SARS‑CoV‑2 may cause, apart from COVID‑19‑related pneumonia, acute myocardial injury meeting diagnostic criteria for clinically suspected myocarditis.5
- World Health Organization Director‑General’s opening remarks at the media briefing on COVID‑19 – 11 March 2020. World Health Organization website. https://www.who.int/dg/speeches/detail/who‑director‑general‑s‑opening‑remarks‑at‑the‑media‑briefing‑on‑covid‑19–-11‑march‑2020. Accessed March 12, 2020.
- Zheng YY, Ma YT, Zhang JY, Xie X. COVID‑19 and the cardiovascular system. Nat Rev Cardiol. 2020; 17: 259‑260. | Crossref
- Inciardi RM, Lupi L, Zaccone G, et al. Cardiac involvement in a patient with coronavirus disease 2019 (COVID‑19). JAMA Cardiol. 2020 Mar 27. [Epub ahead of print]. | Crossref
- Zhou F, Yu T, Du R, et al. Clinical course and risk factors for mortality of adult inpatients with COVID‑19 in Wuhan, China: a retrospective cohort study. Lancet. 2020; 395: 1054‑1062. | Crossref
- Caforio AL, Pankuweit S, Arbustini E, et al. Current state of knowledge on aetiology, diagnosis, management, and therapy of myocarditis: a position statement of the European Society of Cardiology Working Group on Myocardial and Pericardial Diseases. Eur Heart J. 2013; 34: 2636‑2648. | Crossref
SUPPLEMENTARY MATERIAL
ARTICLE INFORMATION