A 41‑year‑old man presented to the emergency department due to retrosternal chest pain and dyspnea, which had aggravated on exertion. He was a nonsmoker and denied trauma or drug abuse, but he had a history of HIV infection which was treated with tenofovir, emtricitabine, and efavirenz. Physical examination was unremarkable without Kussmaul sign or prominent jugular veins. Electrocardiogram revealed ST‑segment elevations and PR‑interval depressions in leads I, II, aVL, V3 to V6 with reciprocal ST‑segment depression and PR‑interval elevation in lead aVR corresponding to injury of subepicardial myocardium and atrium. Additionally, small positive deflections in the J‑point region could be detected in leads II, aVL, V5 and V6 (Figure 1A). Laboratory tests showed: leukocytosis (white blood cell count, 13.23 × 10⁹/l; reference range, 4.4–11.3 × 10⁹/l), elevated C‑reactive protein levels (19.1 mg/l; reference range, 0–5 mg/l), and elevated N‑terminal pro‑B‑type natriuretic peptide level (221 pg/ml; reference range, 0–150 pg/ml) without elevated troponin T (7 pg/ml; reference range, 0–14 pg/ml) or D‑dimer (<0.19 mg/l; reference range, 0–0.5 mg/l). Echocardiography showed mild pericardial effusion.
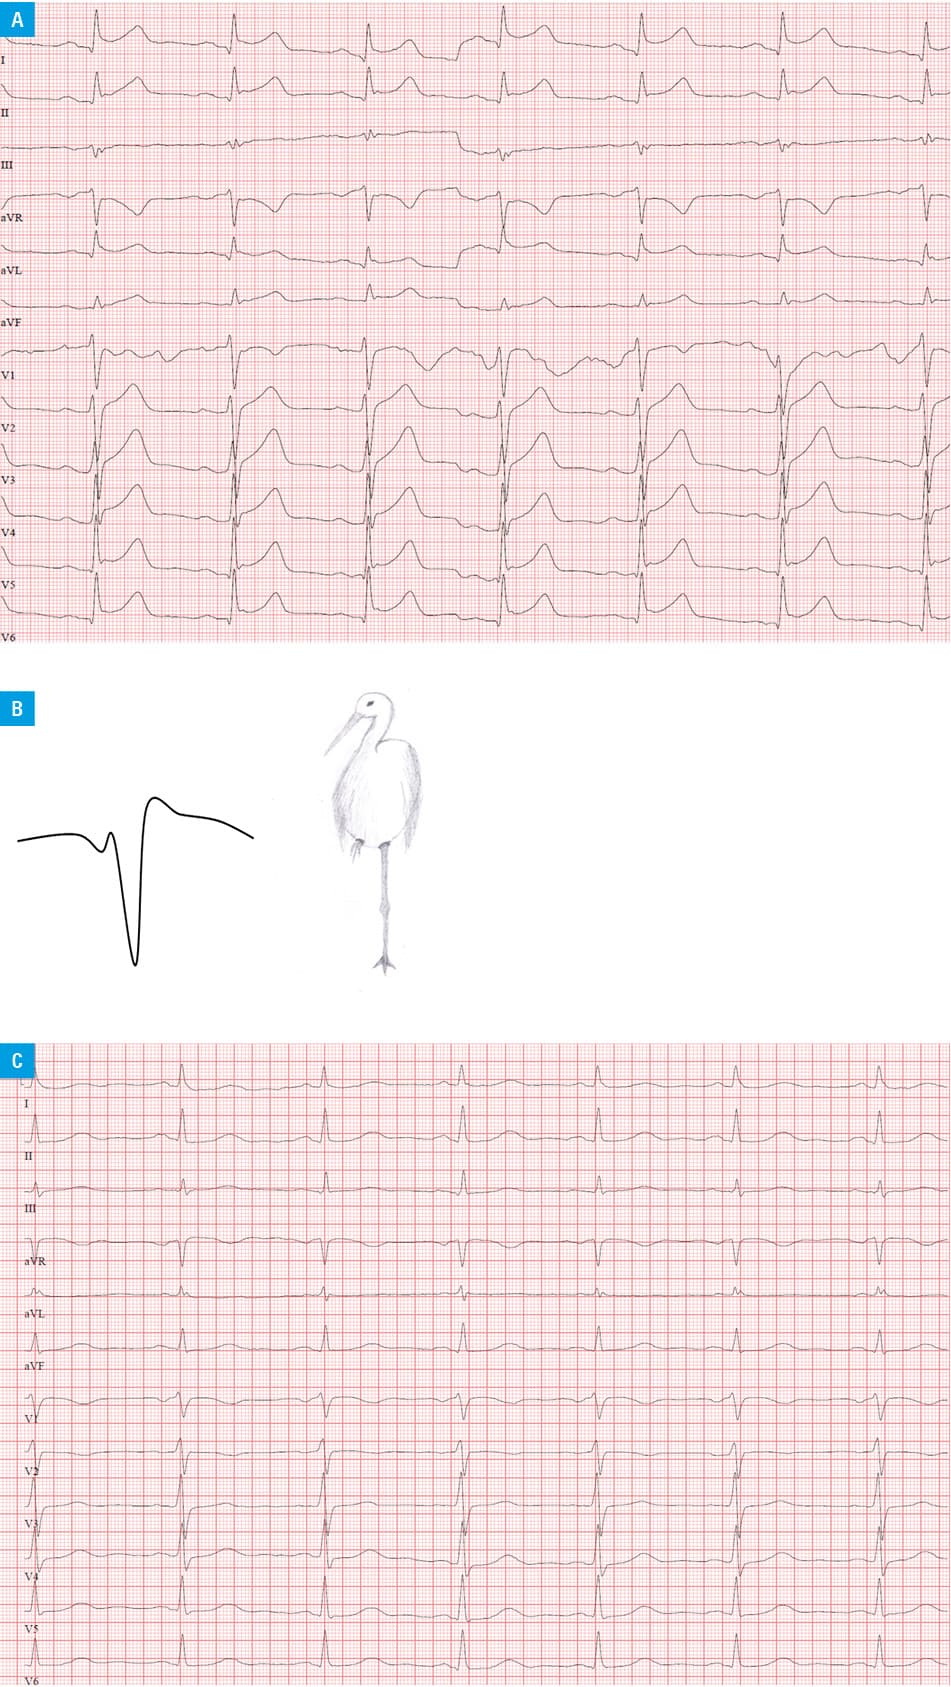
J waves are a manifestation of early repolarization and are sometimes referred to as Osborn waves after their describer who studied the effect of hypothermia on the cardiac function in dogs.1 Besides hypothermia, J waves were described in other conditions such as hypercalcemia, Brugada syndrome, or early repolarization syndrome.2-4 In acute pericarditis, J waves are sometimes referred to as “stork leg sign” due to their pattern if the electrocardiogram is turned 180° whereby the QRS complex looks like a stork standing on one leg (inverted R wave) while the other leg is lifted to the stork’s body (inverted J point deflection) (Figure 1B). After initiation of ibuprofen 600 mg 3 times daily, the patient could be discharged home after 4 days with an uneventful recovery. No J waves were observed anymore on follow‑up electrocardiograms 2 days after initial presentation and 1 month after discharge (Figure 1C).
- Osborn JJ. Experimental hypothermia: respiratory and blood pH changes in relation to cardiac function. Am J Physiol. 1953; 175: 389‑398. | Crossref
- Morales GX, Bodiwala K, Elayi CS. Giant J‑wave (Osborn wave) unrelated to hypothermia. Europace. 2011; 13: 283. | Crossref
- Takagi M, Aonuma K, Sekiguchi Y, et al. The prognostic value of early repolarization (J wave) and ST‑segment morphology after J wave in Brugada syndrome: Multicenter study in Japan. Heart Rhythm. 2013; 10: 533‑539. | Crossref
- Bourier F, Denis A, Cheniti G, et al. Early repolarization syndrome: diagnostic and therapeutic approach. Front Cardiovasc Med. 2018; 5: 169. | Crossref
ARTICLE INFORMATION