Liver volume: a point of no return in liver transplantation?
Key words: computed tomography scans, liver transplantation, liver volume


 CC BY-NC-SA 4.0
Liver volume: a point of no return in liver transplantation?
Introduction: In patients with cirrhosis, only a 75% liver volume (LV) is expected compared with age‑matched healthy individuals. Changes in LV might be an indicator of therapeutic effectiveness or disease progression.
Objectives: To establish whether LV is a prognostic factor in chronic liver disease irrespective of etiology and LV impacts the outcomes of liver transplant (LT).
Patients and methods: In total, 135 consecutive LT recipients were prospectively included in this study: 38 women and 97 men. The median (minimum–maximum) age was 51 (21–70) years; body mass index (BMI), 27.3 (17.3–39.2) kg/m2; Child–Pugh class (CPC), C; Model of End‑Stage Liver Disease (MELD), 16 (7–47) points; and the third lumbar vertebra skeletal muscle index (L3SMI), 47.7 (19.7–73.4) cm2/m2. Liver volume and L3SMI were calculated based on computed tomography scans at listing for LT. The receiver operating characteristic (ROC) curve was analyzed to determine the accuracy of LV in mortality prediction after LT.
Results: Liver volume differed significantly among patients in terms of chronic liver disease etiology, with the lowest values noted in those with hepatitis C virus infection. Liver volume was neither a prognostic factor of disease progression and need for LT with respect to the CPC and MELD scores nor correlated with BMI and L3SMI (P >0.05). The area under the ROC curve of LV in mortality prediction was 0.573 (95% CI, 0.403–0.743). Liver volume smaller than the median tended to be positively associated with the risk of prolonged intensive care unit stay and death (P = 0.057 and P = 0.058, respectively).
Conclusions: Low liver volume did not seem to be a point of no return in LT candidates.
What's new?
The aim of the study was to determine whether liver volume (LV) can be used as a noninvasive tool to predict progression of chronic liver disease and need for liver transplant (LT). The parameter was assessed with respect to the Child‑Pugh class (CPC), the Model of End‑Stage Liver Disease (MELD) score, body mass index, and the surrogate of sarcopenia, namely, the third lumbar vertebra skeletal muscle index (L3SMI). The impact of LV on the post‑LT outcomes of liver graft recipients was also analyzed. Liver volume differed significantly among patients in terms of chronic liver disease etiology. However, there were no correlations between LV and the CPC and the MELD score, as well as body mass index and L3SMI in our study patients. Liver volume was neither a prognostic factor nor a predictor of morbidity and mortality after LT. Thus, LV might not to be a novel prognostic biomarker in LT candidates.
Introduction
Liver cirrhosis is characterized by several alterations affecting the hepatic tissue: fibrotic deposits involving the centrilobular vein, perisinusoidal space, and portal triad; active hepatocellular hyperplasia; and nodular formation with disruption of the normal microvascular architecture of the hepatic sinusoids, leading to progressive derangement of the liver morphology and function. However, Ozaki et al1 noted numerous morphometric changes in liver modeling across various etiologies of cirrhosis.
Liver volumetry is a method used to assess the risk of inducing liver failure in candidates for liver resection prior to hepatectomy for malignancies2 or small‑for‑size syndrome in the recipients of living‑donor grafts.3 However, a smaller liver volume (LV) is observed in advanced liver cirrhosis with an increasing Child–Pugh class (CPC).1,4-6 Additionally, according to Ozaki et al,1 morphometric differences between etiologies would decrease with progression of cirrhosis. In individuals with cirrhosis and portal hypertension, only a 75% LV is expected compared with age‑matched controls.7 Changes in LV over time were suggested to be an indicator of therapeutic effectiveness or liver disease progression.8
The advent of novel direct antiviral agents (DAAs), with a 90% efficacy of sustained viral response (SVR) across all viral genotypes and stages of chronic liver disease, has changed the indications for liver transplant (LT), leading to a significant decrease in the number of patients with decompensated cirrhosis due to hepatitis C virus (HCV) infection on waitlists and an increase in the proportion of the HCV‑positive patients delisted because of clinical improvement.9 In Europe, the improvement in liver function results in delisting one‑third of patients from liver transplant waitlists, a significant reduction in the number of liver transplants, and improvement in 3‑year patient and graft survival after liver transplant.10,11 Moreover, Fitzpatrick et al12 found that LV increased after successful DAA therapy, with the largest LV in patients with HCV infection who achieved SVR. However, the complete reversal of liver decompensation with DAA therapy, which enables patients to avoid LT,14 is reached only in about 30% of those with Child–Pugh class (CPC) B and 10% with CPC C.13 Successful treatment with DAAs reduces the costs of hospitalization and further treatment of patients with HCV infection and CPC A and B, yet not those with CPC C.15
The European Association for the Study of the Liver (EASL) published the HEPAHEALTH Project Report: Risk Factors and the Burden of Liver Disease in Europe and Selected Central Asian Countries,16 reporting an increased incidence of LT in alcoholic liver disease (ALD) and hepatocellular carcinoma (HCC) and a stable number of LTs for autoimmune liver diseases, eg, in primary sclerosing cholangitis (PSC). Compared with other indications, patients with ALD put on the waiting list for transplant are younger than previously and show more advanced liver disease, poorer clinical condition, and a higher risk of death.17 However, no explanation of this observation has been provided yet. The slower decline in listing due to HCC versus decompensated cirrhosis may reflect the higher residual risk for HCC in the cured population (ie, advanced fibrosis with advancing age and diabetes).18
Data are limited regarding the long‑term recovery of liver function after HCV eradication at the most advanced stage of liver disease. Some authors reported improvement in the levels of surrogate markers of liver fibrosis,19 hepatic venous pressure gradient,20 or liver stiffness in liver fibrosis and improvement over time after DAA treatment.21 Others regarded LV as a noninvasive predictor of functional improvement in cirrhotic patients.12,22 Although DAAs considerably reduced liver stiffness and improved liver function, SVR did not reduce the risk of liver decompensation, HCC development, or the increased risk of death during more than 2 years after treatment.21 However, these findings are limited to patients with HCV infection.
Therefore, in this study, we focused on LV as an indicator of a point of no return in liver transplant candidates with cirrhosis of various etiologies. The aim of the study was to establish whether LV is a prognostic factor in chronic liver disease irrespective of the original diagnosis and whether it impacts post‑LT outcomes in liver graft recipients in terms of morbidity and mortality.
Patients and methods
A total of 135 consecutive liver transplant candidates were included in this study: 31 (23%) with HCV infection (12 women and 19 men; median [minimum–maximum] age, 58 [38–67] years), 27 (20%) with HCC‑complicated HCV infection (HCV/HCC) (6 women and 21 men; median [minimum–maximum] age, 60 [47–70]years), 41 (30%) with ALD (6 women and 35 men; median [minimum–maximum] age, 57 [35–66]years), and 36 (27%) with PSC (14 women and 22 men; median [minimum–maximum] age, 30 [20–68]years). In cirrhotic individuals, the median [minimum–maximum] body mass index (BMI) in the study group was 27.3 (17.3–39.2) kg/m2; CPC, C: 10 (7–15) points; MELD score, 23 (6–47) points; and L3SMI, 47.7 (19.7–73.4) cm2/m2. At the time of LT, there were 15 HCV RNA–negative patients out of 31 with HCV cirrhosis, but only 6 out of 27 in the group of individuals with HCV/HCC. Of the patients with HCV/HCC, 50% were classified as CPC A. In the PSC subgroup, only 8 patients (22.2%) had liver cirrhosis. In the remaining study patients, recurrent cholangitis was an indication for LT. All patients were on the waiting list for elective transplant, and the exclusion criteria were acute liver failure and liver re‑transplant. Liver transplants were performed between March 2015 and December 2017. Sixteen patients (11.9%) died during the median (minimum–maximum) follow‑up of 850 (5–1400) days. Selected clinical characteristics of the study group are summarized in Table 1.
Parameter | HCV | ALD | HCV/HCC | PSC | Overall |
Data are presented as median (minimum–maximum).
Abbreviations: ALD, alcoholic liver disease; BMI, body mass index; CPC, Child–Pugh class; HCC, hepatocellular carcinoma; HCV, hepatitis C virus; MELD, Model of End‑Stage Liver Disease; L3SMI, L3 skeletal muscle index; PSC, primary sclerosing cholangitis; NA, not applicable | |||||
Age, y | 57.5 (38–67) | 55 (31–68) | 59.5 (47–70) | 30 (20–68) | 56 (20–70) |
CPC, points | 11 (7–11) | 9 (7–15) | 7 (7–11) | 7 (5–13) | 9 (5–15) |
MELD, points | 20.5 (10–47) | 16.5 (7–42) | 10.5 (6–34) | 15 (6–34) | 16 (6–47) |
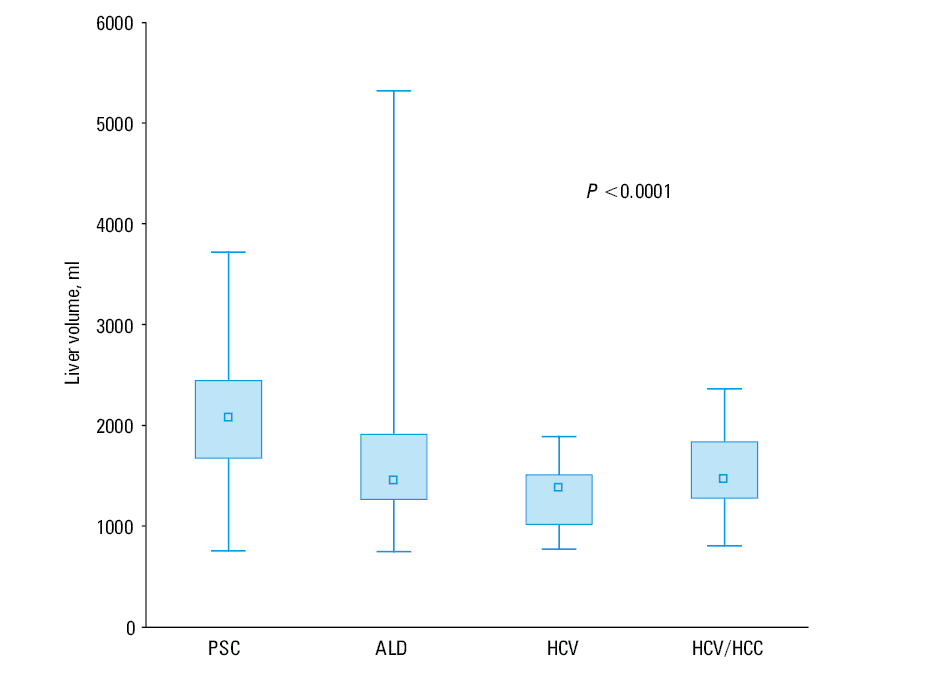
Liver volume, ml | 1373 (768–1886) | 1450 (743–5320) | 1459 (802–2361) | 2079.5 (751–3719) | 1506 (743–5320) |
BMI, kg/m2 | 26.2 (17.3–39.2) | 27.4 (17.8–36.9) | 27.3 (20.4–32.5) | 22.2 (17.7–27.8) | 26.2 (17.3–39.2) |
Weight, kg | 82 (50–120) | 84 (45–120) | 79 (61–106) | 67 (55–96) | 77 (45–120) |
Height, m | 1.7 (1.6–1.9) | 1.8 (1.5–1.9) | 1.8 (1.5–1.9) | 1.8 (1.6–1.9) | 1.8 (1.5–1.9) |
L3SMI, cm2/m2 | 47.6 (19.7–73.4) | 42.3 (29–69.1) | 51.5 (30.2–65.5) | NA | 47.8 (19.7–73.4) |
Liver volumetry
Pretransplant total LV was calculated based on multislice contrast‑enhanced abdominal computed tomography (CT) scans performed at listing for LT as part of patient evaluation at a median (minimum–maximum) time of 55 (1–928) days to surgery. The images were obtained using the Optima CT660 (General Electric HealthCare, Chicago, Illinois, United States) and Aquillion One (Toshiba, Tokio, Japan) multidetector CT scanners. Total LV was calculated from hepatic phase images (around 70 s after contrast injection) obtained and reconstructed in 2.5‑mm‑thick axial planes. A single investigator using the Vitrea Enterprise Suite (Vital, Minnetonka, Minnesota, United States) semiautomatically outlined the liver contour on each slice. Focal liver lesions (eg, hepatocellular carcinoma and cysts), adjacent blood vessels (portal vein, inferior vena cava but not vessels surrounded by the liver parenchyma), and the extrahepatic part of the biliary tract (gallbladder and extrahepatic bile ducts) were not selected. The manufacturer’s software was used to calculate the total LV by multiplying the outlined surface area of each slice by its thickness and summing all the obtained volumes. Volumetry analysis was performed in line with the rules previously described in the literature23 to eliminate the dependence of LV on layer thickness. Reiner et al23 evaluated the reconstruction after CT scanning with a slice thickness of 2 mm and reconstruction interval of 1.5 mm as the reference slice thickness in preoperative volumetry in the portal‑venous contrast phase. They noted that the estimated mean LV decreased with an increase in slice thickness on CT.
Definition of sarcopenia
Computed tomography has been acknowledged by the European Working Group on Sarcopenia in Older People as the gold standard for recognition of low muscle mass.24 Thus, we applied the method proposed by Carey et al.25 In cirrhotic patients with ADL, HCV infection, and HCV/HCC, the superior aspect of the L3 vertebral level was identified on CT and muscles at the L3 level were outlined. The cross‑sectional area of the muscles was semiautomatically measured in square centimeters. After normalization of the L3 skeletal muscle area to individuals’ height, the skeletal muscle index was calculated with the proposed cutoffs of 50cm2/m2 for men and 39cm2/m2 for women to define sarcopenia.24
Ethics
Informed consent was obtained from each patient included in the study. The study protocol was approved by the ethics committee of Medical University of Warsaw (Poland) and conformed with the ethical guidelines of the 1975 Declaration of Helsinki (6th revision, 2008).
Statistical analysis
Data were presented as median (minimum–maximum). Correlations were assessed by a nonparametric test, and the Spearman rank correlation coefficient was used to determine associations between quantitative variables. To assess whether the related subgroups differ significantly, the nonparametric Friedman analysis of variance was applied. The area under the receiver operating characteristic (ROC) curve was presented with 95% CIs. A P value less than 0.05 was considered significant. The Statistica software, version 13 (Dell, Inc., Austin, Texas, United States, United States), was used for data analysis.
Results
In the entire study group, the median (minimum–maximum) LV was 1506 (743–5320) ml: 1465 (743–2434) ml in women and 1559 (802–5320) ml in men. In the analyzed subgroups, the median (minimum–maximum) LV was as follows: 1373 (768–1886) ml in patients with HCV infection, 1450 (743–5320) ml in patients with ALD, 1459 (802–2361) ml in patients with HCV/HCC, and 2080 (751–3791) ml in patients with PSC. In individuals with LV smaller than the median, we found a trend towards the positive association of this parameter value with the risk of prolonged stay at the intensive care unit and death at follow‑up (P = 0.057 and P = 0.058, respectively).
In cirrhotic individuals in the analyzed cohort, the median L3SMI was 47.7 (19.7–73.4) cm2/m2: 48.89 (29.88–73.43) cm2/m2 in men and 42.96 (19.70–55.72) cm2/m2 in women. These results are summarized in Table 2.
Patient group | Liver volume, ml | L3SMI | |
Data are presented as median (minimum–maximum).
Abbreviations: see Table 1 | |||
All patients (n = 135) | Overall | 1506 (743–5320) | 47.6 (19.7–73.4) |
Female sex | 1465.5 (743–2434) | 43 (19.7–55.7) | |
Male sex | 1559 (802–5320) | 49 (29.9–73.4) | |
HCV (n = 31) | Overall | 1373 (768–1886) | 47.6 (19.7–73.4) |
Female sex | 1007.5 (768–1724) | 44.4 (19.7–55.7) | |
Male sex | 1410 (977–1886) | 47.9 (36.6–73.4) | |
HCV/HCC (n = 27) | Overall | 1459 (802–2361) | 51.4 (30.2–65.6) |
Female sex | 1363.5 (850–1676) | 43.5 (30.2–51.6) | |
Male sex | 1459 (802–2361) | 52 (36.1–65.5) | |
ALD (n = 41) | Overall | 1450 (743–5320) | 42.7 (29–69.1) |
Female sex | 1340.5 (743–2085) | 35.1 (29–52) | |
Male sex | 1450 (884–5320) | 43.31 (29.9–69.1) | |
PSC (n = 36) | Overall | 2079.5 (751–3719) | NA |
Females sex | 1592.5 (751–2434) | ||
Male sex | 2537 (1355–3791) | ||
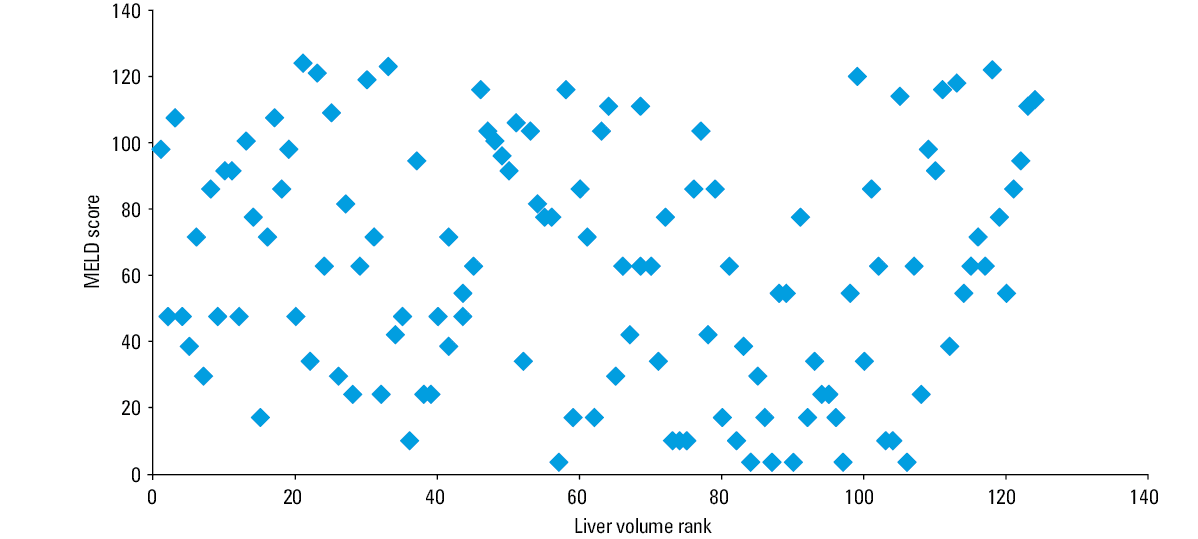
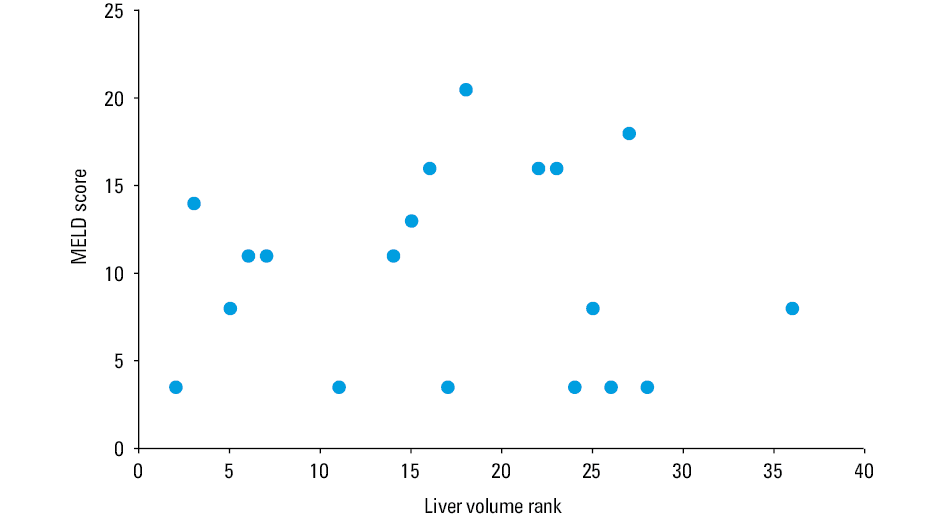
Liver volume differed significantly with respect to chronic liver disease etiology, with the lowest value in individuals with HCV infection and the highest in liver graft recipients with PSC (Figure 1). In the entire cohort, LV neither was a prognostic factor for disease progression or need for LT with respect to the CPC nor correlated with BMI and L3SMI, irrespective of chronic liver disease etiology. We found no correlation between the MELD score and LV in the entire study group (Figure 2). No correlation was also noted between the MELD score and LV in cirrhotic patients with HCV infection, HCV/HCC, and ALD, as well as separately in individuals with PSC (Figure 3). The LV cutoff of 1977 ml, derived from analyses of the ROC curve, performed poorly in predicting mortality: the area under the ROC curve was 0.573 (95%CI, 0.403–0.743; P = 0.39) with a Youden index of 0.26.
Discussion
In this study, we examined a single liver transplant center’s experience with liver volumetry evaluation in chronic liver diseases before liver transplant as a risk factor for liver disease progression, morbidity, and mortality after grafting. We found that patients with liver cirrhosis due to HCV infection had the smallest LV compared with those with PSC. Liver volume was not correlated with liver function assessed with traditional scores or BMI. No correlation with L3SMI was also shown, which might be an indicator of sarcopenia in cirrhotic patients. However, we observed some trends in liver graft recipients with the smallest LV indicating increased morbidity in terms of prolonged stay at the intensive care unit after surgery and an increased risk of death at follow‑up. Thus, this issue might require further studies in a larger cohort of transplant recipients.
The outcomes of liver transplant are attributable to recipients, donors, and procedural characteristics and no simple association can be observed between liver function before LT, evaluated with the MELD score, and post‑transplant outcomes.26 Besides serum and histologic biomarkers, imaging biomarkers predicting the course of chronic liver disease and clinical outcomes have gained increased interest. Therefore, the is an urgent need to define novel prognostic factors before and after grafting and perform transplants in patients who are also older, in poor clinical condition, chronically infected, and have more comorbidities.
Liver fibrosis is a major predictor of liver function and patient survival.27 The hallmarks of liver cirrhosis are widespread fibrosis due to continuous collagen deposition and parenchyma necrosis followed by nodular proliferation of surviving hepatocytes, with consequent disruption of the normal lobular structure. In a comprehensive CT‑based study, Ozaki et al1 showed that liver cirrhosis commonly involved atrophy of the medial and anterior segments and the right lobe and hypertrophy of the lateral segment and the caudate lobe. However, in that study, morphometric changes in cirrhosis were characterized by various patterns depending on the etiology of chronic liver disease. Thus, in compensated cirrhosis, hypertrophy of the caudate lobe was more advanced in ALD than in viral cirrhosis. Hypertrophy of the lateral segment and atrophy of the medial and anterior segments and the right lobe were more marked in ALD and viral cirrhosis.1 However, these differences became less evident with progression of cirrhosis regardless of etiology.1 Notably, HCV‑related fibrosis showed a higher volume of cytokeratin 7–positive hepatocytes, whereas ductal profiles were more evident in hepatitis B virus–related cirrhosis.28 Unfortunately, few studies have investigated an association among liver volumetry, liver function, and the clinical course of chronic liver disease to date. Maira et al22 found that no improvement in the CPC and the MELD score at follow‑up after antiviral therapy was related to smaller LV. Smaller LV was associated with poor clinical outcomes in patients with HCV infection, pointing to the role of liver volumetry as a noninvasive prognostic indicator of lack of functional and clinical liver recovery after DAA therapy.22 Our results corroborated these data, as the smallest LV was found in the presently analyzed patients infected with HCV, with a relatively large fraction of HCV RNA–positive individuals at LT (64.5%). Hagan et al29 found that LV had a relevant predictive value in patients with cirrhosis from hepatocellular disease independent of the MELD score, suggesting that LV might impart crucial prognostic data regarding LT or death, not captured by the MELD score alone. Thus, Hagan et al29 regarded LV as a significant adjunct to the MELD score in the evaluation of patients with hepatocellular disease. Lack of such correlation in the present study was striking. However, the clinical characteristics of our study group might provide a possible explanation of this finding, as our sample included patients with preserved liver function and hepatocellular carcinoma (50%) and individuals with PSC undergoing transplant due to exhausted possibility of endotherapy of the biliary tree but not showing severe liver fibrosis (77.8%).
In PSC, biliary obstruction affects the liver in many ways. Damage to the liver parenchyma and parenchymal disease are also nonhomogenously distributed. Abnormalities seen in the liver parenchyma typically include spherical liver shape and caudate lobe hypertrophy, segmental or lobular atrophy with compensatory hypertrophy attributed to chronic biliary obstruction, and peripheral wedge‑shaped areas.30 There are promising results regarding the high utility of magnetic resonance imaging for direct and noninvasive classification of liver fibrosis stages, all the more so as normal ranges have been defined for healthy individuals.31 In a thorough magnetic resonance–based study, Nilsson et al32 showed that liver function in patients with PSC was significantly more heterogeneously distributed within the liver parenchyma compared with healthy controls. Segmental liver function, correlated with the level of downstream biliary obstruction and liver function assessed by magnetic resonance imaging, was significantly associated with disease severity as graded by the Mayo risk score.32 However, in our study, lack of correlation between liver function and its volumetry in patients with PSC might be explained by the high number of transplant recipients in the study cohort with recurrent cholangitis as an indication for liver transplant but without advanced liver fibrosis and cirrhosis, as mentioned above.
We found no correlation between LV and BMI as well as sarcopenia, which are usually regarded as benchmarks of long‑lasting chronic liver disease in terms of substantial nutrition deficits33 and an increased risk of post‑transplant graft loss and mortality.34,35 Our results are opposite to those reported by Dello et al,36 who showed that total LV, total functional LV, and fat‑free body mass were significantly lower in the sarcopenia group than in the non‑sarcopenia group. The association between sarcopenia and BMI did not reach statistical significance, but a significant correlation was observed between L3SMI and total functional LV. The ratio of total functional LV to body weight was significantly lower in the sarcopenia group than in the non‑sarcopenia group, providing evidence that liver weight was reduced to a disproportionally greater extent in sarcopenic patients.36 In sarcopenia, matrix metalloproteinase 2 and matrix metalloproteinase 9 play a prominent role in extracellular matrix degradation and muscle loss, pointing to alterations in extracellular matrix proteins in parallel with the changed quality and amount of muscle collagens.37,38 Similar changes might also affect the connective tissue stroma of the liver. However, the substantial number of noncirrhotic patients with PSC in our study group might have influenced the results. Our data might also be underscored due to the low number of participants.
In conclusion, LV differed significantly in terms of chronic liver disease etiology, with the lowest value noted in individuals with HCV infection and the highest in those with PSC. However, low LV neither was a prognostic factor of disease progression and need for LT with respect to the CPC and MELD score nor correlated with BMI and L3SMI in cirrhotic candidates for liver graft. Further studies are needed to find novel, noninvasive biomarkers of the clinical course of chronic liver diseases.
- Ozaki K, Matsui O, Kobayashi S, et al. Morphometric changes in liver cirrhosis: aetiological differences correlated with progression. Br J Radiol. 2016; 89: 20150896. | Crossref
- Paluszkiewicz R, Zieniewicz K, Kalinowski P, et al. Liver regeneration in 120 consecutive living‑related liver donors. Transplant Proc. 2009; 41: 2981‑2984. | Crossref
- Simpson AL, Jarnagin WR, D’Angelica MI. Hepatic resection planning in the modern era: in reply to Mise and colleagues. J Am Coll Surg. 2014; 219: 1195‑1197. | Crossref
- Caldwell SH, de Lange EE, Gaffey MJ, et al. Accuracy and significance of pretransplant liver volume measured by magnetic resonance imaging. Liver Transpl Surg. 1996; 2: 438‑442. | Crossref
- Ozaki K, Matsui O, Kobayashi S, et al. Selective atrophy of the middle hepatic venous drainage area in hepatitis C‑related cirrhotic liver: morphometric study by using multidetector CT. Radiology. 2010; 257: 705‑714. | Crossref
ARTICLE INFORMATION