Comparative analysis of exosome markers and extracellular vesicles between colorectal cancer and cancer-associated normal colonic mucosa
Key words: colorectal cancer, exosomes, extracellular vesicles


 CC BY-NC-SA 4.0
Comparative analysis of exosome markers and extracellular vesicles between colorectal cancer and cancer-associated normal colonic mucosa
Introduction: Exosomes are currently considered as the new biomarkers of colorectal cancer (CRC). Tetraspanins (CD9, CD63) belong to the well‑known exosome markers, but can also be found on other subtypes of extracellular vesicles (EVs).
Objectives: The aim of this study was to estimate the expression level of exosome markers and EVs in CRC.
Patients and methods: The expression level of CD9 and CD63 antigens was evaluated by immunohistochemical staining in 109 patients diagnosed with CRC. Immunohistochemistry results were verified by nanoparticle tracking analysis (NTA), as well as the Western blot analysis and transmission electron microscopy. Exosomes isolation was performed on solid tissues. The immunohistochemical expression of both tetraspanins was compared with expression of cellular proliferation marker, Ki‑67.
Results: A higher expression level of exosome markers was observed in CRC compared with the normal colonic mucosa. The NTA revealed higher concentrations of nanoparticles in CRC tissues than in controls. There was a strong positive correlation between exosome markers and the Ki‑67 antigen. The expression levels of both tetraspanins were different for lymph node staging (N stage).
Conclusions: Exosome markers and EVs were more pronounced in the CRC samples compared with controls. Immunohistochemical evaluation of tetraspanins reflects the results obtained by the NTA. Exocytosis appears to play an important role in the pathogenesis of CRC. To the best of our knowledge, such analysis was carried out for the first time.
What's new?
There is an abundant expression level of exosome markers in colorectal cancer compared with samples of normal colonic mucosa. The nanoparticle tracking analysis was consistent with the previously obtained immunohistochemical results. This study present an optimized protocol for isolating extracellular vesicles from the solid tissue of the colon. The obtained results may improve the early diagnosis of colorectal cancer
Introduction
Exocytosis remains an important phenomenon of extracellular transport in the world of living organisms. This process of biological information exchange between the cells is possible via extracellular vesicles (EVs) that convey biologically active molecules such as proteins, nucleic acids, and lipids. High heterogeneity of EV subpopulations due to the difference in the way they are released from the cell and their morphological parameters allows to distinguish at least 3 separate EV subtypes: exosomes, microvesicles, and apoptotic bodies.1
During oncogenesis, EVs possess some oncogenic potential of their own content and are increasingly being considered in the category of new cancer biomarkers.2-7
Studies carried out to date show that EVs may be important in the progression of colorectal cancer (CRC).8 Qualitative changes of their content were associated with an accelerated proliferation of cancer cells and normal fibroblasts as well as promotion of the epithelial‑mesenchymal transition phenotype.9 Cancer cell–derived exosomes were actively incorporated into target cells, and the vesicles derived from murine CRC cells were not only captured by the cancer cells but also by the tumor‑associated immune cells.10 The assimilation of exosomes released from CRC by the inflammatory cells also lead to changes in the immune response.11 Colorectal cancer–derived EVs have shown the potential to alter the immunophenotype and cytokine secretome by immune cells of the monocytic line,12 and the biological properties of exosomes can be used in the immunotherapy of advanced CRC.13 On the other hand, in CRC progression, not only exosomes released by cancer cells appear to have an important pathogenetic significance but also those vesicles which originate from other tumor microenvironment cells.14
The evaluation of serum‑derived exosomes in terms of their lipids, proteins, and other content is now being used to better understand CRC pathogenesis.15 The unique profile of microRNA molecules in the exosomes of this cancer vary significantly compared with the vesicles released by normal cells.16 A proteomic analysis of exosomes derived from cell lines at various stages of CRC revealed significant differences at the level of the exosomal proteome, which may be a useful parameter in assessing the progression of this cancer.17 Moreover, tumor‑derived exosomes have a potency to remodel premetastatic niche, which facilitates forming distant metastases from the primary tumor sites.18 The clinical significance of EVs in CRC may also be associated with an incomplete response to implemented treatment, since chemo‑resistance of CRC cells to anticancer therapy appears to be conditioned by the uptake of exosomes secreted by cells with previously generated resistance.19
Due to the small size of EVs and their high heterogeneity, the detection of these structures is problematic and requires the use of unconventional molecular diagnostic techniques.20,21 What is more, despite the well‑defined size range of exosomes and their morphological parameters, modern technological solutions enable the detection of new subpopulations of these vesicles differing not only in their diameter, but also in the specificity of the transported content, and thus, in functionality.21-24 The most well‑known exosome markers include tetraspanins (CD9, CD63, CD81) and Hsp70, nevertheless, positive expression of these proteins has also been observed in different types of EVs.3,25 With regard to CRC, the fact that clinical research is lacking and most of the studies performed so far have been carried out on cell lines and animal models, remains a limitation. There are also methodological difficulties because there is still no established consensus and proven protocols to isolate exosomes from solid tissue,26 so valuable in cancer research.
In our work, we evaluated the immunohistochemical coexpression of selected exosomal markers between the CRC and normal colonic mucosa. The obtained results were confirmed by a wide range of complementary methods on prepared solid tissue exosome isolates.
Patients and methods
Patients
The study was performed on archival tissue material of solid tumors with a histological subtype of adenocarcinoma previously obtained from adults diagnosed with CRC. Tissue fragments were collected intraoperatively during resection of the tumor between 2013 and 2016 from patients treated in the Department of Surgery of the 4th Military Teaching Hospital in Wrocław, Poland. Based on the available clinical and pathological data, the patients were included in the study taking into account the following inclusion criteria: age over 18 years, histopathological diagnosis of CRC (adenocarcinoma), no past medical history of other cancers, no implemented chemotherapy (past and present), no immunosuppressive treatment in the last 3 months, no preoperative radiotherapy, no other associated somatic diseases requiring chronic therapy. Insufficient clinical‑pathological data or lack of analyzable tissues in the assessed tissue microarrays (TMA) spots were exclusion criteria for the study. Healthy surgical margins as a valid control prior to inclusion in the study were evaluated microscopically on standard histological slides. The presence of cancer cells excluded the sample from further analysis. Finally, 109 patients were selected for the study (Table 1). On October 30, 2018, a positive opinion of the Bioethics Committee of the Medical University in Wrocław was obtained (no. 617/2018). All patients included in this study signed consent to use their tissue in this experiment. This study was carried out in accordance with the principles of the Declaration of Helsinki and with accordance to the principles of good clinical practice.
Characteristic | Type of examined solid tissue | |||
CRC | HC | HC (matched pairs) | ||
Abbreviations: CRC, colorectal cancer; HC, healthy control; N, positive lymph nodes; NA, not applicable; TNM, tumor‑node‑metastasis classification | ||||
Patients, n | 95 | 27 | 13/27 | |
Age, y, mean (SD) | 69.9 (10) | 70.2 (11) | 70.8 (11) | |
Sex (female / male) | 44/51 | 12/15 | 8/5 | |
Tumor grade | G1 | 33 | NA | NA |
G2 | 54 | |||
G3 | 8 | |||
TNM stage | I | 16 | NA | NA |
II | 34 | |||
III | 27 | |||
IV | 18 | |||
N stage | 0 | 61 | NA | NA |
1–3 | 24 | |||
4+ | 10 | |||
Tumor size (T) | T1 | 1 | NA | NA |
T2 | 22 | |||
T3 | 68 | |||
T4 | 4 | |||
Tumor dimension, cm | ≤2 | 18 | NA | NA |
>2 | 77 | |||
Preparation of colorectal cancer tissue isolates
Exosome isolation was performed on the available frozen archival material stored at a deep freezing temperature (–80 °C). For the isolation of EVs, solid tissue samples (CRC and corresponding healthy surgical margin) from randomly selected 10 patients were used. All frozen material samples selected to prepare CRC isolates came from a subgroup of patients described in the category of normal control (Table 1). In each case, 100 mg of nondegraded tissue measured with electronic scales was secured for further analysis. Finally, EVs from 20 tissue samples were isolated.
The modified protocol by Vella et al27 was used to isolate exosomes. Tissue fragments weighing 100 mg were immersed in 1 ml of Hibernate‑E medium (Gibco, Thermo Fisher Scientific, Waltham, Massachusetts, United States, Cat. No. A12476‑01, 500 ml) with 125 U/ml of collagenase type 3 (Worthington #CLS‑3, Worthington Biochemical Corporation, Lakewood, California, United States, Cat. No. LS004183, 5 gm). Incubation was carried out in a shaking water bath set at 37 °C with gentle shaking for a total of 20 minutes. After 5 minutes, the contents of the samples were mixed by inversion, and after another 10 minutes, the tubes were pipetted twice. After transferring the samples to ice, a cocktail of protease inhibitors of 10 ml for 100 × concentrated solution was added (cOmplete, EDTA‑free Protease Inhibitor Cocktail, vial of 20 Tablets, Sigma‑Aldrich, Saint Louis, Missouri, United States, 11873580001) and 20 ml for 50 × concentrated solution of phosphatase inhibitors (PhosSTOP, PHOSS‑RO Roche, packaging of 20 Tablets, Sigma‑Aldrich, 04906837001).
The prepared samples were then centrifuged at 300g for 5 minutes at 4 °C (Sorval Legend X1R Centrifuge, Thermo Scientific, Waltham, Massachusetts, United States). The obtained pellet was discarded, and the protected supernatant was transferred to new tubes and centrifuged at 2000g for 10 minutes at 4 °C. The whole procedure was repeated in the third centrifugation at 10000g for 30 minutes. The obtained 500 ml of supernatant was sealed in separate tubes and transported on dry ice (–20 °C) to the Laboratory of Nanostructures, Institute of High Pressure Physics, Polish Academy of Sciences in Warsaw, Poland, where independent samples examination were conducted by nanoparticle tracking analysis (NTA). The remaining supernatant was secured at deep freezing temperature (–80 °C) for further procedures.
Tissue microarrays
Tissue microarrays were created with the use of the TMA Grand Master automatic tissue microarrayer (3DHistech, Budapest, Hungary). From each paraffin block, 6-μm‑thick sections were cut, and stained with hematoxylin and eosin. The prepared slides were scanned with the Pannoramic MIDI II scanner (3DHistech). Representative spots for the TMAs (3 spots, 1.5‑mm diameter from each paraffin block) were selected by a qualified pathologist from the digital slides with the use of the CaseViewer software (3DHistech).
Immunohistochemistry
To perform the immunohistochemical reactions, 4 μm thick slides were prepared from TMA. Slides were deparaffinized, rehydrated and antigen retrieval was carried out by boiling the sections in EnVision FLEX Target Retrieval Solution pH 9 (for CD9, CD63) or in EnVision FLEX Target Retrieval Solution pH 6 (for Ki‑67) using a PTLink (Dako, Glostrup, Denmark). Activity of endogenous peroxidase was blocked for 5 minutes with EnVision FLEX Peroxidase‑Blocking Reagent (Dako). Rabbit polyclonal antibodies against CD9 (Sigma‑Aldrich, SAB4503606) and CD63 (Sigma‑Aldrich, SAB4301607) and mouse monoclonal antibodies against Ki‑67 (IR626, clone MIB‑1) were used as primary antibodies (20 minutes). Then slides were incubated with EnVision FLEX / horseradish peroxidase (HRP) (20 minutes). The reactions were visualized with freshly prepared 3,3’-diaminobenzidine (10 minutes). Furthermore, slides were dyed with EnVision FLEX Hematoxylin (5 minutes). Subsequently, the histological slides were dehydrated in ethanol (70%, 96%, absolute) and xylene, then mounted with Dako Mounting medium (Dako). IHC reactions were performed on Autostainer Link48 (Dako). Digital slides were estimated using the CaseViewer (3DHistech) software.
Immunohistochemistry staining estimation scoring system
The intensity of immunohistochemistry (IHC) reaction was assessed using the semiquantitative immunoreactive score of Remmele and Stegner (IRS), which takes into account the percentage of positive cells and the intensity of color reaction. The IRS score is a useful tool to analyze protein expression.28 Points were assigned according to the following percentages of stained cells: no reaction, 0; up to 10% of stained cells, 1; between 11% and 50%, 2; between 51% and 80%, 3; and more than 80% of stained cells, 4 points. Reaction intensity was assessed and graded as negative, low, moderate, and strong (0 to 3 points). The final IRS score was calculated by the multiplication of the points corresponding with percentage of positive cells and the points determined by staining intensity. Final score ranged from 0 to 12 points. Two independent researchers conducted the analysis (LZ, AP). Next, an independent estimation of the obtained results was carried out by a qualified pathologist (PD). Tetraspanins were estimated based on the immunohistochemical expression of CD9 and CD63 antigens performed on 95 cases of CRC and 27 samples of healthy surgical margins representing normal colonic mucosa (Supplementary material, Figure S1).
Ultracentrifugation
The complete ultracentrifugation procedure (Sorvall WX ULTRA 100, Thermo Scientific) resulting in the acquisition of exosomal pellet was carried out in accordance with the protocol of Théry et al29 with a slight modification: in the last stage of the procedure, the pellet was suspended in ice‑cold phosphate‑buffered saline (PBS) with a cocktail of inhibitors (50 μl).
Nanoparticle tracking analysis
The detection and analysis of the average size of nanoparticles and assessment of their size distribution was performed by the NTA. Measurements were made with the NanoSight NS500 analyzer (serial number 80336/A, Malvern Instruments, Malvern, United Kingdom). The light source was a blue diode laser with a wavelength of 405 nm (NanoSight, Malvern Instruments). The tests were carried out at ambient temperature of 23 °C ±0.4 °C. NTAs were performed on 20 samples, 500 ml each. All samples were diluted in 5 ml PBS before measurements. Before measuring the samples, the device was calibrated with a standard solution (Nanosphere Size Standard 200 nm, Cat. No. 3200A). Measurements were made for particles in the size range of 10 to 1000 nm. Nine independent measurements were made for each sample, and the final result included the mean value of the diameter of the nanoparticles and their total concentration.
Western blot analysis
Protein homogenization was carried out in 500 μl of solution with 0.2 mM phenylmethylsulfonylfluoride and a mixture of protease inhibitors (Sigma‑Aldrich, St. Louis, United States) through shaking at 4 °C for 30 minutes and subsequent centrifugation for 15 minutes at 14000g. Protein concentration was measured using the BCA Protein Assay and NanoDrop 1000 spectrophotometer (both: Thermo Scientific, Waltham, United States). To separate the proteins in 10% polyacrylamide gel, 50 μg of protein was used per well. The samples were denatured at 96 °C for 5 minutes with a Glo Lysis Buffer (250 mM tris[hydroxymethyl]aminomethane pH 6.8, 40% glycerol, 20% [v/v] β-mercaptoethanol, 100 mM dithiothreitol, 0.33 mg/ml bromophenol blue, and 8% sodium dodecyl sulfate). After the separation, wet protein transfer was carried out to PVDF Immobilion‑P membrane (Merck Millipore, Darmstadt, Germany) at 80 V for 2 hours. The membrane was washed with a 0.1% Tris Buffered Saline with Tween (TBST) buffer (1 × TBS with 0.1% Tween‑20) and blocked for 1 hour in a 5% dry milk solution with 0.1% TBST. The solution of primary antibodies was prepared with 5% dry milk in 0.1% TBST; polyclonal rabbit anti‑CD9, anti‑CD63, anti‑CD81, and HSP70 antibodies at 1:1000 dilution were used (ExoAb Antibody Sampler Kit, 322‑EXOAB‑KIT‑1, Systems Biosciences, Palo Alto, California, United States). The membrane was incubated with primary antibodies overnight at 4 °C. After washing with TBST, incubation with secondary antibodies conjugated with HRP was carried out (goat anti‑rabbit antibody, 1:20 000 dilution, 322‑EXOAB‑KIT‑1, Systems Biosciences). Signal detection was conducted using the Luminata Crescendo Western HRP Substrate kit (Millipore) and Chemi‑Doc XRS Molecular Imager (Bio‑Rad, Hercules, United States). The weight of proteins was measured using Precision Plus Protein Dual XtraPrestained Protein (Bio‑Rad).
Transmission electron microscopy
For the characterization of exosomes by the transmission electron microscopy (TEM), the structural‑morphological parameters of vesicles based on the analysis of EVs diameter and their density were used. The exosome pellet obtained from CRC tissue isolates after the ultracentrifugation procedure was suspended in PBS buffer according to Lässer et al.30 Then, the buffer drops containing exosomes were placed for a period of 60 minutes on Formvar‑carbon coated copper grids. Subsequently, the samples were rinsed with PBS buffer and fixed in 2% paraformaldehyde (Thermo Scientific) for 10 minutes. The next step was postfixation in 2.5% glutaraldehyde for 10 minutes (Serva Electrophoresis, Heidelberg, Germany). Subsequently, grids were washed with deionized water followed by counterstaining with 2% uranyl acetate (Serva) for 15 minutes. The last step was embedding the grids in 0.13% methyl cellulose (viscosity 25 cP, Sigma‑Aldrich). After the samples have dried, the EVs were analyzed in TEM (JEM‑1011, Jeol, Tokyo, Japan) at an accelerating voltage of 80 kV. The electron micrographs were collected using the iTEM1233 imaging platform equipped with the Morada Camera (Olympus, Münster, Germany).
Statistical analysis
Statistical analyses were performed using GraphPad PRISM8 (version 8.1.2, GraphPad Software, San Diego, California, United States). The selection of appropriate test was preceded in each case by an assessment of the normality of distribution. The Mann–Whitney test was used to compare the difference between expression of exosomal markers in normal colonic mucosa and CRC tissue samples. The difference in both tetraspanins expression according to selected histopathological parameters was estimated by the Kruskal–Wallis test (for multiple groups comparison) and Mann–Whitney test (for 2 groups comparisions). The paired‑sample t test was used to evaluate the difference between normal controls and CRC to analyze the concentration of nanoparticles in matched samples. SD values have been added to the mean values in accordance with the following format: mean (SD). The correlation between relevant parameters was estimated with the Spearman rank correlation analysis. A P value below 0.05 was considered statistically significant.
Results
Immunohistochemistry staining showed abundant expression level of exosome markers in colorectal cancer
Expression of the CD9 and CD63 antigens was higher in the tumor tissue than in the normal surgical margins (P <0.001). The positive reaction of both tetraspanins was most commonly noted in the cytoplasm. For semiquantitative estimation of the expression level, the IRS scoring system was used as previously described. In the case of CRC, the region of interest taken into consideration in the scoring was the percentage of positive cancer cells, while in controls, it was the percentage of positive normal epithelium cells. The positive reaction was more pronounced in glandular elements than in the tumor stroma.
For the reaction against CD63 antigen, only a few cases of CRC showed a strong expression in the stroma. Nevertheless, this tendency did not affect the obtained result due to a comparable expression level in the tumor. The difference in the IRS scores between both tetraspanins is due to the intensity of the reaction. With regard to CD9 expression, the intensity of the reaction was constant, at a moderate level. Therefore, only the percent of positive cells was counted (Figure 1A-1D). In the case of CD63, variations were noted, thus the complete IRS score was calculated (Figure 1E-1H).
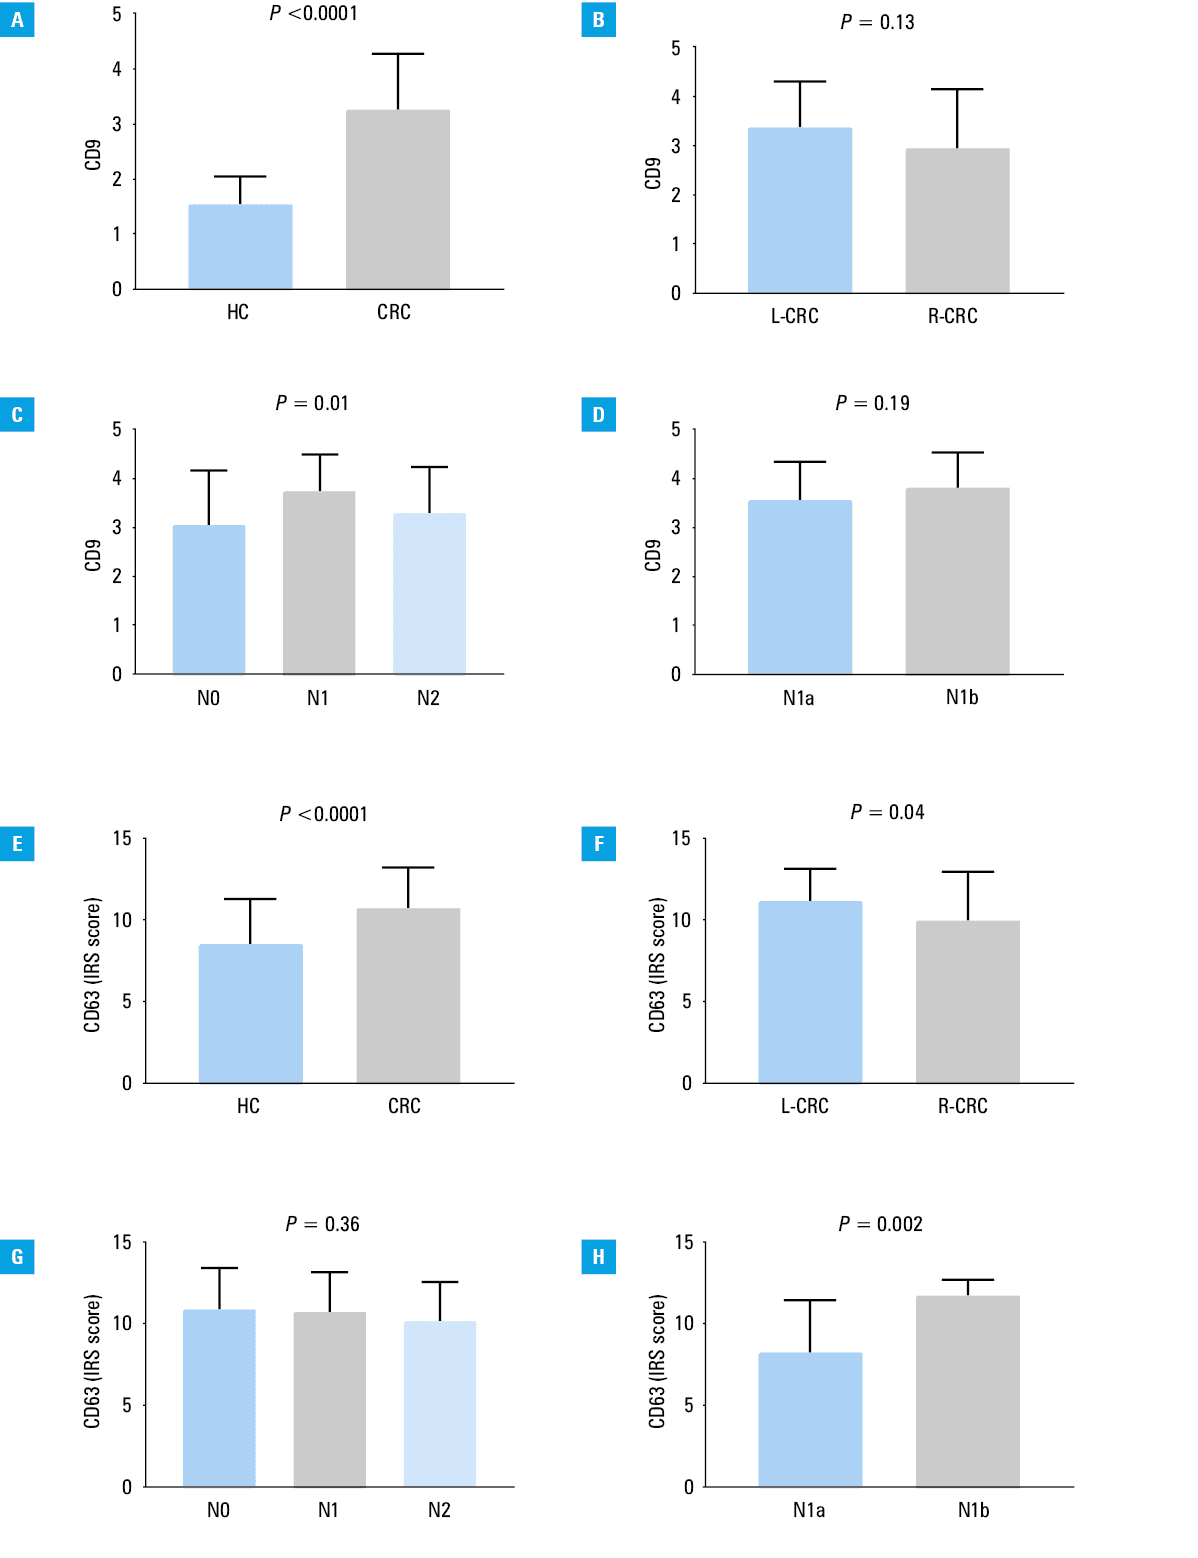
Abbreviations: HC, normal colonic mucosa; L‑CRC, left‑sided colorectal cancer; N, number of regional lymph nodes metastasis; N0, no regional lymph nodes affected; N1, 1–3 positive regional lymph nodes; N1a, metastasis in 1 regional lymph node; N1b, metastases in 2–3 regional lymph nodes; N2, metastases in 4 or more lymph nodes; R‑CRC, right‑sided colorectal cancer
Because the molecular profile in CRC may differ from the location of the primary focus of cancer,31 we conducted an additional assessment of the impact of location on the coexpression of both tetraspanins. There was a difference in CD63 antigen expression between the left‑sided and right‑sided CRC (P = 0.04), where the IRS score was higher for the left side (Figure 1F). Interestingly, a strong positive correlation was found between the cell proliferation antigen Ki‑67 and both CD9 (ρ = 0.55; P <0.001) and CD63 (ρ = 0.32; P = 0.003). Moreover, there were differences between the tetraspanins expression level and patients grouped by N parameter. The level of CD9 expression was associated with the number of positive lymph nodes (P = 0.01). An opposite result was found between the N1a and N1b stages, where CD63 expression was higher in the N1b stage (P = 0.002). The obtained results are shown in Table (Table 2).
Parameter | Spearman test | P value | |
ρ | P value | ||
a Kruskal–Wallis test
b Mann–Whitney test
Abbreviations: see Table 1 | |||
Tumor gradinga, G | |||
CD9 | 0.07 | 0.49 | 0.56 |
CD63 | 0.1 | 0.36 | 0.64 |
TNM stagea | |||
CD9 | 0.12 | 0.25 | 0.54 |
CD63 | 0.005 | 0.96 | 0.9 |
T parameterb, T1–T2; T3–T4 | |||
CD9 | NA | 0.93 | |
CD63 | 0.63 | ||
Age, y | |||
CD9 | 0.05 | 0.67 | NA |
CD63 | 0.001 | 0.99 | |
Tumor size, cm | |||
CD9 | 0.06 | 0.57 | NA |
CD63 | 0.05 | 0.64 | |
Ki‑67 | –0.07 | 0.55 | |
Proliferation antigen, Ki‑67 | |||
CD9 | 0.55 | <0.001 | NA |
CD63 | 0.32 | 0.003 | |
N stagea,b | |||
CD9 | 0.2 | 0.06 | For more details, please refer to Figure 1. |
CD63 | –0.09 | 0.38 | |
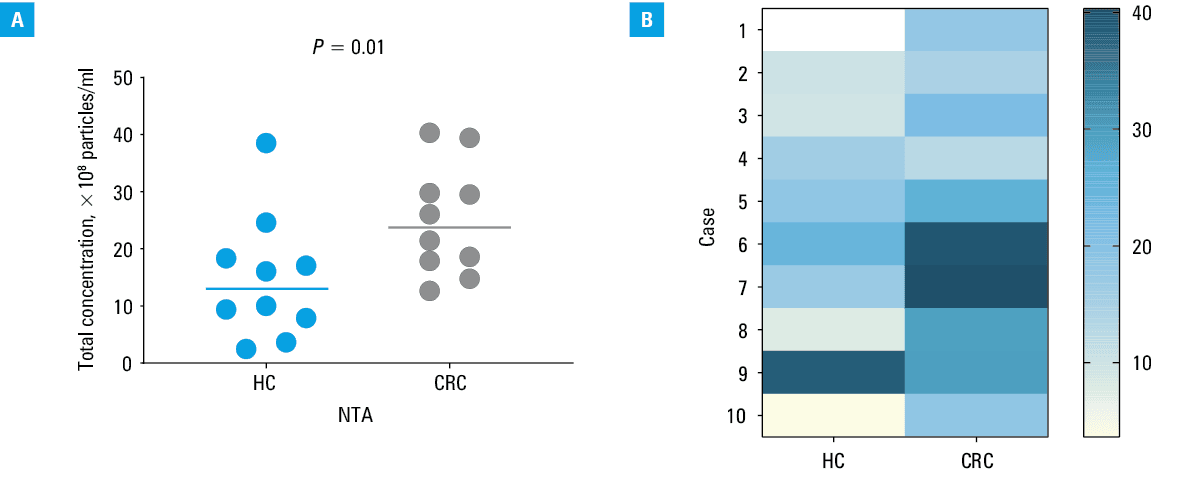
Nanoparticle tracking analysis showed a higher level of nanoparticles in colorectal cancer than in controls
The NTA included 20 EVs samples from 10 patients diagnosed with CRC. In each case, the matched pairs taken from the same patient with cancer‑associated normal colonic mucosa and the corresponding tumor tissue were examined. The paired‑sample t test was used to analyze the differences in the level of nanoparticles between CRC samples and normal controls. Higher concentrations of nanoparticles were found in CRC than in the healthy margins (P = 0.01) (Figure 2). The final results of the NTA included the average vesicles diameter as well as their total concentration. The mean (SD) of total concentrations of EVs for the normal control was 14.81 (10.82) × 108 nanoparticles/ml while in CRC, this parameter was higher, 25.05 (9.714) × 108 nanoparticles/ml. Interestingly, the EVs in control samples had higher average diameter values (mean [SD], 153 [35.34] nm) compared with those in CRC (mean [SD], 132.7 [26.45] nm). The representative NTA results and micrographs of 6 patients taken with a charge‑coupled device image sensor camera are shown in Supplementary material, Figure S2. The presence of exosomes in the tested samples was confirmed by an independent evaluation of these vesicles by the Western blot analysis and TEM (Supplementary material, Figure S3).
Immunohistochemical expression of exosome markers accurately reflects the results of nanoparticle tracking analysis
Immunohistochemical overexpression of both tetraspanins in CRC has been confirmed by uninfluenced analysis of nanoparticles in the NTA. A positive correlation with NTA results was found for immunohistochemical expression of both tetraspanins. A strong positive correlation was found for CD63; however, the obtained result was not significant (ρ = 0.49; P = 0.05). On the other hand, IHC results for CD9 showed very strong positive correlation with the concentration of nanoparticles in the NTA (ρ = 0.71; P = 0.003). Although the highest conformability with concentration of nanoparticles was obtained for CD9 immunohistochemical expression, it should be noted that, in our opinion, the simultaneous analysis of the intensity of the color reaction as well as the percentage of positive cells is more informative. A comparison between IHC staining results for exosome markers and the concentration of nanoparticles in the NTA is shown in Supplementary material, Figure S4.
Morphometric characteristics of extracellular vesicles by transmission electron microscopy
TEM confirmed the presence of EVs in the studied samples (5 normal colonic mucosa and 5 CRC specimens). First, we have observed exosomes in all micrographs. Exosomes were surrounded by a single lipid bilayer. The diameter of the exosomes ranged from 30 to 150 nm (Supplementary material, Figure S3B and S3C). They formed aggregations or they were present in the form of single vesicles. The surface of the exosomes was characterized by variable electron density. For the most part, it was darker outside and brighter in the middle part of the observed vesicles. In most of the study samples, the exosomes were spherical or slightly elongated in shape. The exosomes in patients with CRC were delimited by an electron‑dense outer rim. Moreover, the EVs with the diameter in the range of 200 to 350 nm, with morphological characteristics corresponding to microvesicles, could be observed in both control and CRC samples. However, microvesicles were more likely to occur in the normal colonic mucosa than in cancer, as shown in Supplementary material, Figure S3C.
Discussion
In the light of current hypotheses, exosomes play an important role in the pathogenesis of CRC and are increasingly considered as biomarkers for this cancer.32-35 In our work, we present an immunohistochemical assessment of the expression of exosome markers on a large group of patients diagnosed with CRC. The obtained results were confirmed by an independent NTA, which, according to the International Society for Extracellular Vesicles (ISEV) statement, belongs to one of the reference methods in the study of EVs.26,36 What is more, the obtained results were verified by visualization of EVs in TEM as well as by the assessment of well‑known exosome markers at the protein level.
Abundant positive IHC reactions against CD9 and CD63 antigens in CRC may suggest increased release of exosomes by cancer cells, since both tetraspanins were described as exosome surface markers. The observed distribution of positive reactions for exosomal markers in the cytoplasm was specific for exosomes, since their biosynthesis occurs in this compartment of the cell.6 It should be noted, however, that none of these tetraspanins is specific for exosomes, since the other EVs may also express these proteins.25,26 Based on the NTA analysis, we found a difference not only in the concentration of nanoparticles, the number of which was higher in CRC, but there were also some disproportions in the diameter of the examined EVs, which was higher in tissue isolates obtained from the normal colonic mucosa than in cancer. The analysis of electronograms showed that the differences may be the result of a larger number of microvesicles, which we observed more often in normal controls. In CRC samples, vesicles with a diameter below 150 nm prevailed and EVs with a higher diameter appeared less frequently. The observed differences in the heterogeneity of EVs between CRC and normal tissue are a valuable complement to current research suggesting the use of exosomes in the biomarker category of this type of cancer.
The limitation of our research that the analyses were performed on archival material limited to the assessment of selected paraffin blocks and tissue fragments stored at deep freezing temperature. According to the ISEV, tissue freezing may disturb the value of the obtained results, although according to the current literature, isolation of EVs on such material is commonly performed.26,27,37 Another limitation is the disproportion in numbers between the assessed cases by the IHC staining and NTA. Due to the limited availability of frozen material, it was necessary to limit the measurements.
The advantage of our study is conducting research on a relatively large number of clinical cases. Such studies are infrequently performed because most of the current research focuses on assessing the functional significance of exocytosis in cell lines in vitro models. What is more, recent studies on clinical material are usually limited to a few cases and most often relate to the analysis of selected physiological fluids such as serum, plasma, or urine, for which the protocols have been quite well developed and verified by the expert panels.26,38 In our work, we used an experimental protocol for isolating exosomes from solid tissue, after making some changes to the original version.27 As one of the modifications, we decided to introduce more collagenase type 3 since other type of tissue was tested, assuming that the distribution of collagen between the brain and CRC is different.39,40 Moreover, in relation to CRC, there is a proven tendency for this cancer to increase collagen production.41,42 Another modification that has been introduced is a different ultracentrifuge method, because instead of a differential ultracentrifugation in a sucrose gradient, we performed classic ultracentrifugation to visualize EVs by TEM.
The expression level of both tetraspanins correlated differently with the N parameter of TNM staging and was different for the respective N stages. Moreover, we showed a positive correlation between the cell proliferation antigen, Ki‑67, and exosome markers. Expression of the Ki‑67 protein (pKi‑67) is associated with the proliferative activity of intrinsic cell populations in malignant tumors, allowing it to be used as a marker of tumor aggressiveness43 and the number of positive lymph nodes may emphasize the importance of the adequate exosome subpopulation in induction of local tumor progression. Obtained results may suggest an important role of exocytosis in the progression of CRC at various stages. On the other hand, in CRC, the expression level of Ki‑67 seems to have a questionable prognostic value as opposed to the clinical stage of the disease.44 In our study, we did not obtain significant results between the expression level of tetraspanins and the TNM stage or tumor size. Insignificant results may be due to the disproportions in numbers of T parameter, as most cases were classified as T2 and T3 stages.
To sum up our results, we found that the number of EVs in CRC is significantly higher than in normal colonic mucosa and the immunohistochemical assessment of tetraspanins is consistent with the results obtained by the NTA method which means that IHC staining may be a useful method in the estimation of EVs. To the best of our knowledge, such study has been conducted for the first time. Our results, however, require confirmation on fresh tissue material and a larger group of patients.
- Yáñez‑Mó M, Siljander PR, Andreu Z, et al. Biological properties of extracellular vesicles and their physiological functions. J Extracell Vesicles. 2015; 4: 27066.
- Severino V, Dumonceau JM, Delhaye M, et al. Extracellular vesicles in bile as markers of malignant biliary stenoses. Gastroenterology. 2017; 153: 495‑504. | Crossref
- McAndrews KM, Kalluri R. Mechanisms associated with biogenesis of exosomes in cancer. Mol Cancer. 2019; 18: 52. | Crossref
- Choi D, Lee TH, Spinelli C, et al. Extracellular vesicle communication pathways as regulatory targets of oncogenic transformation. Semin Cell Dev Biol. 2017; 67: 11‑22. | Crossref
- Choi D, Spinelli C, Montermini L, Rak J. Oncogenic regulation of extracellular vesicle proteome and heterogeneity. Proteomics. 2019; 19: e1800169. | Crossref
SUPPLEMENTARY MATERIAL
ARTICLE INFORMATION