Blood pressure profile, sympathetic nervous system activity, and subclinical target organ damage in patients with polycythemia vera
Key words: blood pressure profile, organ damage, polycythemia vera


 CC BY-NC-SA 4.0
Blood pressure profile, sympathetic nervous system activity, and subclinical target organ damage in patients with polycythemia vera
Introduction: Polycythemia vera (PV) is a rare myeloproliferative disease associated with an increased prevalence of hypertension and increased risk of cardiovascular complications. However, the precise mechanisms leading to the elevation of blood pressure (BP) and secondary target organ damage remain poorly understood.
Objectives: The study aimed to evaluate BP profile, assess the activity of the sympathetic nervous system and the renin‑angiotensin system, and provide a comprehensive assessment of subclinical target organ damage in patients with PV.
Patients and methods: Twenty consecutive patients with newly diagnosed PV and 20 control subjects were included. The following were assessed: BP, levels of catecholamines, urinary and plasma O‑methylated catecholamine metabolites, concentrations of aldosterone and renin. We also assessed microneurography sympathetic nervous system activity (MSNA) and baroreflex control of heart rate as well as subclinical target organ damage.
Results: At similar levels of BP, BP variability was decreased in the PV group (mean [SD] 24‑hour systolic BP, 9 [3] vs 12 [3] mm Hg; P = 0.003). Patients with PV had lower norepinephrine excretion (mean [SD], 16.54 [6.32] vs 25.46 [12.88] μg/d; P = 0.03) as well as decreased MSNA as assessed by microneurography compared with controls (mean [SD] MSNA, 30.7 [8.7] bursts/min vs 38.7 [5.4] bursts/min; P = 0.007 and MSNA 51.8 [11] bursts/100 beats vs 61.1 [11.3] bursts/100 heart beats; P = 0.04). Baroreflex control of HR was unaltered in the PV group. Increased hemoglobin levels and red blood cell count correlated with decreased retinal capillary flow in patients with PV.
Conclusions: Patients with PV, characterized by high hemoglobin concentrations and hematocrit levels had lower sympathetic nervous activity and decreased BP variability as compared with controls. There was no relationship between hemoglobin plasma concentration, hematocrit level, and target organ damage.
What's new?
The clinical course of hypertension, including blood pressure (BP) profile, activity of both the sympathetic nervous system and the renin‑angiotensin system, and subclinical target organ damage in patients with polycythemia vera (PV) remains poorly documented. In this single‑center matched case‑control study, we have shown that patients with PV are characterized by a decreased BP variability as compared with controls, despite no differences in BP values. Moreover, patients with PV were characterized by a lower activity of the sympathetic nervous system, defined by a decreased urinary secretion of norepinephrine as well as lower activity of the microneurographic sympathetic nervous system. There were no differences in the severity of subclinical vascular and renal organ damage in patients with PV. Increased hemoglobin levels and red blood cell count inversely correlated with the retinal capillary flow in patients with PV.
Introduction
Polycythemia vera (PV) is a rare hematologic malignancy characterized by clonal proliferation of multipotent bone marrow progenitors, leading to abnormal production of erythroid cells and an increase in the red blood cell mass.1,2 Acquired mutations in JAK (JAK2 V617F and exon 12 mutations) are found in almost all patients with PV.1,2
Several studies performed in patients with PV have demonstrated an association between blood rheological variables (hematocrit and blood viscosity) and cardiovascular risk factors, including an increased aortic pulse wave velocity, elevated blood pressure (BP), and incident hypertension.3-6 It is well established that increased hematocrit levels, and therefore blood viscosity, is associated with thrombotic and vascular complications occurring in 40% to 60% of patients. Moreover, it can increase the load on the cardiovascular system3,7-9 and impair small vessel endothelial vasodilatory function,3,10,11 both potentially leading to secondary hypertension.12-14 Other postulated mechanisms contributing to the development of hypertension in PV include augmented insulin resistance and impaired function of the sympathetic nervous system and / or the renin‑angiotensin system.
Increased blood viscosity may be associated with vascular remodeling, particularly with thickened intima‑media and augmented arterial stiffness. Recent studies showed that patients with PV have more pronounced subclinical cardiac involvement than those with essential hypertension, manifested by impaired systolic function.15-18 To date, most of the research has been focused on the pathomechanisms of hypertension in patients with PV. However, little is known about the clinical course of hypertension within this condition.
In the presented study we aimed to: 1) evaluate BP profile based on ambulatory BP monitoring; 2) assess the activity of the sympathetic nervous system activity and renin‑angiotensin system; and 3) provide a comprehensive assessment of subclinical target organ damage in hypertensive patients with PV in relation to hematocrit levels.
Patients and methods
Twenty consecutive patients with newly diagnosed PV were enrolled in the study. The diagnosis of PV was made according to the World Health Organization criteria. Acquired JAK2-V617F mutations were found in all patients with PV. At the time of the study, none of the patients had received therapy for PV (neither pharmacologic treatment nor phlebotomy). Twenty control patients matched for age, sex, BP values, frequency of hypertension and other cardiovascular risk factors were selected from 121 consecutive patients attending the outpatient clinic of the Department of Hypertension, National Institute of Cardiology, Warsaw, Poland. The study protocol conforms to the ethical guidelines of the 1975 Declaration of Helsinki. It was approved by the local ethics committee. Written informed consent was also obtained from each patient.
Demographic and clinical data (ie, sex, age, weight, height, BP, heart rate [HR], signs, symptoms, and antihypertensive medications) were recorded at study entry according to the study protocol.
Hypertension was defined as history of hypertension, use of antihypertensive drugs, or systolic BP above or equal to 140 mm Hg or diastolic BP above or equal to 90 mm Hg on office measurements or daytime mean systolic BP above or equal to 135 mm Hg or diastolic BP above or equal to 85 mm Hg on ambulatory BP measurements (ABPM). Obesity was defined as waist circumference higher than 102 cm for men and higher than 88 cm for women.
Office and ambulatory blood pressure measurements
Methods of office and ABPM are described in detail in Supplementary material.
Laboratory tests
Biochemical evaluation of blood samples taken after overnight fasting was determined by routine methods and included concentrations of sodium, potassium, lipids, plasma fasting glucose, creatinine, and uric acid as well as complete blood cell count. Estimated glomerular filtration rate was calculated using the Modification of Diet in Renal Disease formula.19 Urinary albumin excretion was assessed using two 24‑hour urine collections (the average of 2 collections was recorded).
Biochemical testing at baseline included mass spectrometry–based measurements of urinary catecholamines and their plasma and urinary free O‑methylated metabolites (metanephrine, normetanephrine). Details about blood and urine collection and reference intervals have been described elsewhere.20-22
Aldosterone and renin plasma concentrations were measured by chemiluminescence immunoassay using LIAISON® Aldosterone and LIAISON® Direct Renin tests, respectively (DiaSorin S.p.A., Saluggia, Italy).
Assessment of cardiovascular alterations
The methodology of carotid and renal ultrasound procedures and echocardiographic evaluations has been published previously and is presented in detail in Supplementary material.23-25 The methods and results of already published echocardiographic evaluations were briefly summarized in Supplementary material.15
Microneurography and baroreflex control of heart rate: analysis of the subgroup of patients with hypertension and polycythemia vera
In 12 out of 20 patients with PV (60%) enrolled in the study, microneurography (MSNA) and baroreflex control of HR were performed. As controls, 16 subjects with essential hypertension (EH) matched for age, sex, body mass index, office BP levels, and number and type of hypotensive medications were selected from the group of hypertensive patients without PV in whom MSNA was previously performed. The day before recording, participants were asked not to drink alcohol or coffee, or use other stimulants. Microneurography signals were obtained using microneurography (Nerve Traffic Analysis System, University of Iowa, Iowa City, Iowa, United States) with a recording electrode placed into the efferent fiber of the peroneal nerve within the popliteal fossa and a reference electrode placed subcutaneously approximately 2 to 3 cm from the recording electrode. The recordings were performed in the morning in a calm environment, after subjects had voided. The subjects were placed supine and remained at rest for 30 minutes, then MSNA was recorded for 45 minutes. Recordings used for study purposes were obtained after 15 minutes of recording stabilization. MSNA was expressed as burst frequency (bursts/min) and burst incidence (bursts/100 heart beats). Sympathetic bursts were counted automatically with a computer software (PowerLab, ADInstruments, Oxford, United Kingdom) and then accepted by a single observer.
Baroreflex control of HR, or baroreflex sensitivity (BRS), was measured with the noninvasive sequence method (Nevrokardt BRS software, version 5.1.3, Nevrokard, Ljubljana, Slovenia). Input data for the software were generated with a Finapress monitor and the electrocardiogram. The software identified sequences in which the electrocardiogram R–R intervals and the systolic and diastolic BP concurrently increased or decreased for over 3 beats. The minimum change in BP was set at 1 mm Hg and the minimum change in the R–R interval was set at 5 ms. The software used the combined results of the upward and downward sequences to calculate the BRS indices. The BRS was expressed in ms per mm Hg.
Retinal arterioles measurements
Scanning laser doppler flowmetry was conducted under daylight conditions, in the sitting position, after 30 minutes of rest. No pupil dilation was used before the measurements.26 In one patient from the PV group, retinal examination did not provide valid results. Scanning laser Doppler flowmetry at 670 nm (Heidelberg Retina Flowmeter, Heidelberg Engineering, Heidelberg, Germany) was used for a confocal and noninvasive assessment of retinal arteriolar structure.27,28 A 2‑second scanning of an arteriole with a diameter size over 70 μm of the superficial retinal layer in a retinal 3‑dimensional sample of 2.56 mm length × 0.64 mm breadth × 0.3 mm deepness at a resolution of 256 points × 64 lines × 128 lines were performed. A 2‑dimensional image was automatically calculated with a pixel resolution of 10 µm length × 10 µm breadth while the deepness values were averaged. Measurements were performed in the juxtapapillary area of the right eye, 2 to 3 mm temporal superior to the optic nerve. The mean value from these 3 singular measurements was subsequently calculated. Images with insufficient sharpness of contrast, crossing and overlapping of arterioles with venues, curved arterioles, arterioles with more than 1 bifurcation, and images during which more than 4 eye movements occurred were excluded. Automatic full‑field perfusion imaging analysis (SLDF version 4.011) was performed on‑site in Warsaw and at the core reading center in Erlangen, Germany.29 Outer diameter (AD) and luminal diameter (LD) were measured in reflection images and perfusion images, respectively. The ratio of wall to lumen as well as wall thickness of retinal arterioles were calculated using the respective formulas (AD – LD)/LD and (AD – LD)/2. Wall cross‑sectional area of retinal arterioles was calculated with the formula (3.14/4) × (AD2 – LD2).
Statistical analysis
Data analysis was performed using the PASW Statistics 18 software (SPSS, Chicago, Illinois, United States). The results are presented as mean (SD) or median and interquartile range and frequency as number and percentage, where appropriate. The continuous and discrete variables were compared using the t test and the Mann–Whitney test, and categorical variables as well as the prevalence rates were compared using the χ2 test or the Fisher exact test. Normality of distributions of variables was checked with the Shapiro–Wilk test. The Pearson correlation was used to investigate the correlation of variable factors with plasma hemoglobin concentration and red blood cells. A P of less than 0.05 (2‑tailed) was considered significant.
Results
Clinical characteristics and medical history of the study population
We evaluated 20 patients (7 men [35%]; mean [SD] age, 62.6 [9.14] years) with confirmed newly diagnosed PV and 20 control patients (7 males [35%]; mean [SD] age, 58.3 [11.31] years). Hypertension was diagnosed in 15 patients (75%) with PV and in 17 patients (85%) from the control group. Patients with PV and the control group did not differ in the prevalence of diabetes, smoking, and obesity (Table 1).
Parameter | PV group (n = 20) | Control group (n = 20) | P values | |
Abbreviations: BMI, body mass index; IQR, interquartile range; PV, polycythemia vera | ||||
Sex, n | Male | 7 | 7 | 0.99 |
Female | 13 | 13 | ||
Age, y, mean (SD) | 62.65 (9.14) | 58.3 (11.31) | 0.19 | |
BMI, kg/m2, mean (SD) | 26.56 (6.1) | 28.87 (4.62) | 0.28 | |
Hypertension, n (%) | 15 (75) | 17 (85) | 0.43 | |
Hypotensive drugs, n, median (IQR) | 1 (0–3) | 2.5 (0–4) | 0.22 | |
Diabetes, n (%) | 3 (15) | 4 (20) | 0.68 | |
Smoking, n (%) | 4 (20) | 4 (20) | 0.98 | |
Abdominal obesity, n (%) | 12 (60) | 14 (70) | 0.51 | |
By study design, no differences in office and 24‑hours BP levels between the groups were noted. Patients from the study group were comparable with the control group according to the systolic and diastolic BP dipping pattern (Table 2). However, patients from the PV group were characterized by lower 24‑hour systolic and diastolic BP variability (Table 2). There were no differences in the number and classes of antihypertensive agents (Supplementary material, Table S1).
Parameter | PV group (n = 20) | Control group (n = 20) | P value |
Data are presented as mean (SD).
Abbreviations: DBP, diastolic blood pressure; HR, heart rate; PP, pulse pressure; PV, polycythemia vera; SBP, systolic blood pressure | |||
Office SBP, mm Hg | 134 (22) | 131 (16) | 0.61 |
Office DBP, mm Hg | 80 (10) | 78 (10) | 0.63 |
Office PP, mm Hg | 54 (17) | 53 (13) | 0.73 |
24‑hour SBP, mm Hg | 127 (14) | 124 (14) | 0.48 |
24‑hour DBP, mm Hg | 76 (6) | 74 (8) | 0.47 |
24‑hour PP, mm Hg | 51 (12) | 50 (11) | 0.79 |
24‑hour SBP SD, mm Hg | 9 (3) | 12 (3) | 0.003 |
24‑hour DBP SD, mm Hg | 8 (2) | 9 (2) | 0.01 |
Daytime SBP, mm Hg | 129 (14) | 126 (15) | 0.55 |
Daytime DBP, mm Hg | 78 (6) | 77 (9) | 0.75 |
Daytime PP, mm Hg | 51 (12) | 50 (12) | 0.78 |
Nighttime SBP, mm Hg | 120 (15) | 116 (13) | 0.42 |
Nighttime DBP, mm Hg | 69 (7) | 68 (8) | 0.65 |
Nighttime PP, mm Hg | 50 (13) | 48 (10) | 0.51 |
Nighttime SBP dipping | 8 (5) | 8 (6) | 0.75 |
Nighttime DBP dipping | 11 (7) | 12 (5) | 0.82 |
24‑hour HR, bpm | 63 (7) | 69 (12) | 0.94 |
24‑hour HR day, bpm | 64 (8) | 72 (13) | 0.06 |
24‑hour HR night, bpm | 59 (7) | 64 (11) | 0.16 |
Patients with PV had higher red blood cell, white blood cell, and platelet counts. Mean hemoglobin concentrations and hematocrit levels were also higher in the PV group (Table 3). The biochemical parameters between PV and control patients were comparable, with the exception of a higher serum potassium concentration in patients with PV (Table 3). Patients with PV were characterized by a lower plasma‑free metanephrine concentration and a lower urinary secretion of metanephrine and norepinephrine. Of note, patients from the PV group had lower plasma aldosterone concentration (Table 3).
Parameter | PV group (n = 20) | Control group (n = 20) | P value |
Data are presented as mean (SD) or median (interquartile range).
SI conversion factors: to convert uric acid to μmol/l, multiply by 59.48.
Abbreviations: EPI, epinephrine; GFR, glomerular filtration rate; HCT, hematocrit; HDL‑C, high‑density lipoprotein cholesterol; HGB, hemoglobin; LDL‑C, low‑density lipoprotein cholesterol; MCH, mean corpuscular hemoglobin; MCHC, corpuscular / cellular hemoglobin concentration; MCV, mean corpuscular volume of red blood cells; MN, metanephrine; NE, norepinephrine; NMN, normetanephrine; PLT, thrombocyte; PRC, plasma renin concentration; PV, polycythemia vera; RBC, red blood cell; TSH, thyroid stimulating hormone; WBC, leukocyte | |||
RBC, × 106/μL | 6.3 (1.02) | 4.82 (0.83) | <0.001 |
WBC, × 103/μl | 10.45 (8.05–13.02) | 6.25 (5.03–7.3) | 0.001 |
HGB, g/dl | 16.63 (1.77) | 14.1 (1.92) | <0.001 |
Platelet counts, × 103/μl | 510.76 (232.86) | 188.15 (43.13) | <0.001 |
MCV, fl | 81.64 (7.77) | 91.08 (4.84) | <0.001 |
MCHC, g/dl | 32.60 (31.25–33.58) | 33.7 (32.98–34.35) | 0.025 |
MCH, pg | 27.52 (3.74) | 31.37 (2.1) | <0.001 |
HCT, % | 41.96 (1.94) | 39.19 (3.37) | 0.02 |
Glucose, mmol/l | 5.13 (0.74) | 5.49 (0.58) | 0.14 |
Creatinine, μmol/l | 72.5 (69.50–84.75) | 75 (59–81.75) | 0.42 |
GFR, ml/min/m2 | 84 (21.9) | 82.2 (19.7) | 0.85 |
Na, mmol/l | 141.5 (2.87) | 142.15 (2.23) | 0.43 |
K, mmol/l | 5.05 (0.49) | 4.29 (0.45) | <0.001 |
Total cholesterol, mmol/l | 4.48 (1.04) | 4.99 (1.2) | 0.16 |
LDL‑C, mmol/l | 2.8 (0.88) | 2.98 (1.05) | 0.56 |
HDL‑C, mmol/l | 1.2 (0.39) | 1.39 (0.46) | 0.17 |
Triglycerides, mmol/l | 1.44 (0.45) | 1.38 (0.6) | 0.73 |
Uric acid, mg/dl | 308.11 (88.49) | 349 (95.66) | 0.19 |
TSH, μIU/ml | 1.21 (0.75) | 1.82 (1.03) | 0.09 |
Plasma NMN, pg/ml | 79.05 (34.4) | 82.16 (41.37) | 0.81 |
Plasma MN, pg/ml | 25.93 (8.5) | 38.84 (10.75) | <0.001 |
Urine free NMN, ug/d | 17.13 (15.18–21.2) | 24 (18.2–29.88) | 0.033 |
Urine free MN, ug/d | 11.47 (5.59) | 18.96 (8.51) | 0.007 |
Urine free NE, ug/d | 16.54 (6.32) | 25.46 (12.88) | 0.03 |
Urine free EPI, ug/d | 3 (1.76–5.4) | 3.87 (2.53–4.47) | 0.35 |
Aldosterone, pg/ml | 91 (59.25–120.25) | 129 (100.25–177.75) | 0.008 |
PRC, pg/ml | 7.3 (4.9–14.65) | 6.05 (3.48–16.45) | 0.54 |
There were no significant differences between the groups according to retinal arteriolar parameters and retinal capillary blood flow. There were also no differences in carotid intima‑media thickness, intrarenal blood flow parameters, left ventricular mass index, and estimated glomerular filtration rate, and urinary albumin excretion between the PV and control groups (Table 4).
Parameter | PV group (n = 20) | Control group (n = 20) | P value |
Data are presented as mean (SD) or median (interquartile range).
Abbreviations: AD, outer diameter of retinal arterioles; AU, arbitrary units; IMT, intima–media thickness; LD, lumen diameter of retinal arterioles; LVMI, left ventricular mass index; PI, renal pulsatility index; PV, polycythemia vera; RCF, retinal capillary flow; RI, renal resistive index; WCSA, wall cross‑sectional area of retinal arterioles; WLR, wall‑to‑lumen ratio; WT, wall thickness of retinal arterioles | |||
RCF, AU | 237.62 (218.51–307.64) | 314.95 (280.02–368.02) | 0.085 |
VD, µm | 108.38 (10.5) | 109.85 (13.78) | 0.73 |
LD, µm | 80.94 (6.18) | 80.52 (11.83) | 0.9 |
WT, µm | 13.72 (3.42) | 14.61 (3.65) | 0.47 |
WLR | 0.34 (0.27–0.39) | 0.31 (0.26–0.46) | 0.63 |
WCSA, µm2 | 3930 (3082–5358) | 4189 (3211–4536) | 0.68 |
RI | 0.67 (0.06) | 0.67 (0.08) | 0.96 |
PI | 1.33 (0.22) | 1.28 (0.31) | 0.64 |
IMT, mm | 0.88 (0.2) | 0.77 (0.12) | 0.11 |
Albumin excretion, mg/24 hours | 14.7 (9.8–19.6) | 12.6 (9.9–19.6) | 0.77 |
LVMI, g/m2.7 | 51.3 (9.6) | 53.9 (15) | 0.62 |
Correlations between hemoglobin concentration and red blood cell count and retinal capillary flow (r = –0.569; P = 0.001 and r = –0.401; P = 0.02) and aldosterone concentration (r = –0.331; P = 0.04 and r = –0.327; P = 0.04) were noted. There was no significant correlation between plasma hemoglobin concentrations and red blood cell count with systolic and diastolic office and ambulatory BP and PP levels nor with parameters of kidney function and intra‑renal blood flow.
Sympathetic nervous activity in patients with hypertension and polycythemia vera
Demographic, laboratory, and clinical characteristics of the subgroup of 12 PV patients and matched controls are presented in Supplementary material, Tables S2 and S3. Patients with PV had similar systolic and diastolic BP values, both in office and in ambulatory BP measurements. There were no differences in office HR between groups; however, patients with PV had significantly lower HR in ABPM during 24 hours, as well as during daytime and nighttime (Supplementary material, Table S2).
Patients with PV were characterized by lower MSNA/min and MSNA/100 heart beats than controls (30.7 [8.7]/min vs 38.7 [5.4]/min; P = 0.007 and 51.8 [11]/100 beats vs 61.1 [11.3]/100 heart beats, respectively; P = 0.04) (Figure 1 and Figure 2A and 2B). Baroreflex control of HR was similar in both PV and essential hypertension groups (mean [SD], 14.4 [6] and 11.5 [3] ms/mm Hg, respectively; P = 0.1). There was a significant correlation between MSNA/min and urine free norepinephrine excretion (r = 0.601; P = 0.04).
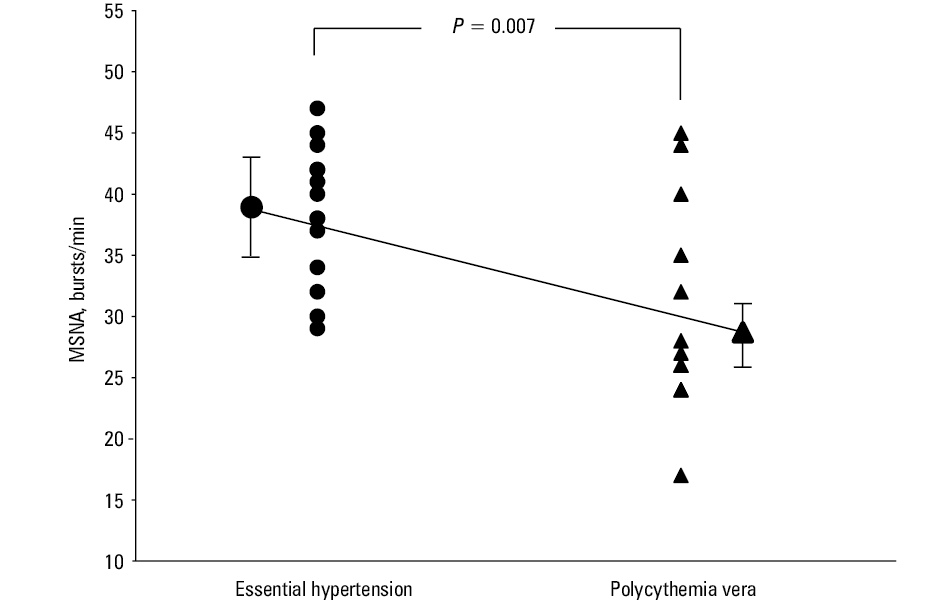
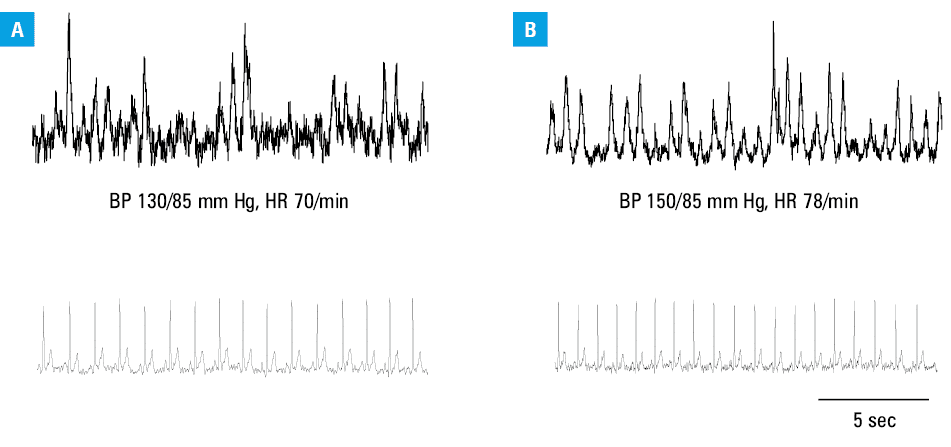
Abbreviations: BP, blood pressure; HR, heart rate
Discussion
One of the most important findings of our study was that patients with newly diagnosed PV were not characterized by more pronounced target organ damage as compared with matched control group. Our data does not support the concept that the high cardiovascular risk associated with PV is mediated by activation of the sympathetic nervous system. In fact, all parameters of sympathetic activity assessed in the current study (MSNA and catecholamine levels, BP variability and tendency toward slower HR) were lower in PV than in controls. The baroreflex control of HR was not altered, which suggests a selective impairment of sympathetic neural mechanisms with preserved parasympathetic cardiovascular modulation.
The mechanisms underlying these novel findings were not directly addressed, but several factors might be implicated. Patients with PV are iron deficient. The coexistence of polycythemia and iron deficiency presents a “physiological disconnect.”30 A previous study on hemochromatosis31 has shown that iron overload was associated with sympathetic overactivity, which was reversed by iron depletion. Furthermore, iron appears to influence oxygen sensing in the carotid body.32 Importantly, peripheral arterial chemoreceptors have a significant physiological activity in normoxia, the so‑called resting drive. Hypertension is characterized by the tonic activation of excitatory chemoreceptor afferents contributing to the elevated sympathetic activity and increased BP.33
Thus, it is plausible that dysregulated iron metabolism and aberrant hypoxia sensing and signaling30 might diminish hypertension‑related tonic chemoreflex activation and contribute to lower levels of sympathetic activity observed in patients with PV. Finally, lower aldosterone levels might play a role as the relation between the renin‑angiotensin‑aldosterone system and the sympathetic system is a positive feedback mechanism.34
Our study showed that hypertension in patients with PV was highly prevalent (75%), a finding which is in concordance with Rusak et al18 (78%). Interestingly, several other reports including the CYTO, GIMEMA, and ECLAP studies found a significantly lower rate of hypertension in patients with PV (48%, 47% and 40% respectively).1,14,35,36 In our study, we have evaluated the clinical course of hypertension in individuals with PV, which was generally well controlled both in office and on ABPM with a low median number of medications required for hypertension treatment. We did not observe higher frequency of the nondipping pattern of BP at night, which was comparable to those in the control group.
Recently, Barbui et al2 demonstrated that among cardiovascular risk factors, hypertension had the most relevant prognostic role for the incidence of arterial thrombosis in patients with PV with a low risk for future vascular complications. It has been documented that increased hematocrit levels in patients with PV are associated with increased blood viscosity, BP levels, and incident hypertension.3-5,7,8 Several reports, including a recent population‑based study, showed that healthy individuals with higher baseline hematocrit levels are at an increased risk of hypertension.8 These results suggest an important role of hematocrit in the development of hypertension in the general population, which can also be applied to patients with PV. Also, increased hematocrit level and blood hyperviscosity play a major role in the pathogenesis of arterial and venous thrombotic complications in PV. Findings from the Glasgow Blood Pressure Clinic Cohort demonstrated that hematocrit predicted long‑term mortality in hypertensive adults.3,4,7-9,17,35
In our previous study, we observed an association between hematocrit values and impaired heart systolic function, which suggested the direct relationship between PV and early changes in the cardiovascular system.15 Our analysis was based on the evaluation of strain parameters, including global, circumferential, and radial strain parameters and was compared with the control group. However, our evaluation of cardiac structure demonstrated that there were no differences in the left ventricular mass index between patients with PV and those with EH.15 We also did not find relationship between hematocrit and plasma hemoglobin concentrations and subclinical vascular and renal damage.
It has also been postulated that high platelet count and platelet functional abnormalities may be involved in the mechanisms underlying the microcirculatory disturbances in patients with PV.11
To the best of our knowledge this is the first study to evaluate the retinal arteriolar structure in PV, and compare it with a matched control group using noninvasive scanning laser Doppler flowmetry. We documented that the baseline retinal arterial diameter, arterial wall thickness, and wall cross‑sectional area were not different in patients with PV as compared with the control group. One interesting new finding showed an inverse correlation between rheological indices (hemoglobin and red blood cell count) and retinal capillary flow, which may suggest a relationship between rheological disturbances and impaired retinal blood flow.
It should be noted that available studies have previously documented the predominant role of hemorheological disturbances (increased hematocrit level and augmented blood viscosity) in the development of incident hypertension in patients with PV.3,9
Additionally, a potential role of the renin‑angiotensin system has been discussed. A recent study has shown an overexpression of the renin‑angiotensin system in the bone marrow of patients with PV. This phenomenon may lead to hematopoietic progenitor cell stimulation, in addition to hypertension.10 However, since it was not the aim of our study, we were unable to document the role of the aforementioned mechanism in the pathogenesis of hypertension in our group of patients with PV.
Our study has several limitations. Firstly, it included a small number of patients; however, it was comparable with other reports. Secondly, the discussion in regard to the new potential mechanism involved in the pathogenesis of hypertension in relation to blood parameters is rather speculative. Larger studies are needed also to clarify whether lower parameters of the activity of the sympathetic nervous system may influence the clinical outcome of these patients. Third, antihypertensive drugs may have affected some of the variables under investigation (eg, β-blockers may have affected sympathetic nervous system activity; diuretics, potassium level and the activity of the renin‑angiotensin‑aldoterone system). However, the frequency of use of particular antihypertensive drugs was similar between PV and control patients. Furthermore, serum potassium concentration was within normal limits. Despite these limitations, our study is the first to characterize BP profile and clinical course of hypertension in patients with PV, sympathetic nervous system activity, and subclinical organ damage in the heart, carotid arteries, and kidneys.
In summary, our study was the first attempt to assess the activity of the sympathetic nervous system in patients with PV. We have shown that an increased cardiovascular risk in patients with PV is not mediated by activation of the sympathetic nervous system. In fact, both MSNA and catecholamine levels were lower in patients with PV than in controls and this was expressed by decreased BP variability and tendency toward slower HR. The baroreflex control of HR was not altered suggesting a selective impairment of sympathetic neural mechanisms with preserved parasympathetic cardiovascular modulation. It may be hypothesized that dysregulated iron metabolism and aberrant hypoxia signaling might diminish tonic chemoreflex activation and contribute to lower levels of sympathetic activity in patients with PV.
A detailed clinical evaluation of patients with PV showed that hypertension, characterized by preserved dipping status, was generally well controlled both in office and on ABPM with a low median number of medications required for hypertension. Our study documented no relationship between rheological variables and subclinical target organ damage analyzed in patients with PV. Lastly, our data showed that patients with PV and a high hemoglobin plasma concentration and hematocrit levels had a lower sympathetic nervous activity and decreased BP variability.
- Marchioli R, Finazzi G, Specchia G, et al. Cardiovascular events and intensity of treatment in polycythemia vera. N Engl J Med. 2013; 368: 22‑33. | Crossref
- Barbui T, Vannucchi AM, Carobbio A, et al. The effect of arterial hypertension on thrombosis in low‑risk polycythemia vera. Am J Hematol. 2017; 92: E5‑E6. | Crossref
- Spencer CG, Lip GY. Haemorheological factors in hypertension. J Hum Hypertens. 2000; 14: 291‑293. | Crossref
- Letcher RL, Chien S, Pickering TG, et al. Direct relationship between blood pressure and blood viscosity in normal and hypertensive subjects. Role of fibrinogen and concentration. Am J Med. 1981; 70: 1195‑1202. | Crossref
- Devereux RB, Case DB, Alderman MH, et al. Possible role of increased blood viscosity in the hemodynamics of systemic hypertension. Am J Cardiol. 2000; 85: 1265‑1268. | Crossref
SUPPLEMENTARY MATERIAL
ARTICLE INFORMATION