Increased adiponectin gene expression in adipose tissue may be related to an abnormal serum fatty acid profile in patients with chronic kidney disease


 CC BY-NC-SA 4.0
Increased adiponectin gene expression in adipose tissue may be related to an abnormal serum fatty acid profile in patients with chronic kidney disease
Introduction
Chronic kidney disease (CKD) is associated with increased serum leptin and adiponectin levels, which may lead to CKD progression and increase the risk of comorbidities.1 Our previous study showed that increased leptin gene expression in subcutaneous adipose tissue (SAT) in patients with CKD contributes to elevated levels of this adipokine.2 Moreover, CKD‑related alterations of the fatty acid (FA) profile play a role in the increase in serum leptin levels in patients with CKD by increasing the gene expression of this adipokine in adipocytes.2 Adiponectin is another abundant adipocyte‑derived hormone with a wide range of biologic functions. Adiponectin, like leptin, is involved in energy homeostasis, but these 2 adipokines act in different ways. While leptin inhibits hunger and has proinflammatory properties,3 adiponectin has been shown to enhance insulin sensitivity and inflect inflammatory responses, thus, it plays a key role in the protection from insulin resistance, type 2 diabetes, metabolic syndrome, and atherosclerosis.4 Numerous studies have demonstrated an abnormal serum FA profile in patients with CKD.5,6 Lipid disorders in CKD increase the risk of cardiovascular disease, contributing to the unacceptably high mortality risk observed in this patient population.7 Adiponectin, leptin, and FA are critical messengers for the crosstalk between adipose tissue and other organs relevant for metabolism, including the kidneys. Although alterations in the adiponectin level and the FA profile can be associated with CKD pathogenesis and complications, the relationship between them has not been studied so far. It remains unclear whether changes in the adiponectin level in CKD are the effect of a reduced glomerular filtration rate or increased production in adipose tissue, or maybe both. Thus, we aimed to examine the associations between the adiponectin serum level and the expression of its gene in adipose tissue. Moreover, the effect of the CKD‑related abnormal serum FA profile on the expression of the adiponectin gene in adipocytes was analyzed.
Patients and methods
Study group
The study included 46 patients with stage 5 CKD (predialysis and dialysis) and 57 subjects free from kidney diseases, matched for age and weight. Among those participants, SAT was taken from 22 CKD patients during kidney transplant and from 11 control subjects free from kidney diseases during hernia surgeries. The research scheme showing the process of the recruitment of study subjects and collection of biological material is presented in Supplementary material, figure S1. The characteristics of the study patients were reported elsewhere.2,8 Blood samples were taken after overnight fasting from all study subjects. The study was performed in agreement with the principles of the Declaration of Helsinki of the World Medical Association and approved by the local bioethics committee (protocol no., NKBBN/664/2013–2014 and NKBBN/614–276/2014). Written informed consent was obtained from all study participants.
Serum adiponectin assay
The Human Adiponectin ELISA kit (BioVendor, Brno, Czech Republic) was used to measure serum adiponectin levels in the study patients.
Fatty acid profile determination
Fatty acid profiles were analyzed by gas chromatography–mass spectrometry using the QP‑2010SE apparatus (Shimadzu, Kyoto, Japan), as described elsewhere.2,8
Cell cultures
The 3T3‑L1 adipocyte culture was grown and differentiation performed, as described elsewhere.2 Fully differentiated 3T3‑L1 adipocytes were used for experiments. Cells were supplemented with one of the following FAs for 48 hours: palmitic acid (PAL, 16:0), oleic acid (OA, 18:1), docosahexaenoic acid (DHA, 22:6 n‑3), and arachidonic acid (AA, 20:4 n‑6) in 3 concentrations (25 µm, 50 µm, and 100 µm). Moreover, 3T3‑L1 adipocytes were supplemented with a FA mix pooled from the FA isolated from serum of stage 5 CKD patients and healthy controls—from randomly selected patients and control serum samples, total lipids were extracted and hydrolyzed, as previously described.2,5
Adiponectin mRNA level analysis
Total RNA was isolated from in vitro cultured adipocytes and SAT, and mRNA levels were analyzed by real‑time polymerase chain reaction in the same way as described elsewhere.2
Statistical analysis
Statistical analyses were performed for 2 groups compared by using the t test for normally distributed data or the Mann–Whitney rank sum test for data without normal distribution. The analysis of variance followed by Bonferroni post hoc correction was used for multigroup comparisons. The differences were considered significant if the P value was lower than 0.05. Relationships between pairs of variables were determined based on the Pearson correlation analysis. Statistical analyses were conducted using the STATISTICA 12 software (TIBCO Software, Inc., Palo Alto, California, United States).
Results
Adiponectin levels in serum were almost 2‑fold higher in the CKD group than in the control group (figure 1A). Similarly, the relative mRNA level of the adiponectin gene expression in SAT of patients with CKD was almost twice as high as that noted in controls (figure 1B). The serum FA profile turned out to be substantially altered in CKD patients compared with controls, including significantly increased total saturated FA (SFA) and monounsaturated FA (MUFA) content as well as decreased levels of total n‑3 polyunsaturated FA (PUFA) and n‑6 PUFA, as reported in our previous paper.2 Moreover, we found weak yet significant negative correlations of adiponectin mRNA in SAT with n‑3 PUFA (r = –0.39, P = 0.03) and weak positive correlations of adiponectin mRNA with MUFA (r = 0.36, P = 0.04). Serum adiponectin levels negatively correlated with n‑3 and n‑6 PUFA (r = –0.35, P <0.001 and r = –0.2, P = 0.04, respectively), whereas positively with SFA (r = 0.23, P = 0.02).
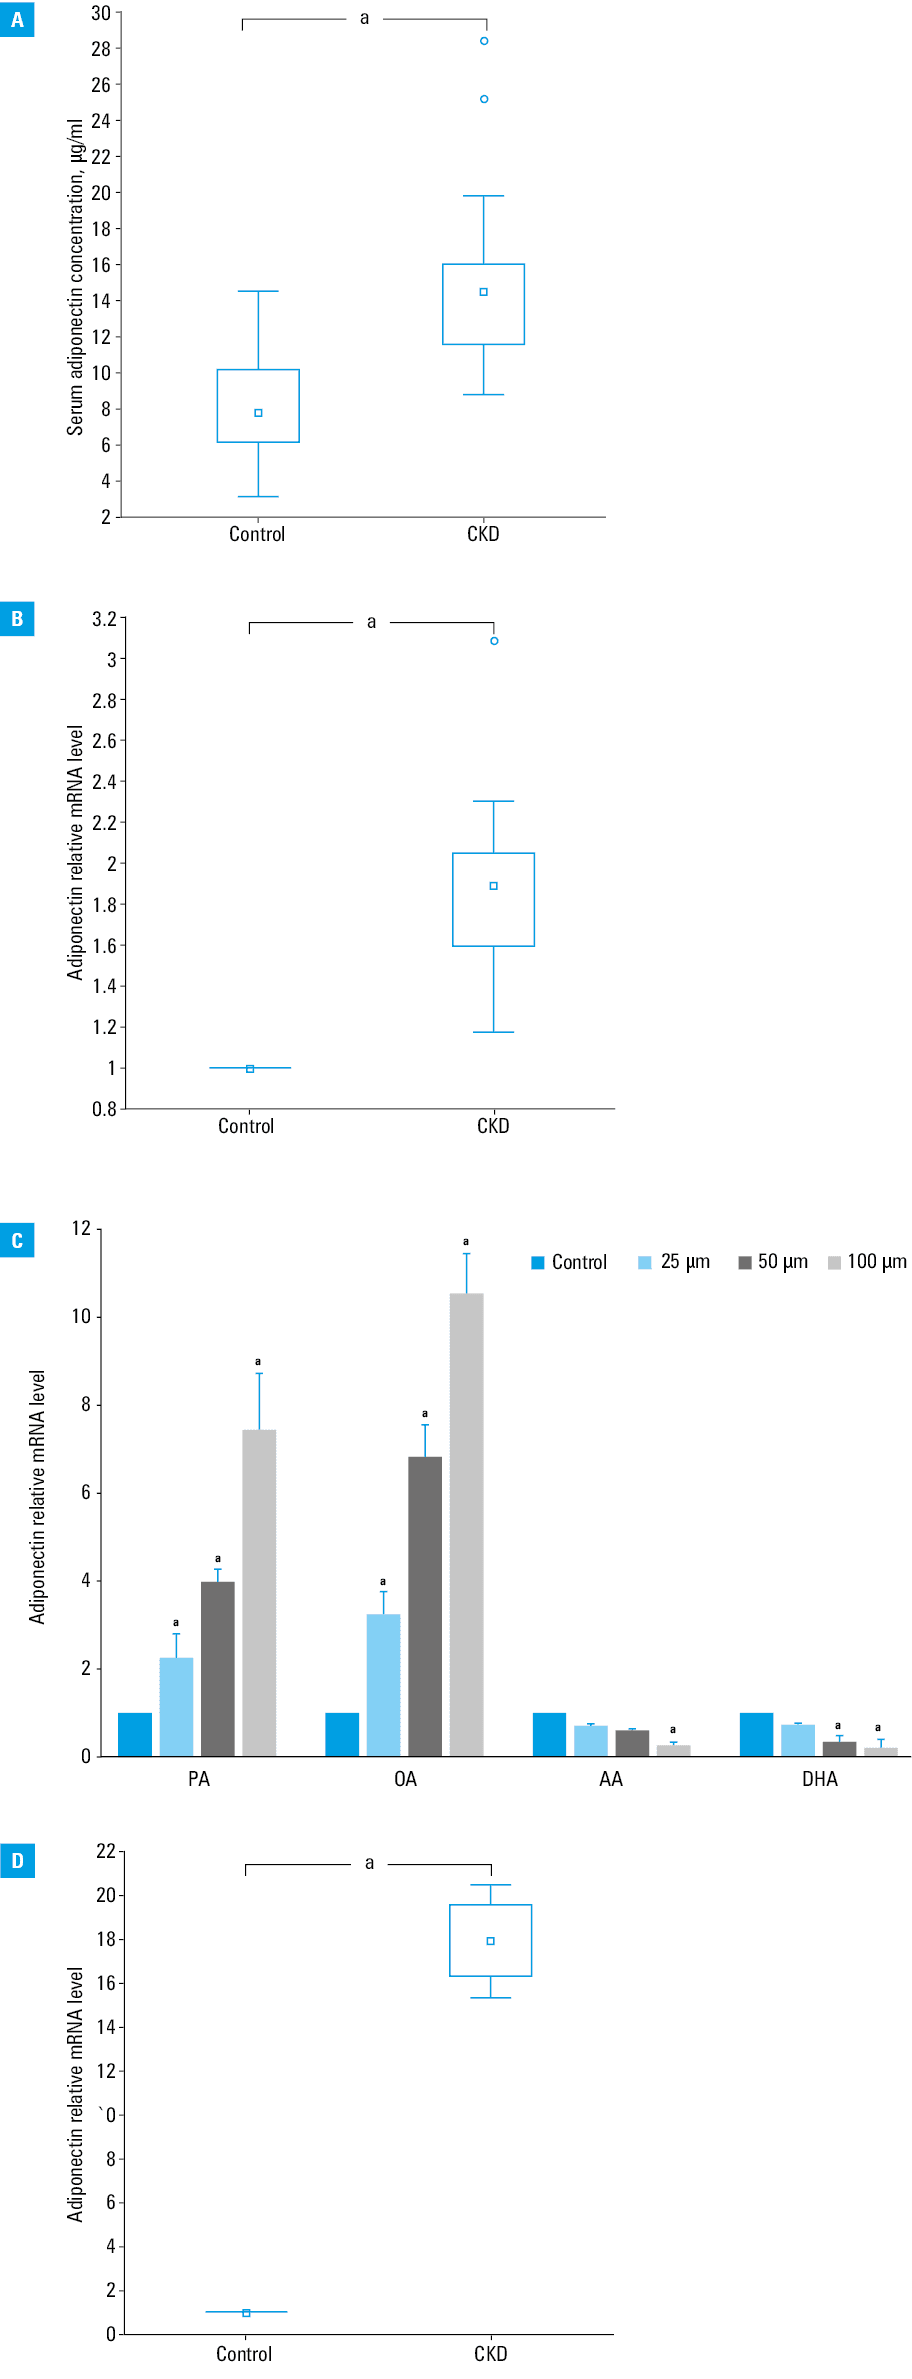
To verify if the reported alterations in the serum FA profile had an impact on adipocyte adiponectin gene expression, we treated 3T3‑L1 adipocytes with the representatives of SFA (PAL), MUFA (OA), n‑3 PUFA (DHA), and n‑6 PUFA (AA). After 48 hours of incubation with PAL and OA, ie, FA levels elevated in patients with CKD, adiponectin gene expression was strongly increased, whereas after incubation with DHA and AA, ie, FA levels decreased in patients with CKD, the expression of the adiponectin gene was strongly reduced (figure 1C). These effects were found to be dose‑dependent. Moreover, we used a complete set of FAs isolated from the serum samples of CKD patients and healthy controls. The incubation of adipocytes with a set of FAs obtained from patients with stage 5 CKD caused a significant increase in the adiponectin mRNA level as compared with adipocytes incubated with FAs isolated from healthy subjects (figure 1D).
Discussion
Our study demonstrated increased serum adiponectin levels in patients with CKD, which is in line with the most up‑to‑date clinical studies on adiponectin alterations in kidney diseases.9 It is known that adiponectin is associated with decreased cardiovascular risk but only in people with normal kidney function. Paradoxically, in patients with CKD, it is the higher level of adiponectin that is associated with increased risk of all‑cause and cardiovascular mortality.10
Therefore, evaluating the mechanisms of increased adiponectin levels in the course of CKD seems to be of clinical importance.
Further, we showed that the increased serum levels of adiponectin observed in patients with CKD are associated with an increased expression of the adiponectin gene in SAT. Previous studies suggested that decreased kidney function (and decreased renal clearance of adipokines) might be the major culprit for elevated blood adiponectin levels in CKD.11 However, our findings indicated that the increased SAT adiponectin gene expression may substantially contribute to the observed serum adiponectin concentrations. In a study by Cantarin et al,12 similarly increased SAT adiponectin gene expression in CKD was found. However, the molecular mechanisms of increased adiponectin expression in CKD patients remains unclear.
Our recent study has shown that it is the CKD‑related alterations in the FA profile that may significantly contribute to elevated leptin gene expression in SAT and serum leptin levels.2 In the present study, we found an increase in adiponectin gene expression in response to SFA and MUFA representatives as well as a reduction in the adiponectin mRNA level in response to both n‑3 and n‑6 PUFA in adipocytes. These results suggest that the abnormal FA profile of CKD patients may stimulate adiponectin gene expression in adipocytes, similarly to leptin. However, the changes in the FA profile during CKD should be considered together, as each specific FA may have a different effect on adipocytes. Thus, we used a complete set of FAs extracted from serum of CKD patients and controls. Our data, for the first time, demonstrated that the altered serum FA profile observed in patients with CKD increased the expression of adiponectin in adipocytes. The correlations between the serum levels of the main FA groups with both the adiponectin mRNA level in SAT as well as serum adiponectin levels in the study subjects, although weak, may also altogether indicate associations between these parameters. N‑3 PUFAs represented the group that showed the strongest correlation with both adiponectin mRNA and serum levels. However, these results suggest that not only some selected groups of FAs but also the whole altered profile in patients with CKD leads to increased adiponectin expression in adipose tissue.
In conclusion, our study showed that the alteration of the serum FA profile observed in the course of CKD might contribute to CKD‑related elevated serum adiponectin levels through influencing its gene expression in adipocytes. Considering the relationships between adiponectin and mortality in patients with CKD, future studies clarifying the clinical significance of these associations are awaited.
- Yu JZ, Kalantar‑Zadeh K, Rhee CM. Adiponectin and leptin in kidney disease patients. In: Rhee CM, Kalantar‑Zadeh K, Brent GA, eds. Endocrine Disorders in Kidney Disease. Springer International Publishing; Cham: 2019; 277‑290. | Crossref
- Korczyńska J, Czumaj A, Chmielewski M, et al. Increased expression of the leptin gene in adipose tissue of patients with chronic kidney disease‑the possible role of an abnormal serum fatty acid profile. Metabolites. 2020; 10: 98. | Crossref
- Mao S, Fang L, Liu F, et al. Leptin and chronic kidney diseases. J Recept. Signal Transduct. 2018; 38: 89‑94. | Crossref
- Wang ZV, Scherer PE. Adiponectin, the past two decades. J Mol Cell Biol. 2016; 8: 93‑100. | Crossref
- Czumaj A, Śledziński T, Carrero JJ, et al. Alterations of fatty acid profile may contribute to dyslipidemia in chronic kidney disease by influencing hepatocyte metabolism. Int J Mol Sci. 2019; 20: 2470. | Crossref
SUPPLEMENTARY MATERIAL
ARTICLE INFORMATION