Obesity in patients with established coronary artery disease over a 20-year period (1997–2017)
Key words: coronary artery disease, obesity, overweight, prevention, risk factors


 CC BY-NC-SA 4.0
Obesity in patients with established coronary artery disease over a 20-year period (1997–2017)
Background: Body mass reduction in overweight and obese people so as to reduce blood pressure, low‑density lipoprotein cholesterol level, and the risk of type 2 diabetes as well as to lower the risk of recurrent cardiovascular events is strongly recommended in current guidelines.
Objectives: To evaluate changes in body mass index (BMI) and waist circumference in patients with established coronary artery disease over a 20‑year period (1997–2017).
Patients and methods: Consecutive patients younger than 71 years of age and hospitalized for acute coronary syndrome or myocardial revascularization procedures were recruited and interviewed 6 to 18 months after their discharge from hospital. Weight, height, and waist circumference were measured in 1997 to 1998, 1999 to 2000, 2006 to 2007, 2011 to 2013, and 2016 to 2017. The same 5 hospitals took part in the surveys each time.
Results: We examined 412 patients in 1997 to 1998 (survey 1), 427 in 1999 to 2000 (survey 2), 422 in 2006 to 2007 (survey 3), 462 in 2011 to 2013 (survey 4), and 272 in 2016 to 2017 (survey 5). The proportion of obese patients was 24.5% in survey 1, 27.2% in survey 2, 34.1% in survey 3, 35.9% in survey 4, and 40.4% in survey 5 (P <0.001). The proportion of patients with central obesity also increased significantly (32.5% in survey 1, 40.5% in survey 2, 51.4% in survey 3, 48.6% in survey 4, and 61.3% in survey 5; P <0.001). BMI increased significantly in men, but not in women, whereas the mean waist circumference increased in both sexes. BMI and waist circumference increased irrespective of age and education.
Conclusions: The analysis of 5 multicenter surveys showed a gradual increase in BMI and waist circumference in patients with established coronary artery disease over the course of 2 decades.
What's new?
Current guidelines recommend body mass reduction in overweight and obese people so as to reduce blood pressure, cholesterol level, and the risk of type 2 diabetes as well as lower the risk of recurrent cardiovascular events. Data of 5 multicenter surveys involving patients with established coronary artery disease were analyzed. A gradual increase in body mass index (BMI) and waist circumference over the course of 2 decades was shown. The proportion of patients with BMI of 30 kg/m2 or greater increased from 24.5% in 1997 to 1998 to 40.4% in 2016 to 2017. The increase in BMI was steeper in men compared with women. The trend was independent of age and education level of patients. The proportion of patients with central obesity increased from 32.5% in 1997 to 1998 to 61.3% in 2016 to 2017.
Introduction
Cardiovascular disease (CVD) is the leading cause of death in developed countries.1 Despite advances in pharmacological and invasive coronary artery disease (CAD) treatment in recent years, mortality after myocardial infarction is still high.2 The main causes of high mortality following myocardial infarction include inadequate control of risk factors, insufficient lifestyle changes, and suboptimal pharmacotherapy.3-6 The obesity epidemic is a relatively new threat to the health of modern societies. There are predictions that if current trends in obesity prevalence persist, obesity will offset the positive effects resulting from the modern management of cardiovascular disease.7 Current guidelines recommend body mass reduction in overweight and obese people so as to reduce blood pressure, low‑density lipoprotein cholesterol, and the risk of type 2 diabetes as well as to lower the risk of recurrent CVD.8 The aim of the present analysis was to assess trends in overweight and obesity prevalence in patients with established CAD over a 20‑year period (1997–2017).
Patients and methods
We analyzed data of participants of 5 surveys assessing cardiovascular prevention following hospitalization due to CAD that were conducted in 1997 to 1998 (survey 1), 1999 to 2000 (survey 2), 2006 to 2007 (survey 3), 2011 to 2013 (survey 4), and 2016 to 2017 (survey 5).9-13 The same 5 hospitals serving the city and surrounding districts participated in each survey. The methods used in these surveys had been published previously and were similar on each occasion.9-13 In brief, the study sample in each survey consisted of consecutive patients hospitalized for myocardial infarction, unstable angina, percutaneous coronary intervention, or coronary artery bypass grafting. Since the age limit in surveys 1 (1997–1998) and 2 (1999–2000) was less than 71 years, we excluded from the present analysis all older participants from the other 3 surveys.
The examinations took place 6 to 18 months after the index hospitalization. Data on patients’ medical history and medications were obtained with a standard questionnaire. Education of the participants was assessed using number of years spent on education as well as a categorical variable (at least secondary education vs lower than secondary education). Height and weight were measured in a standing position without shoes and heavy outerwear using standard scales with a vertical ruler (Seca, Hamburg, Germany). The scales were calibrated at the start of each survey. BMI was calculated as weight in kilograms divided by height in meters squared. Overweight was defined as BMI between 25 and 29.9 kg/m2 and obesity as BMI of 30 kg/m2 or greater. Waist circumference was measured using a metal tape measure placed horizontally along the mid‑axillary line, midway between the lowest rim of the rib cage and the tip of the hip bone with the patient in a standing position. Central overweight was defined as the waist circumference measurement of between 94 and 102 cm in men and between 80 and 88 cm in women.8 Abdominal obesity was defined as a waist circumference of 102 cm or greater in men and 88 cm or greater in women.
The survey protocols were approved by the institutional Bioethics Committee. Every patient signed an informed consent form.
Statistical analysis
Categorical variables were reported as percentages and continuous variables as means (SDs). The Pearson χ2 test was applied to all the categorical variables. Normally distributed continuous variables were compared by using the t test or analysis of variance. Variables without normal distributions were evaluated with the Mann–Whitney test or the Kruskal–Wallis analysis of variance. Temporal trends were evaluated with linear regression for continuous variables and logistic regression for categorical variables with subsequent surveys coded as an independent variable. Multivariable logistic regression analysis was used to calculate the odds ratios of having obesity in surveys 2, 3, 4, and 5 compared with survey 1. Generalized linear models as implemented in the Statistica 13 software (TIBCO Software, Palo Alto, California, United States) were used to provide adjusted least squares means after adjusting for covariates including sex, age, education, employment, and index event. A 2‑tailed P value of less than 0.05 was regarded as indicating statistical significance.
Results
The numbers of patients who participated in the surveys were as follows: 412 in survey 1, 427 in survey 2, 422 in survey 3, 462 in survey 4, and 272 in survey 5. The characteristics of the study groups are presented in Table 1. Participants of survey 5 were older, better educated, and more often professionally active compared with participants of survey 1. No significant difference was observed in sex distribution between the surveys.
Variable | Survey 1 (n = 412) | Survey 2 (n = 427) | Survey 3 (n = 422) | Survey 4 (n = 462) | Survey 5 (n = 272) | P value | ||
Abbreviations: CABG, coronary artery bypass grafting; PCI, percutaneous coronary intervention. | ||||||||
Age, y, mean (SD) | 57.7 (8.3) | 58.6 (8.1) | 59.6 (7.5) | 60.5 (6.6) | 62.1 (6.7) | <0.001 | ||
Sex, n (%) | Male | 303 (73.5) | 298 (69.8) | 299 (70.9) | 312 (67.5) | 203 (74.6) | 0.2 | |
Female | 109 (26.5) | 129 (30.2) | 123 (29.1) | 150 (32.5) | 69 (25.4) | |||
Duration of education, y, mean (SD) | 11.4 (3.6) | 11.6 (3.5) | 11.9 (3.3) | 12.1 (3.1) | 12.9 (3) | <0.001 | ||
Professionally active, n (%) | 70 (17) | 75 (17.6) | 154 (36.5) | 124 (26.8) | 120 (44.1) | <0.001 | ||
Index event, n (%) | Myocardial
infarction | 114 (27.7) | 115 (26.9) | 98 (23.2) | 156 (33.8) | 93 (34.2) | <0.001 | |
Unstable angina | 92 (22.3) | 95 (22.3) | 114 (27) | 145 (31.4) | 47 (17.3) | |||
PCI | 99 (24) | 101 (23.7) | 133 (31.5) | 113 (24.5) | 116 (42.7) | |||
CABG | 107 (26) | 116 (27.2) | 77 (18.3) | 48 (10.4) | 16 (5.9) | |||
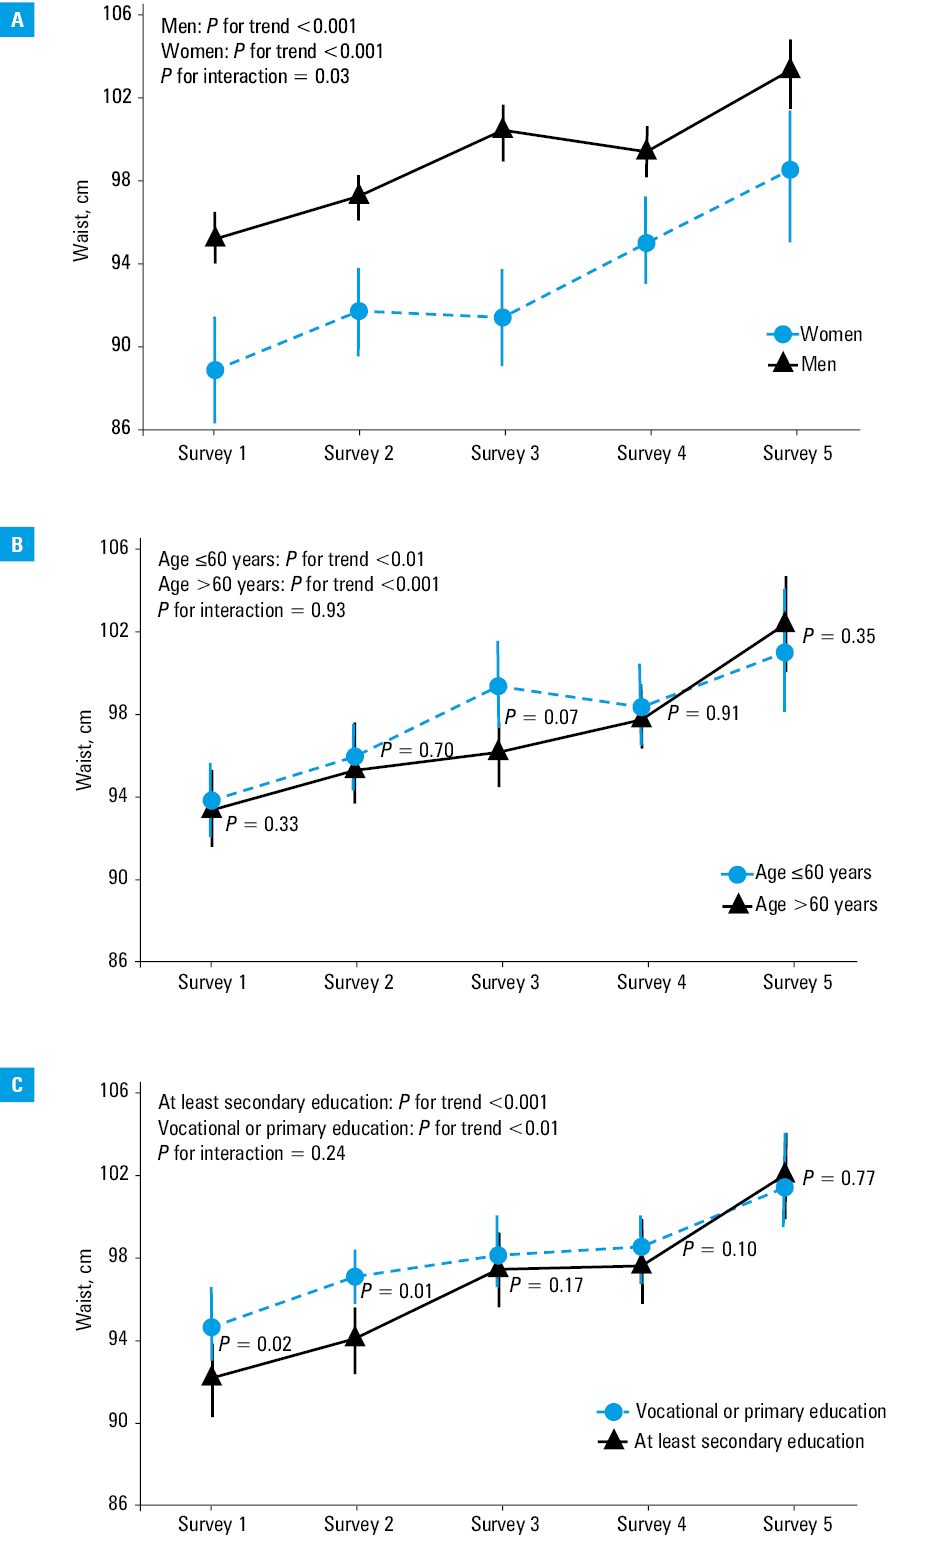
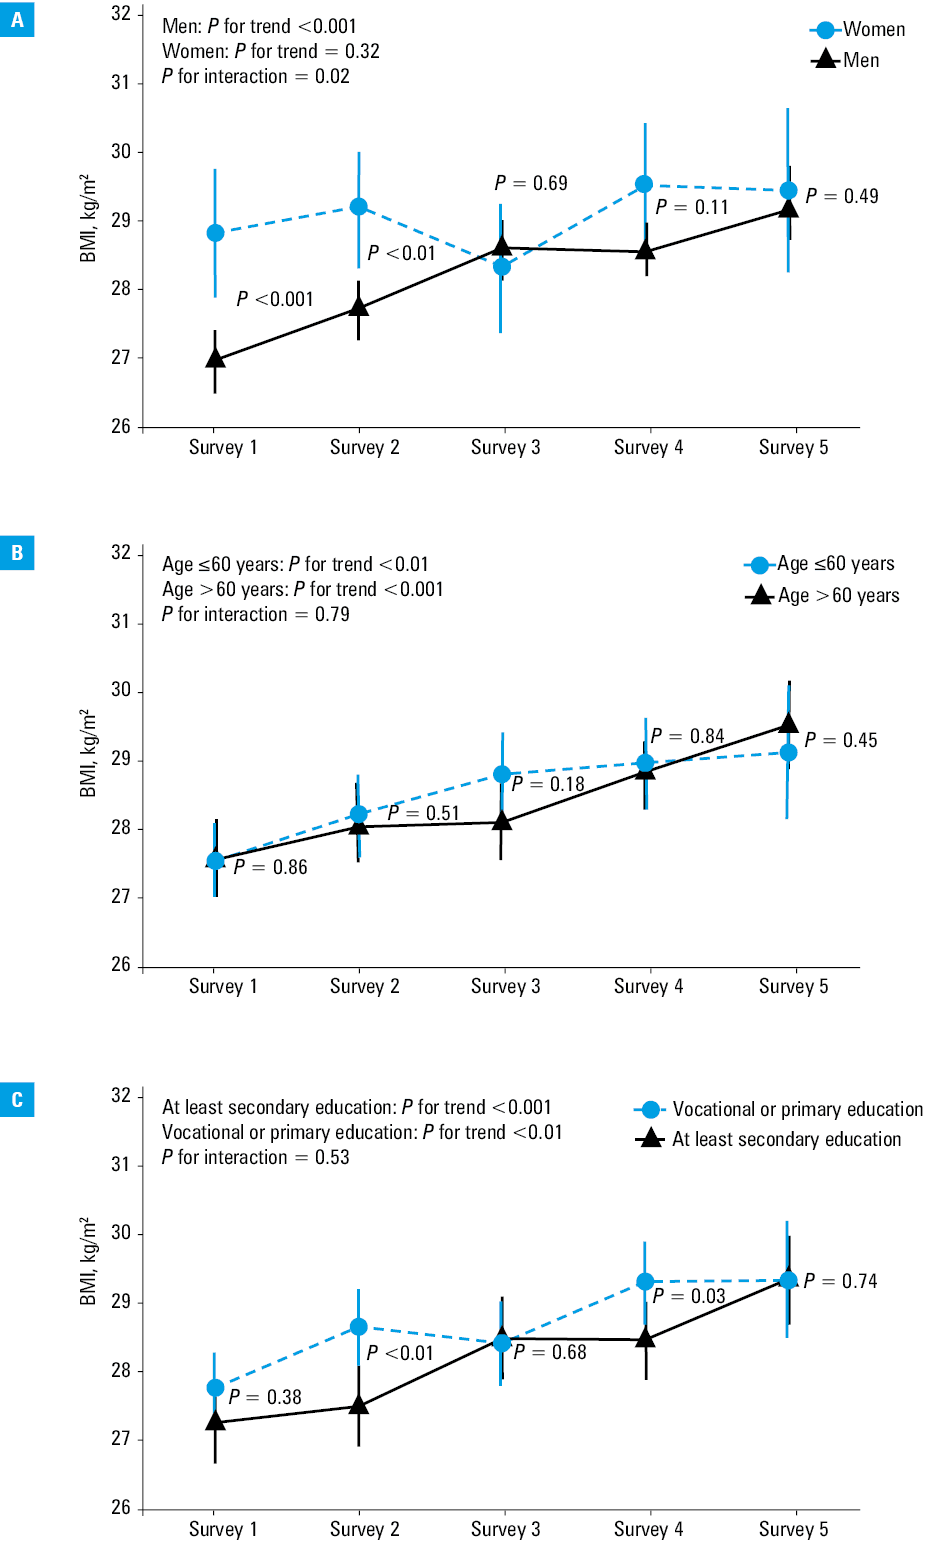
During the observation period, the mean blood pressure and cholesterol levels decreased and glucose levels increased (Table 1). The mean BMI gradually increased in men, but not in women (Table 2). The proportions of patients who were overweight or obese increased significantly from 75.3% in survey 1 to 85.5% in survey 5 over 20 years. However, this trend was only observed in men (Table 2). The proportion of patients with central overweight increased significantly from 60% in survey 1 to 87.1% in survey 5 with similar trends noted in both men and women. The least squares means of BMI and waist circumference according to survey, sex, age, and education are presented in Figures 1 and 2. In men, BMI increased gradually between surveys 1 and 5 (Figure 1A). This trend was not significant in women. Similarly, a gradual increase in the proportion of obese men but not women was observed (Supplementary material, Figure S1). The least squares means of waist circumference increased in both sexes along with the proportions of patients with an increased waist circumference (Figure 2A; Supplementary material, Figure S2). A gradual increase in BMI and waist circumference could be seen in younger and older patients as well as in those with both lower and higher levels of education (Figure 1B and 1C and Figure 2B and 2C). An independent increase of likelihood of being obese was observed (Table 3). Similarly, we showed a gradual increase of probability of having central obesity (Table 3).
Variable | Survey 1 (n = 412) | Survey 2 (n = 427) | Survey 3 (n = 422) | Survey 4 (n = 462) | Survey 5 (n = 272) | P value for trend | |
Body mass index, kg/m2, mean (SD) | Men | 27.0 (3.5) | 27.7 (3.4) | 28.6 (4.1) | 28.6 (4) | 29.1 (4.1) | <0.001 |
Women | 28.9 (4) | 29.2 (5.2) | 28.4 (4.9) | 29.6 (5) | 29.5 (5.1) | 0.38 | |
Body mass index, all participants, n (%) | <25 kg/m2 | 102 (24.8) | 92 (21.6) | 87 (20.6) | 78 (16.9) | 39 (14.3) | <0.001 |
25–30 kg/m2 | 209 (50.7) | 219 (51.3) | 192 (45.5) | 220 (47.6) | 123 (45.2) | ||
≥30 kg/m2 | 101 (24.5) | 116 (27.2) | 143 (33.9) | 164 (35.5) | 110 (40.4) | ||
Body mass index, men, n (%) | <25 kg/m2 | 85 (28.1) | 65 (21.8) | 54 (18.1) | 50 (16) | 29 (14.3) | <0.001 |
25–30 kg/m2 | 162 (53.5) | 163 (54.7) | 146 (48.8) | 162 (51.9) | 96 (47.3) | ||
≥30 kg/m2 | 56 (18.5) | 70 (23.5) | 99 (33.1) | 100 (32.1) | 78 (38.4) | ||
Body mass index, women, n (%) | <25 kg/m2 | 17 (15.6) | 27 (20.9) | 33 (26.8) | 28 (18.7) | 10 (14.5) | 0.41 |
25–30 kg/m2 | 47 (43.1) | 56 (43.4) | 46 (37.4) | 58 (36.7) | 27 (39.1) | ||
≥30 kg/m2 | 45 (41.3) | 46 (35.7) | 44 (35.8) | 64 (42.7) | 32 (46.4) | ||
Waist circumference, cm, mean (SD) | Men | 95.2 (9.4) | 97.3 (9.4) | 100.6 (10.6) | 99.4 (10.3) | 102.9 (10.8) | <0.001 |
Women | 89.2 (11) | 91.7 (11.9) | 91.7 (12.3) | 94.8 (13) | 98.0 (11.3) | <0.001 | |
Waist circumference, all participants, n (%) | <94 cm in men or <80 cm in women | 165 (40) | 118 (27.6) | 101 (23.9) | 111 (24) | 35 (12.9) | <0.001 |
94–102 cm in men or 80–88 cm in women | 113 (27.4) | 136 (31.8) | 105 (24.9) | 129 (27.9) | 70 (25.7) | ||
≥102 cm in men or ≥88 cm in women | 134 (32.5) | 173 (40.5) | 216 (51.2) | 222 (48.1) | 167 (61.3) | ||
Waist circumference, men, n (%) | <94 cm | 138 (45.5) | 95 (31.9) | 76 (25.4) | 86 (27.6) | 32 (15.8) | <0.001 |
94–102 cm | 90 (29.7) | 111 (37.3) | 82 (27.4) | 104 (33.3) | 64 (31.5) | ||
≥102 cm | 75 (24.8) | 92 (30.9) | 141 (47.2) | 122 (39.1) | 107 (52.7) | ||
Waist circumference, women, n (%) | <80 cm | 27 (24.8) | 23 (17.8) | 25 (20.3) | 25 (16.7) | 3 (4.4) | <0.003 |
80–88 cm | 23 (21.1) | 25 (19.4) | 23 (18.7) | 25 (16.7) | 6 (8.7) | ||
≥88 cm | 59 (54.1) | 81 (62.8) | 75 (61) | 100 (66.7) | 60 (87) | ||
Abbreviations: BMI, body mass index
Abbreviations: BMI, body mass index
Survey | Odds ratio (95% CI) | |
Body mass index ≥30 kg/m2 | Waist ≥102 cm in men or ≥88 cm in women | |
a Multivariable model includes age, sex, education, employment, index event, and hospitalization | ||
Survey 1 | 1 | 1 |
Survey 2 | 1.15 (0.84–1.58) | 1.46 (1.08–1.98) |
Survey 3 | 1.52 (1.1–2.1) | 2.18 (1.61–2.96) |
Survey 4 | 1.68 (1.21–2.32) | 1.95 (1.42–2.67) |
Survey 5 | 2.01 (1.35–2.99) | 3.79 (2.52–5.71) |
P value for trenda | <0.001 | <0.001 |
Discussion
There is high‑quality evidence supporting the claim that the long‑term survival of coronary patients may be improved by providing optimal cardiovascular prevention.8 Indeed, according to the recently published results of the EUROASPIRE V (European Action on Secondary Prevention through Intervention to Reduce Events) survey, there is a considerable potential for further improvement in cardiovascular risk in patients with CAD.3 Our results indicate a gradual increase in BMI and waist circumference in patients with established coronary artery disease within a period of 2 decades. This trend, especially if it persists in the future, may contradict the benefits associated with an increase in cardioprotective drugs uptake. Although we could not compare data on lifestyle of the participants of all surveys, our results may suggest an unfavorable trend in lifestyle habits of patients with established CAD, including both diet and physical activity. The present results should be seen as a call for higher uptake of comprehensive cardiac rehabilitation programs as well as for improvement in their efficacy.14-16 Our results may also mirror an increase in the mean BMI of the general population of Poland.17
Numerous studies have been published assessing the quality of medical care in the field of prevention and treatment of CAD, including the control of overweight and obesity.3,5,18-21 The analysis of these data suggests an increase in the prevalence of obesity, including central obesity, in most European countries. To the best of our knowledge, the present study is the first to present data allowing an estimation of the operational efficacy of the same hospitals with regard to the prevention of CAD events over 20 years. This provides an unique opportunity to track changes in the obesity rates of patients with CAD living in a specific area over a long period of time and who were treated in the same hospitals.
The increasing proportion of obese patients may be responsible for the increase in hypertension, dyslipidemia, and diabetes prevalence as well as for insufficient improvement in the control of these risk factors despite an increase in the drug prescription rates in patients with coronary artery disease.4,13,22 The present results urge to improve cardiovascular prevention in patients with coronary artery disease. Indeed, recently, education provided by a multidisciplinary team was shown to decrease mortality among high‑risk patients.23
We were unable to show an increase in the mean BMI in women over the study period. This might be due to a relatively lower number of female participants in the study compared with male participants. It is possible that the inclusion of a much higher number of women would have also revealed a significant trend in women. On the other hand, it might suggest lowered muscle weight in women with stabilized CAD and could be related with greater insulin resistance and subsequently with an increased risk of recurrent cardiovascular events. Indeed, a lower proportion of women maintained an adequate level of physically activity following an CAD event compared with men.24
The current European Society of Cardiology guidelines recommend BMI as a sufficient measure of obesity in clinical practice.8 However, some experts insist waist circumference may have some advantages.8 Nevertheless, we demonstrated a gradual increase in both BMI and waist circumference over 20 years.
Limitations of the study
Our analysis has some limitations. Firstly, we could not accurately assess the influence of changes in mean BMI and waist circumference on the risk of cardiovascular complications. Secondly, participants were limited to those who had experienced acute CAD event or underwent a revascularization procedure. Therefore, our results should not be directly applied to other CAD patients. Thirdly, survey participants lived in a defined geographical area. Although the applicability of our results to other regions is uncertain, the trends described agree with changes over time in the general population in Poland as well as in patients with CAD from other European countries.5,17Conclusions
The analysis of 5 multicenter surveys provides evidence of a gradual increase in BMI and waist circumference in patients with established CAD over a period of 3 decades. The increase in BMI was steeper in men compared with women. The trend is independent of age and the educational level of patients.
- Wilkins E, Wilson L, Wickramasinghe K, et al. European Cardiovascular Disease Statistics 2017. Brussels: European Heart Network; 2017.
- Szummer K, Lindhagen L, Evans M et al. Treatments and mortality trends in cases with and without dialysis who have an acute myocardial infarction: an 18‑year nationwide experience. Circ Cardiovasc Qual Outcomes. 2019; 12: e005879. | Crossref
- Kotseva K, De Backer G, De Bacquer D, et al. Lifestyle and impact on cardiovascular risk factor control in coronary patients across 27 countries: results from the European Society of Cardiology ESC‑EORP EUROASPIRE V registry. Eur J Prev Cardiol. 2019; 26: 824‑835. | Crossref
- Jankowski P, Czarnecka D, Badacz L, et al. Practice setting and secondary prevention of coronary artery disease. Arch Med Sci. 2018; 14: 979‑987. | Crossref
- Kotseva K, De Bacquer D, Jennings C, et al. Time trends in lifestyle, risk factor control, and use of evidence‑based medications in patients with coronary heart disease in Europe: results from 3 EUROASPIRE Surveys, 1999‑2013. Glob Heart. 2017; 12: 315‑322. | Crossref
SUPPLEMENTARY MATERIAL
ARTICLE INFORMATION