Risk assessment of chronic obstructive pulmonary disease using a Bayesian network based on a provincial survey
Key words: Bayesian networks, chronic obstructive pulmonary disease, risk assessment, screening


 CC BY-NC-SA 4.0
Risk assessment of chronic obstructive pulmonary disease using a Bayesian network based on a provincial survey
Introduction: The diagnosis of chronic obstructive pulmonary disease (COPD) is based on spirometry tests, which are difficult to perform in some populations.
Objectives: We aimed to construct a risk assessment model using a Bayesian network (BN) that would enable screening of high‑risk populations.
Patients and methods: A provincial survey of COPD was performed via face‑to‑face interviews and spirometry tests among a population aged 40 years and above in Liaoning Province, northeastern China. The potential risk factors were initially identified by multivariable logistic regression, and then a BN was built. To verify its performance, cross‑validation and external dataset validation were performed, and the area under the curve (AUC) and accuracy of the BN were calculated.
Results: The estimated age‑adjusted prevalence of COPD in the entire population was 21.23% (95% CI, 18.35–24.11). Logistic regression revealed that low education level (odds ratio [OR], 2.35; P <0.001), elderly age (OR, 4.19; P <0.001), ever smoking (OR, 1.49; P = 0.03), and lower level of satisfaction with air quality (OR, 1.55; P = 0.03) were associated with COPD. In the BN, frequent cough was the strongest single risk factor for COPD development (risk, 0.374). The risk increased as more factors were specified, and the highest risk (0.738) was noted for the combination of older age, smoking, wheezing during sickness, and frequent cough. The cross‑validation indicated that BN performed better than logistic regression, with a mean AUC of 0.85 and an optimum accuracy of 0.87 (cutoff, 0.473).
Conclusions: The BN based on questionnaires had a more accurate performance in predicting the risk for COPD. The increased risk associated with exposure to a combination of several risk factors should be noted.
What's new?
The paper presents the results of a provincial study investigating the prevalence of and risk factors for chronic obstructive pulmonary disease (COPD) in Liaoning Province, China. In addition to the previously identified risk factors, we found that lower level of satisfaction with air quality was also a potential risk factor for COPD. We built a Bayesian network to assess the risk for COPD in individual participants based on questionnaires. The model had a good performance with a mean area under the curve of 0.85 and an optimum accuracy of 0.87 (cutoff, 0.473). From this model, we also found that the risk associated with a combination of several risk factors was considerably higher than the risk associated with any single risk factor; therefore, populations in which multiple risk factors occur simultaneously deserve more attention in COPD prevention.
Introduction
Chronic obstructive pulmonary disease (COPD) is one of the most common causes of respiratory disease around the world: there were 251 million cases of COPD globally in 2016. It also accounted for more than 5% of all causes of mortality in the year before.1 Most deaths occurred in developing countries, and the prevalence differed among various regions.2 For example, Muñozes et al3 reported a range of COPD prevalence, with the lowest prevalence in Mexico City (7.8%) and the highest in Montevideo, Uruguay (19.7%). Similarly, according to some studies, COPD prevalence varies among different regions in China, ranging from 2% to 21%, and is generally higher in the west than in the east of the country.4-7 These variations across geographic areas are attributed partly to the differences in the level of risk exposure (such as the rate of tobacco use) and age structure as well as disparities in socioeconomic development, including income level and access to healthcare.2 However, it is critical for the management of COPD to identify risk factors associated with it. Numerous studies of COPD prevalence have shown that male sex, older age, low education level, and tobacco use are associated with the development of COPD,7-12 but the identified risk factors varied depending on the region of the study. Therefore, a regional survey of COPD as well as the risk factors associated with it is still needed.
Many nations spend a considerable amount of money on COPD management.13-17 Early diagnosis is one of the best ways to help save costs, but the time‑consuming pre- and post‑bronchodilator spirometry, the results of which are the main basis for the diagnosis of COPD, cannot be performed in all populations, especially in middle- and low‑income states. Still, screening individuals at high risk for COPD using spirometry tests is necessary. In previous studies, multivariable logistic regression models were frequently used to identify the risk factors for COPD, but they are not often used in risk assessments or predictions. The stability of logistic regression models is largely affected by the potential collinearity among the included variables, and the predictions of continuous variables are not available.18,19 Fortunately, machine learning strategies offer an alternative approach. As a powerful and increasingly popular tool for the diagnosis and risk assessment in biomedical fields, Bayesian networks (BNs) can infer the probability of unknown nodes via the status of known nodes, and they can handle situations of uncertainties.20-23 Several studies have indicated the superiority of BNs in terms of prediction compared with logistic regression.24-27
This study aimed to explore a risk assessment model for COPD based on a provincial cross‑sectional survey. We hypothesized that through a BN, we would be able to assess the risk for COPD of individual participants and then predict their disease status. If this model performed well, it would provide strong evidence for the allocation of spirometry and allow for early diagnosis and treatment, which would significantly improve the cost‑effectiveness of COPD management.
Patients and methods
Epidemiological survey
We conducted a cross‑sectional study in Liaoning Province, northeastern China. It was launched by the National Health Commission of China and consisted of face‑to‑face questionnaire interviews and standardized spirometry tests. According to a multi‑stage sampling strategy, 4 representative counties / districts of 4 different cities in Liaoning Province were selected by population proportion, geographical location, and economic development. Within each selected county / district, 2 adjacent communities or 2 administrative villages were randomly chosen, and at least 100 households of villagers were randomly selected from each community or administrative village. In the next step, a single family member who was 40 years old or above was chosen randomly from each household using a Kish selection Table. We attempted to pay an in‑person visit to each potential participant. Those who could not be reached after 3 contact attempts were considered ineligible and were subsequently replaced with another candidate form a household of similar characteristics from the same village.
We constructed a comprehensive questionnaire to collect information during the interviews, including demographic characteristics, medical history, smoking status, and exposure to indoor pollution and occupational hazards. All staff were trained to conduct the interviews before the start of the survey. Individuals who had resided in the selected regions for at least 6 months and were aged 40 years or above were considered eligible for the investigation. The exclusion criteria comprised living in a communal residence, cognitive, language, or mental disorders (in consideration of the interview), cancer (both newly diagnosed and under treatment), paraplegia, pregnancy, breastfeeding, and the lack of consent for participation. The survey was approved by the Ethics Review Committee of the National Center for Chronic and Noncommunicable Disease Control and Prevention of the Chinese Center for Disease Control and Prevention. All included participants provided written informed consent.
Spirometry
The spirometry assessments were performed by operators from local clinics in the participants’ residential areas, who had underwent a specific training course before conducting the tests. A diagnosis of COPD was made according to the Global Initiative for Chronic Obstructive Lung Disease (GOLD) lung function criteria (forced expiratory volume in 1 second [FEV1] and / or forced vital capacity [FVC] <0.7).28 All included participants underwent spirometry tests with the same brand of spirometer (MasterScreen Pneumo, Jaeger, Germany) operated by trained staff, following standard guidelines of the American Thoracic Society.28,29 First, all eligible participants underwent pre‑bronchodilator spirometry. Then, post‑bronchodilator spirometry was performed 15 minutes after inhalation of 400 µg salbutamol (Ventolin; GlaxoSmithKline, Middlesex, United Kingdom). The participants who were allergic to salbutamol or those who had a resting heart rate of more than 100 bpm were excluded from the post‑bronchodilator testing. We recorded the FEV1 and FVC during spirometry and assessed the severity of COPD with the GOLD 2017 ABCD assessment tool in each participant. Then, we assessed their respiratory symptoms using the modified Medical Research Council dyspnea score. To exclude participants with other recent cardiopulmonary diseases, we also offered additional chest radiography to individuals whose post‑bronchodilator FEV1/FVC was less than 70%. Using a quality grade (A to F) based on the acceptable maneuvers and the repeatability of FEV1 and FVC, the quality of each participant’s spirometry result was assessed within 24 hours. Grades A, B, and C were considered acceptable, and the participants who received others grades were excluded.
Statistical analysis and Bayesian networks
Data were collected and checked by the Liaoning Center for Disease Control and Prevention. We calculated standardized COPD prevalence using sampling weights and age distribution of the individuals aged 40 years or above. Then, multivariable logistic regression was performed using the final dataset to identify the potential risks as well as to select potential variables that would form the BN model. Since there were too many variables derived from the questionnaire, only the critical variables were entered in the logistic regression and the BN prediction models. Therefore, a feature selection was done before the logistic regression. During this procedure, the variables that contained similar or duplicated information were excluded, except for the one that contained the most information. Then, we excluded the variables that were seldom reported to be correlated with COPD as well as those with too many null values (>50%). The indicators from spirometry, such as FEV1, were not included in the BN because they were variables for the diagnosis of COPD. To make the logistic regression more comparable to the BN, we transformed continuous variables into categorical ones. Variables with generally acknowledged standards (such as body mass index [BMI] or hypertension) were categorized according to these standards and others (such as income) were categorized into 3 groups (high, medium, and low). The remaining variables were included in the logistic regression. All tests were 2‑sided, and a P value of less than 0.05 was considered significant.
Bayesian network, also known as Bayesian belief network, is a directed acyclic graph that represents nodes (variables) and their conditional probabilities. In this study, we used the BN to construct a risk assessment model for COPD. The variables of our BN were based on the features identified in logistic regression and were supplemented by the current evidence.
The learning of the BN includes structure learning and parameter learning.30 For the former, the hill‑climbing (HC) algorithm was adopted. As to the a priori knowledge of the basic structure, the established causal relationships between some variables were acknowledged. For example, older age, occupational exposure to dust, and ever smoking have been reported to be associated with a higher risk of COPD. These causal relationships were defined as the “whitelist.” On the other hand, some seemingly impossible relationships between the variables were also known. For instance, none of the factors can affect age or sex, and these implausible relationships were defined as the “blacklist.” Using the bnlearn package of the R statistics software, we achieved the HC learning based on setting the whitelist and blacklist.31 To exert the flexibility of the BN in dealing with uncertainties, we tried to limit the a priori knowledge to a minimum. For the parameter learning, we chose the Bayes’ method rather than the maximum likelihood estimation method because the estimated parameters of the former are smoother, making the inference both easier and more robust.30
We converted continuous variables into categorical ones to better fit the BN. Some continuous variables were divided into 3 groups according to tertiles and for others specific cutpoints were used. For example, the variable “age” was divided into 3 groups: young age (individuals aged <50 years), middle age (individuals aged 50–59 years), and older age (individuals aged >59 years). Hypertension was defined as systolic blood pressure higher than 140 mm Hg or diastolic blood pressure higher than 90 mm Hg. The level of education was established based on the number of years of education completed (>9, 6–9, and <6 years, respectively, for high, middle, and low education level).
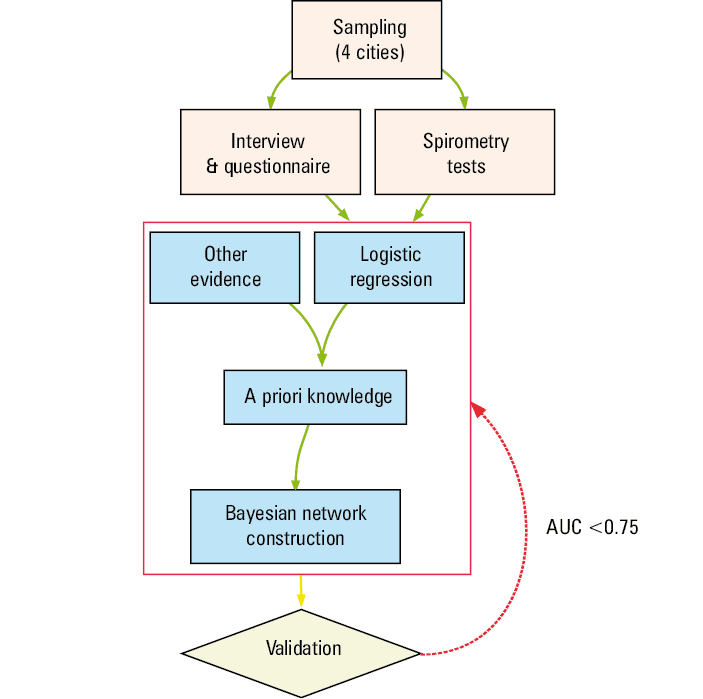
In this study, the conditional probabilities of COPD under specific circumstances were adopted as indicators of risk. Of note, these conditional probabilities were generated using Monte Carlo particle filters, so each run of the prediction may yield slightly different values. First, we divided the dataset into a training‑set (containing 90% of the observations) and a test‑set (containing 10% of the observations) using random sampling. The BN was constructed based on the training set. To make the prediction more robust, we ran each prediction 100 times and used the median as the final prediction. Then, we calculated the conditional probabilities under all the circumstances that specified 1, 2, 3, and 4 risk factors, and we subsequently selected the top 20 circumstances with the highest risk for each group. The BN was validated using both internal and external methods. For internal validation, we carried out a 5‑fold cross‑validation of both the BN and logistic regression models, during which we depicted the receiver operating characteristic (ROC) curves and calculated the areas under the curves (AUCs) and accuracy. External validation of the BN was performed using the test‑set. We considered an acceptable AUC of 0.75, and BNs with lower AUC were reconstructed until they met the threshold. The research process of this study is shown in Figure 1.
All statistical analyses and BN‑related procedures were completed with R statistics, version 3.6.2, from the Comprehensive R Archive Network (Vienna, Austria; http://cran.r‑project.org/).
Results
Demographic characteristics
Between December 2014 and December 2015, a total of 2400 participants from 4 counties / districts of 4 cities (Xinmin County of Shenyang City, Mingshan District of Benxi City, Donggang County of Dandong City, and Haizhou District of Fuxin City) were selected. Among these, 2397 (99.88%) were qualified and interviewed, while the remaining 3 (0.02%) were excluded for failing to meet the interviewing criteria. Of all the interviewed respondents, 167 individuals were ineligible for spirometry, and the other 2230 completed the test, which included pre- and post‑bronchodilator examinations. Overall, a total of 2194 participants completed the whole procedure and were included in the final analyses. Details are shown in Supplementary material, Figure S1.
Figures S2 and S3 in Supplementary material show the demographic characteristics of the included participants, among whom 1205 (54.9%) were women and 989 (45.1%) were men. Approximately half of the participants (1107 [50.5%]) were from rural areas and the other half (1087 [49.5%]) were living in urban areas. The proportion of participants with a higher level of education (>9 years of education completed) was 27.1% (n = 594). The numbers of participants who were ever exposed to occupational hazardous gas and dust were 692 (31.5%) and 778 (35.5%), respectively. Two‑thirds of the participants (1461 [66%]) had hypertension, and 823 (37.5%) were smokers, of which 689 (83.72%) were men and only 134 (16.28%) were women. The overweight and obesity rates among the participants were 2.3% and 26.8%, respectively. According to spirometry and further chest radiography examination, the age‑adjusted prevalence of COPD in adults aged 40 years and above was 21.23% (95% CI, 18.35–24.11), and it was significantly higher in men (23.89%; 95% CI, 16.72–31.05) than in women (18.88%; 95% CI, 16.66–21.11).
Multivariable logistic regression
A total of 101 variables from the questionnaire were included in the primary selection. After further examination of the relationships with COPD, comparison of similar variables, and exclusion of those with too many null values, 37 variables were selected. The observations with null values were also excluded. Finally, 1656 observations were entered in the multivariable logistic regression. It revealed that female sex (odds ratio [OR], 0.66; P = 0.02) was a protective factor for COPD, while other factors such as low and middle education levels (OR, 2.35; P <0.001 and OR, 1.74; P = 0.004, respectively), diagnosed coronary heart disease (CHD) (OR, 1.72; P = 0.03), parental history of emphysema (OR, 2.59; P <0.001), ever smoking (OR, 1.49; P = 0.03), older age (OR, 4.19; P <0.001), middle age (OR, 2.09; P <0.001), and middle level of income (OR, 1.45; P = 0.02) were identified as risk factors for COPD. Interestingly, we also found that the less satisfied participants were with current air quality, the higher the risk for COPD (OR, 1.72; P = 0.03). Contrary to many previous studies, environmental exposure to tobacco smoke during childhood was found to be negatively associated with COPD. It was difficult to explain based on this dataset, but we found the proportion of pulmonary heart disease in the nonexposure group higher than in the exposure group (1.91% vs 0.88%). Additionally, the COPD prevalence (unadjusted) was also higher in the nonexposure group (18.53% vs 16.47%). Detailed results of the logistic regression are presented in Table 1.
Variable | β coefficient | OR | 95% CI | P value |
a Income levels: low income level, <20 000 Chinese yuan (CNY); middle income level, 20 000–48 000 CNY; high income level (reference), >48 000 CNY
b Age groups: young age (reference), aged <50 years; middle age, aged 50–59 years; older age, aged >59 years
Abbreviations: CHD, coronary heart disease | ||||
Cooker hood (vs chimney) | 0.484 | 1.62 | 1.16–2.28 | 0.005 |
Ventilator (vs chimney) | 0.013 | 1.01 | 0.72–1.43 | 0.94 |
Female sex (vs male sex) | –0.417 | 0.66 | 0.47–0.93 | 0.02 |
Low education level (vs high education level) | 0.855 | 2.35 | 1.54–3.6 | <0.001 |
Middle education level (vs high education level) | 0.556 | 1.74 | 1.19–2.55 | 0.004 |
Low level of income (vs high level of income)a | –0.149 | 0.86 | 0.56–1.32 | 0.5 |
Middle level of income (vs high level of income)a | 0.374 | 1.45 | 1.05–2.01 | 0.02 |
CHD unknown (vs no CHD) | 0.109 | 1.12 | 0.52–2.41 | 0.78 |
CHD (vs no CHD) | 0.543 | 1.72 | 1.07–2.78 | 0.03 |
Parental emphysema unknown (vs no parental emphysema) | –0.343 | 0.71 | 0.32–1.59 | 0.41 |
Parental emphysema (vs no parental emphysema) | 0.95 | 2.59 | 1.63–4.11 | <0.001 |
Wheezing sound during sickness unknown (vs no wheezing sound during sickness) | –0.822 | 0.44 | 0.05–4.16 | 0.47 |
Wheezing sound during sickness (vs no wheezing sound during sickness) | 0.715 | 2.04 | 1.45–2.88 | <0.001 |
Frequent cough (vs no frequent cough) | 0.776 | 2.17 | 1.3–3.63 | 0.003 |
Environmental exposure to tobacco in childhood unknown (vs no environmental exposure to tobacco in childhood) | 0.993 | 2.7 | 0.58–12.65 | 0.21 |
Environmental exposure to tobacco in childhood (vs no environmental exposure to tobacco in childhood) | –0.364 | 0.7 | 0.52–0.93 | 0.01 |
Ever smoking (vs never smoking) | 0.4 | 1.49 | 1.05–2.12 | 0.03 |
Older age group (vs younger age group)b | 1.432 | 4.19 | 2.79–6.29 | <0.001 |
Middle age group (vs younger age group)b | 0.738 | 2.09 | 1.37–3.2 | <0.001 |
Lower level of air satisfaction (vs higher level of air satisfaction) | 0.44 | 1.55 | 1.05–2.29 | 0.03 |
Middle level of air satisfaction (vs higher level of air satisfaction) | –0.074 | 0.93 | 0.63–1.36 | 0.7 |
Tachycardia (vs no tachycardia) | –0.925 | 0.4 | 0.12–1.26 | 0.12 |
Bayesian network
All significant risk or protective factors were entered in the BN. Additionally, the variables that were frequently reported to be associated with COPD, such as BMI,8,32,33 occupational exposure to dust or hazardous gas, exposure to coal or biomass fuel, and living in a rural residence,10,34,35 were also considered. Finally, a total of 17 factors (including COPD) were selected. In the next step of incorporating a priori knowledge, age, smoking status, BMI, and sex were all set to be associated with COPD (the whitelist). For the blacklist, age, sex, and parental emphysema were not influenced by most of the other variables. The a priori knowledge encompassing the whitelist and the blacklist is shown in Supplementary material, Tables S1 and S2.
The structure of the BN is shown in Figure 2. Apart from the associations based on the a priori knowledge that we set, no other parent or child associations with COPD were found. However, some relationships between other nodes were found by structure learning. For example, sex affected ever smoking, and ever smoking also led to frequent cough; education level was the parent of income level and residence area. The residence area also affected occupational exposure to hazardous gas or dust, which might be attributed to regional characteristics, and CHD was affected by age. Most of the structure learning–based relationships agreed with the current evidence, implying the plausible validity of this BN.
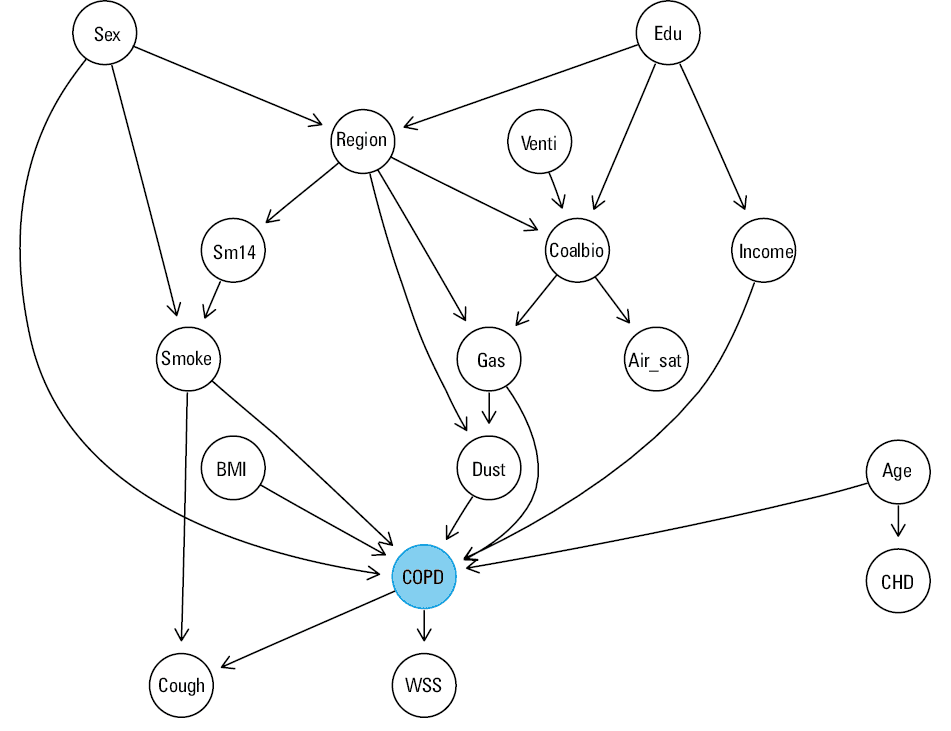
Abbreviations: Age, age group; Air_sat, level of satisfaction with air quality; BMI, body mass index; CHD, coronary heart disease; Coalbio, exposure to coal or biomass fuel when cooking; Cough, frequent coughing; Dust, occupational exposure to dust; Edu, education level; Gas, occupational exposure to hazardous gas; Income, income level; Smoke, ever smoking; Sm14, environmental exposure to tobacco before 14 years old; Region, residence area; Venti, ventilation of the kitchen; WSS, wheezing sound during sickness
Partial results of the parameter learning are shown in Figure 3, which represents the top 20 high‑risk circumstances when specifying 1, 2, 3, and 4 risk factors (Figure 3A–3D). In the circumstances specifying a single risk factor, the highest risk was noted for frequent cough; specifically, the risk of an individual with frequent cough (in the population aged ≥40 years, which matches our sampling population) for developing COPD was 0.374. Wheezing during sickness (risk, 0.326) and older age (risk, 0.293) ranked second and third, respectively. The risk kept increasing when more factors were specified. When 2 factors were specified, the highest risk increased to 0.553, which corresponded to the combination of wheezing during sickness and frequent cough. The combination of older age and frequent cough was associated with a risk of 0.511, and the combination of older age and wheezing during sickness with a risk of 0.453. The highest risk when specifying 3 factors (0.681) was noted for the combination of older age, wheezing during sickness, and frequent cough, and the highest risk when specifying 4 factors (0.738) was observed for the combination of older age, ever smoking, wheezing during sickness, and frequent cough.
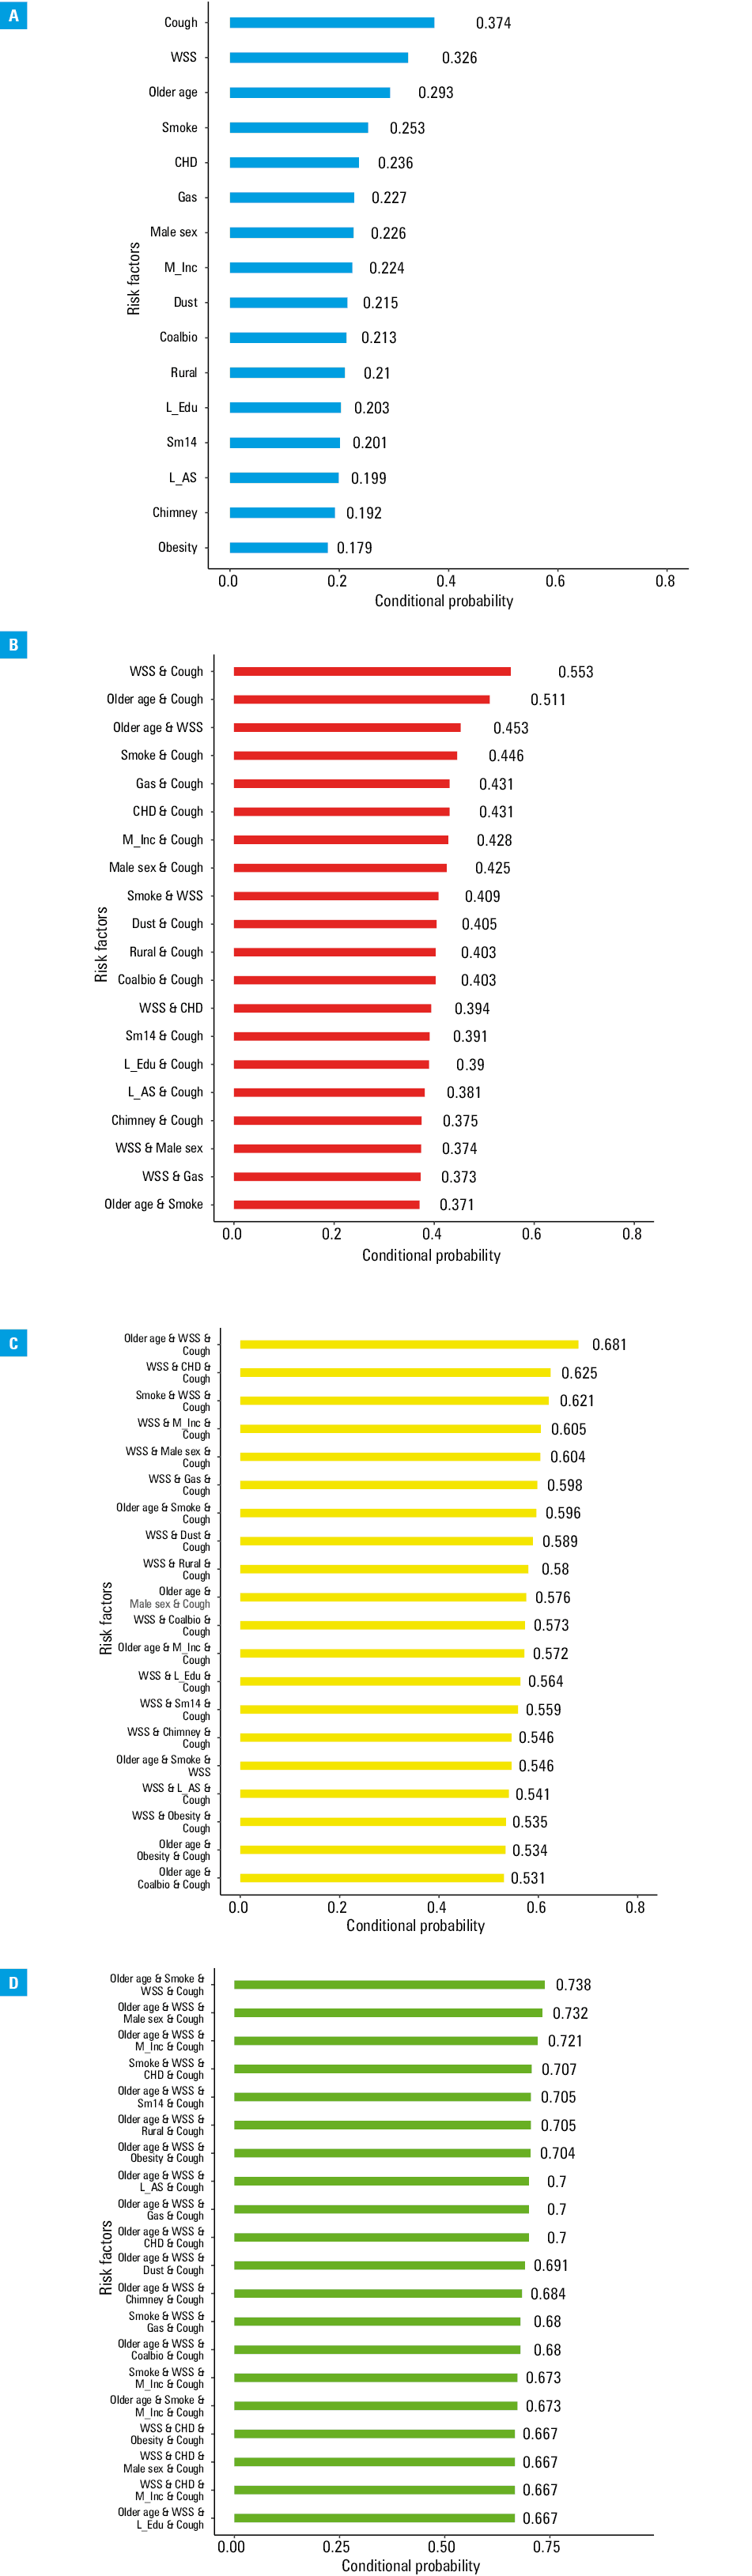
Abbreviations: Chimney, using a chimney as ventilation in the kitchen; L_AS, lower level of air quality satisfaction; L_edu, lower education level; M_inc, middle income level; Rural, rural residency; others, see Figure 2
We found that risk factors such as older age, frequent cough, ever smoking, and wheezing during sickness were associated with the higest risk in the model specifying single factors. However, when more risk factors were specified, middle income level, lower level of education, and obesity tended to play more important roles. For example, the risk for COPD associated with middle income level was only 0.224, but the risk associated with the combination of wheezing during sickness, frequent cough, and middle income level increased to 0.605, which ranked eighth in Figure 3C, and the risk associated with the combination of elderly age, frequent cough, wheezing during sickness, and middle income level was 0.721, which ranked seventh in Figure 3D.
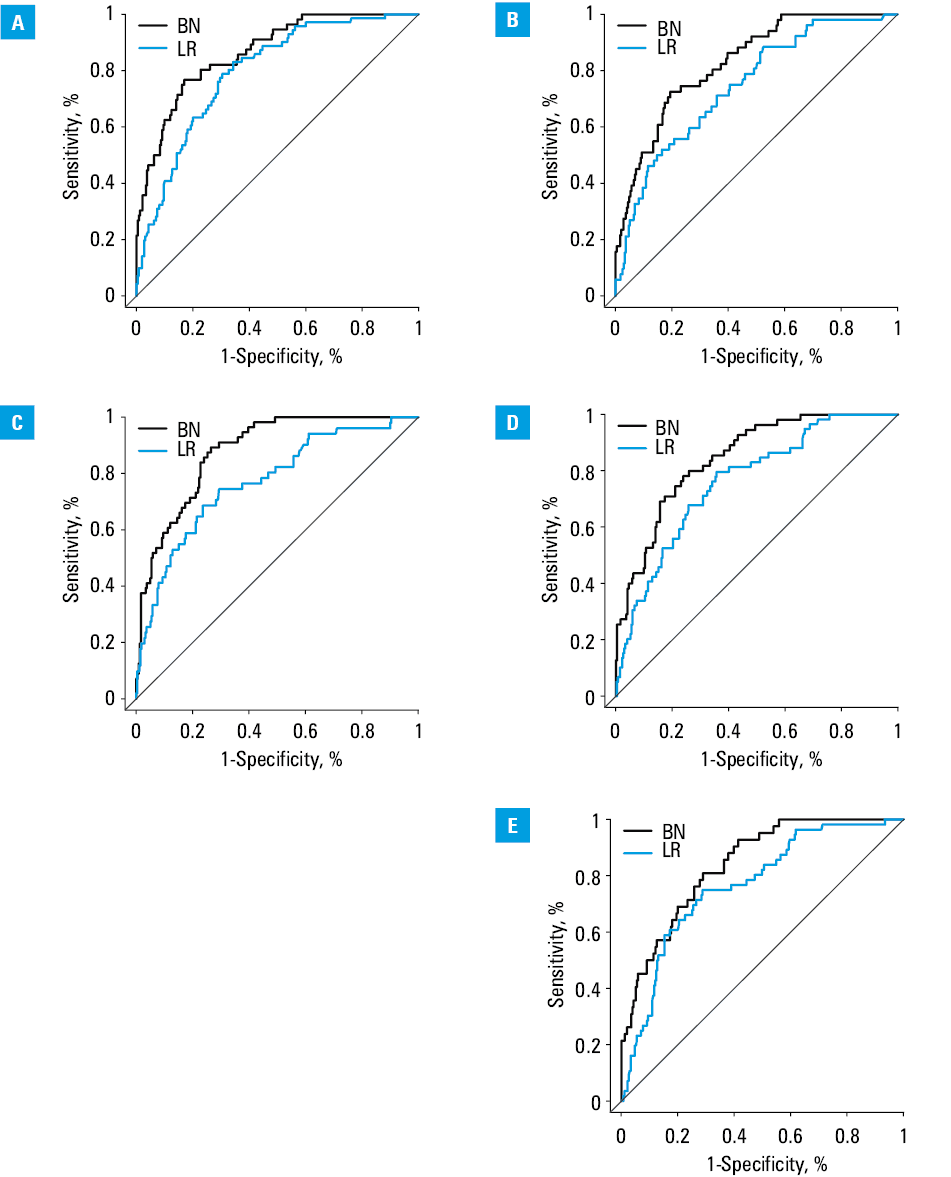
In cross‑validation, the mean AUC of the BN was 0.85, with a mean accuracy of 0.87 (cutoff, 0.473). The mean AUC and accuracy of the logistic regression were 0.77 and 0.84, respectively. In external validation (shown in Supplementary material, Figure S4), the AUC and accuracy were 0.82 and 0.86 (cutoff, 0.4), respectively. These results suggest that the BN performed better in predicting the risk of COPD than the logistic regression model. The ROC curves created during cross‑validation and external validation are presented in Figure 4 and Supplementary material, Table S3 and Figure S4, respectively.
Discussion
This study is the first official population‑based survey of COPD in northeastern China in a decade. We found that the age‑adjusted prevalence of COPD among people aged 40 years and above was 21.23%, which was considerably higher than the reported regional prevalence4,6 and nationwide prevalence (13.6%).8 It was also higher than the rates reported in most regional studies with similar designs around the world,3,9,36 except for Maastricht in the Netherlands (24%).36 The main reason for this may be the differences in risk exposure. For example, in the present study, the proportions of the population exposed to coal or biomass fuels and occupational dust were 38.7% and 36.5%, respectively; in most regions, however, the estimated proportions of exposure to the same risks ranged from 0.9% to 37.5% and 16.6% to 27.34%, respectively.3,37-40
In the logistic regression, not only did we identify age, sex, education level, and ever smoking as influencing factors of COPD, but we also recognized middle income level and lower levels of satisfaction with air quality as risk factors. Middle income level has seldom been reported as a risk for COPD; however, in this study, it was defined as an annual income of 20 000 to 48 000 CNY (approximately $2900–$6900), which was a relatively low level. Additionally, one of the main symptoms of COPD is shortness of breath, which would increase the vulnerability to poor quality of air. Therefore, the lower level of satisfaction with air quality may reflect the status of COPD. Interestingly, environmental exposure to tobacco during childhood was found to be a protective factor, and indoor use of gas with a cooker hood (compared with no hood) was a risk factor. The reason for this was difficult to explain, since the proportions of other risk factors in these 2 groups were higher than or equal to the proportions in the nonexposure group or no‑hood group, respectively. However, 2 recent studies carried out in China reported similar results. Li et al41 indicated the use of a hood as a risk factor in their study, which was conducted in the same provinces as our study. Another national study in China failed to found the association between living with smokers and COPD.42 Therefore, we suggest that these findings might not have been caused by bias; however, the reasons behind them need further exploration.
The conditional probabilities generated by the BN provide new perspectives for predicting COPD among community populations. Given that the diagnosis of COPD requires pre- and post‑bronchodilator spirometry, it would be of great benefit to find a simple way of screening the population that is at high risk. Previously, logistic regressions in healthcare‑related research mostly focused on identifying risk factors and providing evidence for disease preventions and treatments. In contrast to that approach, BNs calculate conditional probabilities (which we used as the indicators of risk for the disease) under a variety of situations. This is a more practical approach for personalized predictions since most populations would be exposed to several risk factors at the same time. We also found that the risk in individuals who were exposed to 4 risk factors was significantly higher than in those exposed to 1 or 2 factors. These findings imply that although some of the involved risk factors were not the main influencing factors (or indicators) of COPD risks, they may exert significant effects under some specific circumstances. Therefore, individuals exposed to a combination of risk factors deserve more attention.
As shown in Figure 4, the BN model performed better than logistic regression during cross‑validation, which was further confirmed in external validation. Moreover, BNs identify interactions between all the included nodes as well as the adjacent nodes of the targets. Therefore, if we could further confirm the risk factors for COPD and the level of risk associated with them, we would gain more insights into certain high‑risk behaviors through BNs, and more targeted measures could be taken to better prevent COPD.
As mentioned earlier, BNs can reflect relationships between all adjacent nodes, which also helps provide evidence for exploring further interactions between the target and each factor. All the reasonable relationships between the nodes mentioned in the “Results” section were identified by machine learning, which implies the strong causal inference of this COPD‑related BN prediction model. However, there were also some uncommon causal relationships; for example, residence area was impacted by sex and education level, and level of satisfaction with air was impacted by ventilation of the kitchen. Still, these interactions can be explained. First, more women were sampled in the urban areas, which could have resulted in the interactions between sex and residence area. Second, imbalances in development between rural and urban areas are larger in developing countries like China. Therefore, the more educated population tends to reside in urban areas for better jobs and public services, which could have led to the relationship between education level and residence area. Third, the education level can affect not only the residence area but also the perception of health, including the ventilation of the kitchen. The proportions of people with high, medium, and low education levels who only used chimneys without ventilation equipment were 30.8%, 34.3%, and 39.3%, respectively. Further, those who were exposed to coal or biomass fuel when cooking suffered from heavy indoor air pollution and this could have lead to a higher demand for ambient air.
Excellent prediction models for COPD are of considerable significance for public health. However, the diagnostic standard of COPD requires time‑consuming pre- and post‑bronchodilator spirometry, which is difficult to perform in the general population. Prediction models, such as the BN in this study, can help initially assess the risks of individuals based only on an interview or questionnaire and screen the high‑risk population for spirometry for further examination. This way, if we can identify most COPD patients in the early stages of the disease, timely interventions will significantly prevent them from disease progression. In addtion, other tools such as the COPD assessment test (CAT) questionnaires were also proved to be efficient in evaluating the COPD patients.43-46 Therefore, the combined applications of these prediction‑related tools should be recommended. With their help, the number of severe COPD cases could be decreased, which would also help save COPD‑related spending and improve cost‑efficiency. Therefore, such models would be particularly helpful in developing countries with large populations and limited healthcare resources.
The BN constructed in this study was validated to perform favorably in assessing and predicting COPD risks, which confirmed the contribution of this study. Nevertheless, some limitations must be noted. First, the data of our BN were from a cross‑sectional survey rather than a cohort study: cross‑sectional designs are limited in their ability to confirm risk factors for COPD. Second, all variables were collected from face‑to‑face interviews: recall bias could not be avoided despite our strict quality control. Third, the performance of our BN still needs to be improved, although the current AUC and accuracy are acceptable. One possible way to improve the BN is to include more critical variables, which is another limitation in this study. In the future, prediction models for COPD based on high‑quality cohort and case‑control studies are needed.
Conclusions
The prevalence of COPD in the population of Liaoning aged 40 years and above was 21.32%, which is higher than in most regions. Our BN model, which was constructed based on questionnaires, performed well in predicting the risk for COPD, and individuals exposed to a combination of risk factors deserve special attention.
- Chronic obstructive pulmonary disease (COPD). World Health Organization. https://www.who.int/news‑room/fact‑sheets/detail/chronic‑obstructive‑pulmonary‑disease-(copd). October 27, 2020.
- Mathers CD, Loncar D. Projections of global mortality and burden of disease from 2002 to 2030. PLoS Med. 2006; 3: e442. | Crossref
- Menezes AM, Perezpadilla R, Jardim JB, et al. Chronic obstructive pulmonary disease in five Latin American cities (the PLATINO study): a prevalence study. Lancet. 2005; 366: 1875‑1881. | Crossref
- Chan KY, Li X, Chen W, et al. Prevalence of chronic obstructive pulmonary disease (COPD) in China in 1990 and 2010. J Glob Health. 2017; 7: 020704‑020704.
- Kurmi O, Li L, Smith M, et al. Regional variations in the prevalence and misdiagnosis of air flow obstruction in China: baseline results from a prospective cohort of the China Kadoorie Biobank (CKB). BMJ Open Respir Res. 2014; 1: e000025. | Crossref
SUPPLEMENTARY MATERIAL
ARTICLE INFORMATION