Introduction
The majority of laboratories worldwide have reported considerable shortages in test kits, reagents, and qualified personnel required to perform the diagnostic testing for SARS‑CoV‑2 infection, which are likely to continue well into 2021.1 These shortages can lead to underestimations of the true epidemiological state of COVID‑19 and point to the need for alternative surveillance methods to anticipate outbreaks and the course of the pandemic.
Internet user data, termed infodemiology metrics,2 have been widely employed to track the epidemiological trajectory of past infectious outbreaks, such as that of influenza.3 The value of infodemiological data in Poland is promising, given that 66.7% of the Polish population use the internet for health‑related queries.4 Emerging evidence suggests that the volume of COVID‑19–specific Google searches using symptom keywords correlates with the number of actual COVID‑19 cases reported.5,6 COVID‑19 infodemiology may be aided by the presence of pathognomonic symptoms, in particular, loss of taste or smell. Recent observations have demonstrated 11‑fold increased odds of having olfactory and / or gustatory dysfunction in COVID‑19 compared with other causes of acute respiratory infection,7 underscoring the potential utility of monitoring these characteristic symptoms in the community to predict current COVID‑19 cases and inform public health responses.
In this investigation, we aimed to determine whether Google search trends pertaining to anosmia (utrata węchu) and dysgeusia (utrata smaku), as well as other COVID‑19 symptoms, correlate with the past surveillance data in Poland over the course of the pandemic.
Methods
Relative interest values of Google search terms in Poland were gathered using Google Trends for the period between May 18 and November 22, 2020, and aggregated by week in a Microsoft Excel spreadsheet (Microsoft, Redmond, Washington, United States), given that the number of COVID‑19 cases was also announced on a weekly basis to avoid daily variations in reporting. Each unit in Google Trends represents relative search interest per day on a 100‑point scale, where the maximum is set by the highest search volume for a particular term in the period studied, and a weekly score may amount up to 700 points. This study focused on Polish Google search terms concerning loss of smell (utrata węchu), loss of taste (utrata smaku) as well as fever (gorączka), headache (ból glowy), cough (kaszel), dyspnea (duszność), and shortness of breath (problemy z oddychaniem). Data on the number of new weekly cases in Poland was obtained via official reports from the Polish National Institute of Public Health,8 and tabulated together with the Google Trend scores throughout the same period.
Statistical analysis
For each search term, cross‑correlation functions were plotted to determine the time lags that provided the highest possible correlations between the Google Trends time series and the weekly COVID‑19 case count time series, as well as the corresponding P values and 95% CIs. Linear regression was performed for time series analysis to estimate the quantitative effect of Google Trend score increases on subsequent increases in weekly COVID‑19 cases, and to identify the time lag with the highest predictive value. Selection of variables was based on the results of cross‑correlation functions, considering lags with the highest cross‑correlations. These results were obtained through R Software (version 4.0.2; R Foundation for Statistical Computing). We chose a P value of less than 0.05 as the threshold of statistical significance. Model performance was assessed using adjusted R2 values and graphic analysis to see how closely the infection rate predictions based on Google Trend scores resembled the actual surveillance records.
This study was conducted in compliance with the Declaration of Helsinki, under the terms of relevant local legislation. The analysis was based on searches of unrestricted, publicly available databases; thus, no informed consent or ethical committee approvals were required.
Results
Weekly COVID‑19 cases and Google Trend scores for each symptom searched are presented in Supplementary material, Table S1. The highest Google Trend value out of all searched symptoms was observed for cough during the week of October 26, and the lowest was observed for smell loss during the week of June 1. The weekly number of new COVID‑19 cases ranged from 1927 in the last week of June to 172 658 in the week of November 9.
The results of the cross‑correlation analysis can be found in Supplementary material, Table S2. Among the symptoms searched, both smell loss and taste loss had the highest peak cross‑correlations with the weekly case count time series, particularly at a 1‑week lag (r = 0.91, 95% CI, 0.72–1; P <0.001 and r = 0.93, 95% CI, 0.74–1; P <0.001, respectively). The resemblance between the pattern in Google Trend scores for loss of smell and taste and new weekly COVID‑19 cases in the following weeks is illustrated in Figure 1A. The remaining symptoms had weaker cross‑associations at their respective optimal time lags (r range, 0.41–0.85). Dyspnea and shortness of breath had the highest cross‑correlation coefficients at no time lag (r = 0.58, 95% CI, 0.39–0.77; P = 0.003 and r = 0.41, 95% CI, 0.22–0.6; P = 0.03, respectively). The term fever required a 2‑week lag for optimal correlation (r = 0.75, 95% CI, 0.56–0.94; P <0.001), and both headache and cough required a 1‑week lag (r = 0.85, 95% CI, 0.66–1; P <0.001 and r = 0.75, 95% CI, 0.57–0.95; P <0.001, respectively). Figure 1B shows trends in Google searches for symptoms not related to smell and taste loss, with patterns clearly less similar to surveillance data.
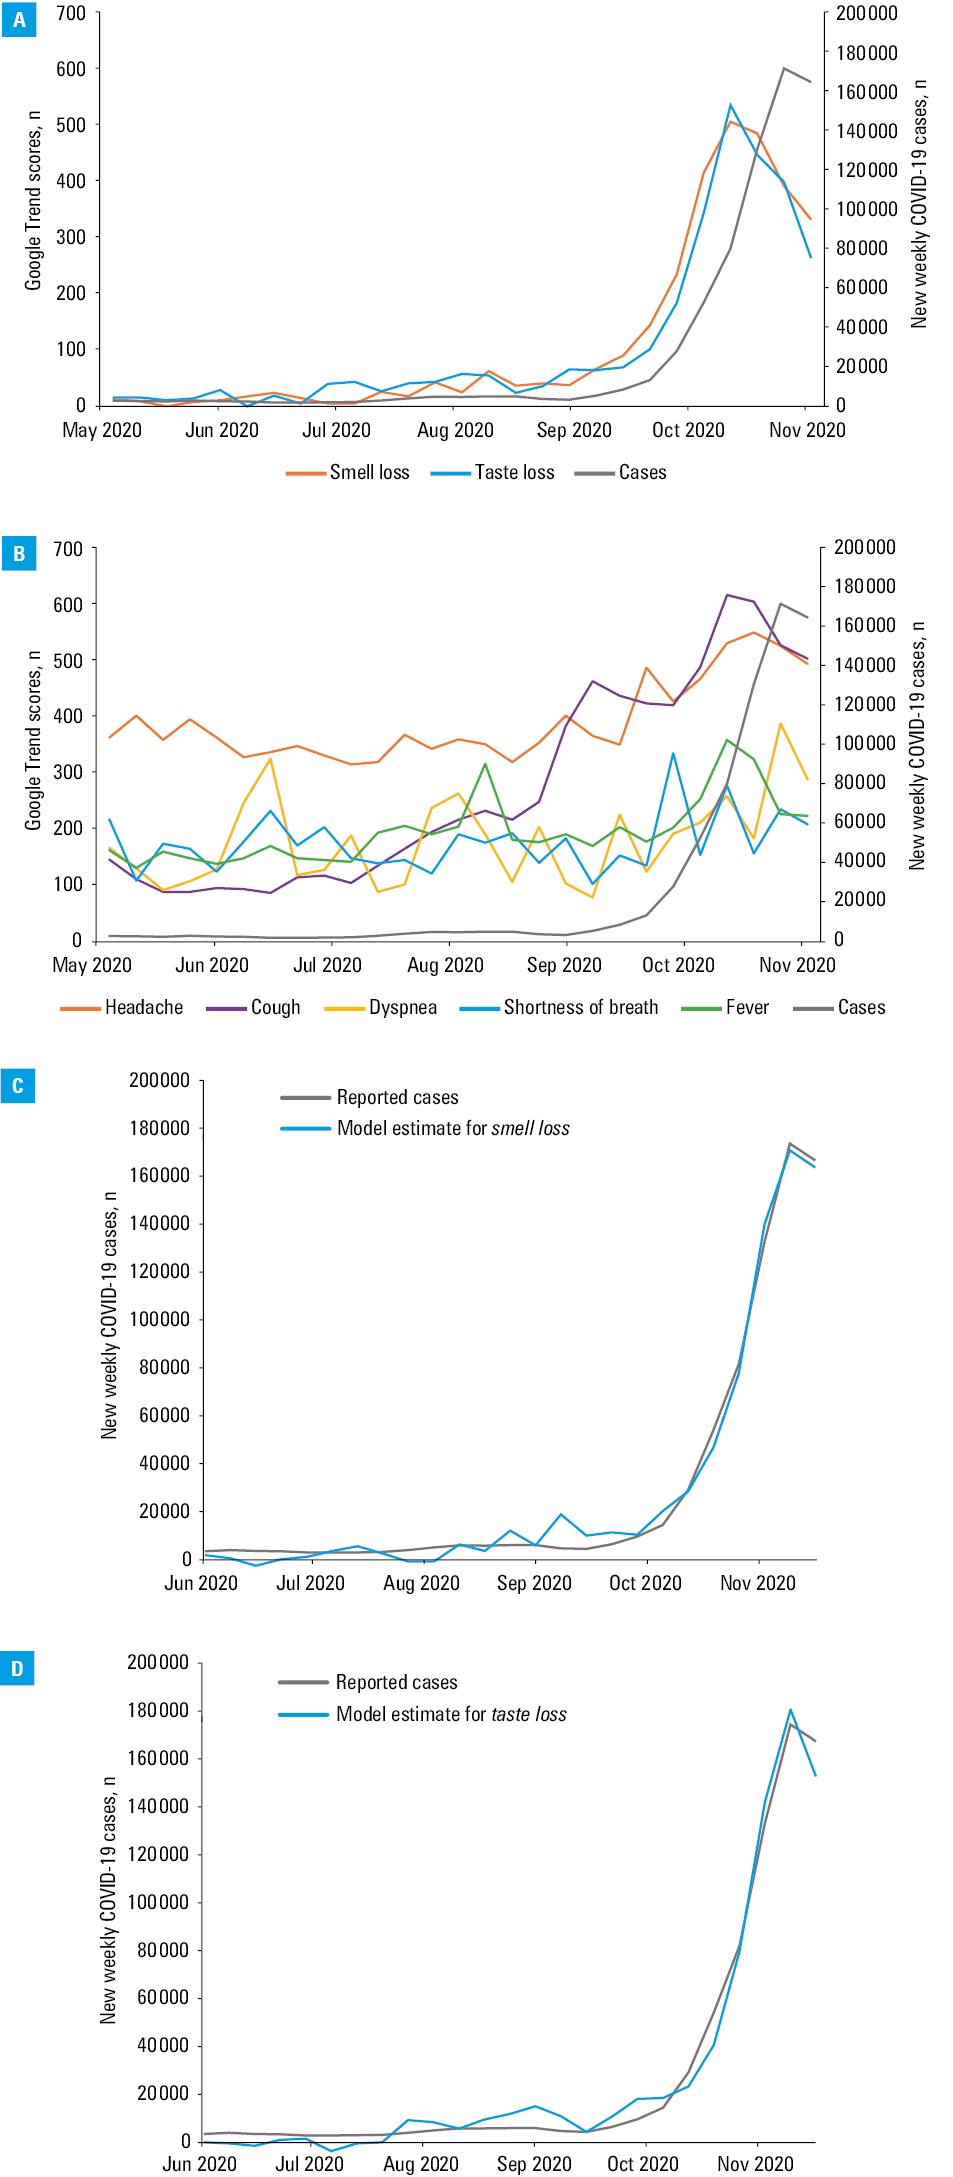
The results of time series linear regression for smell loss and taste loss are shown in Supplementary material, Table S3. For smell loss, the effect of the 2‑week–lagged time series was highly significant and estimated at 340.7 (95% CI, 327.2–354.2; P <0.001), meaning that the number of predicted COVID‑19 cases was increased by 340.7 per 1‑unit increase in the Google Trends value for smell loss 2 weeks before. The effect of the 1‑week–lagged time series for smell loss was not significant. This linear regression model had an adjusted R2 of 0.99. For taste loss, both the 1‑week and 2‑week–lagged time series were significant for estimating the weekly number of COVID‑19 cases. The model expression indicates that the number of predicted COVID‑19 cases rose by 111.5 per 1‑unit increase in the Google Trends value for taste loss 1 week before (95% CI, 65.4–157.6; P <0.001), and by 251.2 per 1‑unit increase 2 weeks prior (95% CI, 201.2–301.1; P <0.001). The adjusted R2 for this model was 0.98. The fitted values of these linear regression models for smell loss and taste loss, as well as the trend in COVID‑19 cases reported, are represented in Figure 1C and 1D, respectively.
Discussion
Our study demonstrates a significant association between the COVID‑19–specific search terms smell loss and taste loss and new weekly COVID‑19 cases in Poland, particularly at 1‑week delay using cross‑correlation analysis. Subsequent time series linear regression analysis for smell loss and taste loss yielded a model with a near perfect fit, suggesting that Google Trends for these pathognomonic symptoms have a high predictive accuracy for confirmed SARS‑CoV‑2 infection 1 to 2 weeks later in Poland.
Studies investigating variations in online search preferences in the context of past disease outbreaks have repeatedly demonstrated that patterns of Google search frequencies and disease surveillance data have a striking resemblance, whereby their temporal relation could allow for prediction of future trajectory of the epidemic based on internet search volumes at a particular period in time. These infodemiology metrics have likewise been studied during the current COVID‑19 pandemic. While some studies employed less specific symptoms such as fever, dry cough, fatigue, nasal congestion and dyspnea,9 particularly strong correlations have also been illustrated between the more pathognomonic symptoms such as anosmia and dysgeusia and future COVID‑19 incidence patterns.5 Notably, a study by Lippi et al6 found that this association becomes stronger when correlating Google Trends with COVID‑19 cases reported 2 weeks later, as opposed to cases reported in the same week. Our findings support this, as both smell loss and taste loss produced the highest cross‑correlation coefficients in comparison to all nonpathognomonic symptoms, taking into account the time delay required for optimal correlation. Moreover, background seasonal patterns of diseases with similar nonspecific symptoms, especially heading into the flu and cold seasons, may be significant confounders in search trends, underscoring the importance of relying on specific symptoms.7 Furthermore, Lippi and Mattiuzzi10 stressed on the importance of considering the “atypical” symptoms of anosmia and dysgeusia for case definition, particularly given the high prevalence among COVID‑19 patients (49% and 48%, respectively), high positive predictive value for confirmed infection (83%), and the fact that these signs develop early after infection versus postinfection in the case of the common cold and influenza.
Surveillance based on Google Trends is limited by the influence of mass media communications as a possible confounder of internet user behavior. Conversely, decreasing need to research self‑reported symptoms due to increased knowledge of anosmia and dysgeusia as COVID‑19–specific symptoms may undermine the reliability of predicted infection rates.
Conclusions
In conclusion, Google Trends for anosmia and dysgeusia have a high predictive power for anticipating new COVID‑19 cases 1 to 2 weeks ahead of the official reports in Poland, serving as a useful infodemiological tool for anticipating an impending outbreak, with the potential of providing valuable buffer time to allocate the necessary supplies and personnel to hospitals expecting a surge in COVID‑19 patients. Upon verification by prospective research comparing model performance in different regions of Poland, public health organizations are encouraged to take advantage of this free forecasting system to anticipate and effectively manage COVID‑19 outbreaks throughout Poland.
- Coronavirus Testing Survey. American Association for Clinical Chemistry. https://www.aacc.org/science‑and‑research/covid‑19‑resources/aacc‑covid‑19‑testing‑survey. Accessed December 31, 2020.
- Eysenbach G. Infodemiology and infoveillance: framework for an emerging set of public health informatics methods to analyze search, communication and publication behavior on the Internet. J Med Internet Res. 2009; 11: e11. | Crossref
- Dugas AF, Jalalpour M, Gel Y, et al. Influenza forecasting with Google Flu Trends. PLoS One. 2013; 8: e56176. | Crossref
- Bujnowska‑Fedak MM. Trends in the use of the Internet for health purposes in Poland. BMC Public Health. 2015; 15: 194.
- Cherry G, Rocke J, Chu M, et al. Loss of smell and taste: a new marker of COVID‑19? Tracking reduced sense of smell during the coronavirus pandemic using search trends. Expert Rev Anti Infect Ther. 2020; 18: 1165‑1170.
SUPPLEMENTARY MATERIAL
ARTICLE INFORMATION