Increase in the prevalence of metabolic syndrome in Poland: comparison of the results of the WOBASZ (2003–2005) and WOBASZ II (2013–2014) studies
Key words: abdominal obesity, dyslipidemia, hyperglycemia, hypertension, metabolic syndrome


 CC BY-NC-SA 4.0
Increase in the prevalence of metabolic syndrome in Poland: comparison of the results of the WOBASZ (2003–2005) and WOBASZ II (2013–2014) studies
Introduction: Metabolic syndrome (MS) significantly increases cardiovascular risk. Knowledge about the current prevalence of MS in the Polish population is limited.
Objectives: The aim of this study was to assess the prevalence of MS in the Polish population based on the results of the WOBASZ II study (2013–2014) and to compare the obtained data with the results of the WOBASZ study (2003–2005).
Patients and methods: A representative sample of 19 751 Polish adults from the WOBASZ and WOBASZ II studies was analyzed. Diagnostic criteria for MS included abdominal obesity, elevated blood pressure, elevated fasting glucose values, and lipid disorders; MS was diagnosed if at least 3 individual components were present.
Results: Based on the WOBASZ II study (2013–2014), the prevalence of MS in Poland was 32.8% in women and 39% in men. In women, the most frequent component of MS was abdominal obesity (64.7%), while in men it was increased blood pressure (62%). In the decade between the WOBASZ and WOBASZ II studies, there was a significant increase in the prevalence of MS in Polish adults aged 20 to 74 years: by 3.3 percentage points in women (26.6% vs 29.9%; P <0.001) and by 8.8 percentage points in men (30.7% vs 39.4%; P <0.001). The increase in the frequency of carbohydrate metabolism disorders was the greatest contributor to this phenomenon; however, abdominal obesity and lipid disorders were also significantly more frequent.
Conclusions: It is alarming that in the decade between the WOBASZ and WOBASZ II studies there was such a significant increase in the prevalence of MS and its individual components in Poland.
What's new?
Criteria for recognizing metabolic syndrome (MS) include 5 cardiovascular risk factors commonly found in the Polish population: abdominal obesity, disorders of carbohydrate metabolism, increased blood pressure, hypertriglyceridemia, and reduced level of high‑density lipoprotein cholesterol. In this manuscript, we showed that in the decade between the WOBASZ (2003–2005) and WOBASZ II (2013–2014) studies, the prevalence of MS has significantly increased. The analysis of individual components of MS revealed an increase in the prevalence of almost all of them; the only positive observation was a decrease in the prevalence of elevated blood pressure values. The greatest increase was observed in the prevalence of carbohydrate metabolism disorders. These alarming findings also applied to the youngest age groups. The results of our study indicate the need for further intensification of preventive measures and targeting of preventive programs also to Poles of reproductive age.
Introduction
Cardiovascular disease is the leading cause of death in the Polish population. Metabolic syndrome (MS) is a set of interrelated factors, the coexistence of which increases the risk of all‑cause and cardiovascular mortality as well as cardiovascular disease and stroke.1 The components of MS include abdominal obesity, elevated blood pressure (BP), increased blood glucose level, and lipid disorders. Reaven2 described MS for the first time in 1988 as syndrome X, using a pathophysiological concept based on insulin resistance. The first formalized definition of MS was developed in 1999, along with the publication of the World Health Organization criteria.3 In the following years, many medical organizations and societies presented new versions of the definition of MS. The most recent one was set out in the 2009 Joint Interim Statement endorsed, among others, by the American Heart Association and International Diabetes Federation.4
The aim of this study was to assess the prevalence of MS in the Polish population based on the results of the WOBASZ II study (2013–2014) and to compare these data with the results of the WOBASZ study (2003–2005).
Patients and methods
The research methodology of the WOBASZ and WOBASZ II studies has been described in detail elsewhere.5,6
The WOBASZ study was a nationwide, cross‑sectional study aimed at assessing the frequency and level of control of selected risk factors for cardiovascular diseases. It was carried out from 2003 to 2005 on a representative group of 13 545 Polish adults aged 20 to 74 years who were randomly selected from the central register of population records (the PESEL database). The WOBASZ II study was conducted from 2013 to 2014 using the same sampling methods in a group of 6170 respondents aged 20 years and over. This population comprised the sample size for our analysis of the WOBASZ II study. For the purpose of a comparative analysis between the 2 studies, a sample size of 5408 people aged 20 to 74 years was extracted from the WOBASZ II population. All individuals signed written, informed consent to participate in the study and donate blood samples for laboratory analysis. The WOBASZ and WOBASZ II studies were approved by the Bioethics Committees.
The prevalence of MS was assessed using the criteria adopted in the 2009 Joint Interim Statement4 (Table 1). All measurements were taken by trained nurses. Waist circumference was measured at the level of the navel with an accuracy of 0.5 cm. The values recommended for the European population (White race) by the World Health Organization (80 cm for women and 94 cm for men) were used as cutoff points for the diagnosis of abdominal obesity based on waist circumference.7
Criterion | Women | Men |
Abbreviations: DBP, diastolic blood pressure, HDL‑C, high‑density lipoprotein cholesterol; SBP, systolic blood pressure | ||
Increased waist circumference | ≥80 cm | ≥94 cm |
Elevated blood pressure | SBP ≥130 mm Hg or DBP ≥85 mm Hg or antihypertensive therapy | |
Elevated fasting glucose | ≥100 mg/dl or antidiabetic therapy | |
Reduced level of HDL‑C | <50 mg/dl | <40 mg/dl |
Elevated level of triglycerides | ≥150 mg/dl or treatment for hypertriglyceridemia | |
Blood pressure was measured with an automatic BP monitor 3 times during a single visit at 2‑minute intervals, in accordance with the guidelines of the Polish Society of Hypertension and European Society of Hypertension.8,9 Before the measurement, arm circumference was measured to select the appropriate cuff. The mean of the second and third measurements was used for the analysis.
Venous blood was collected from each patient, depending on the conditions, either in designated medical centers or during a home visit, after about 10 hours of fasting. Within 4 hours from collection, the blood samples were delivered to a local laboratory, where they were centrifuged and then the serum was frozen at –20 °C until the analysis in the central laboratory. Parameters such as high‑density lipoprotein cholesterol (HDL‑C) and triglycerides were measured using automatic standard routine enzymatic methods. Glucose measurement was performed using an enzymatic method with hexokinase, with the use of glucose 6‑phosphate dehydrogenase.5 Hypertriglyceridemia was diagnosed based on serum triglyceride values (≥150 mg/dl) only; pharmacological treatment of this type of dyslipidemia was not considered.
Data regarding the presence of diabetes or hypertension and the medications taken were obtained through a questionnaire interview.
Statistical analysis
Based on the Shapiro–Wilk test, the continuous variables did not follow a normal distribution; therefore, the Mann–Whitney test was applied. Differences in the prevalence of the compared components of MS were analyzed using the proportion test. All statistical calculations were performed using the STATISTICA 12 software (StatSoft Polska Sp. z o.o., Kraków, Poland). The significance level was set at a P value of less than 0.05. To allow a comparison between the studies, both the WOBASZ and WOBASZ II samples were weighted by age and sex according to the structure of the Polish population at the time when the WOBASZ II study was performed (December 2013).
Results
The WOBASZ II study (2013–2014) The median values of the parameters constituting the individual components of MS are presented in Supplementary material, Table S1. Of note, in the population aged 20 to 59 years, all the study parameters differed significantly by age groups and sex. In the age group of 60 to 79 years, significant differences were observed for waist circumference, HDL‑C level, systolic BP, and fasting blood glucose level. In the oldest group (>80 years), significant differences were observed only for diastolic BP (HDL‑C level was of borderline significance).
The prevalence of MS in the population aged 20 years and over is presented in Table 2. The presented data are standardized by age and sex to reflect the structure of the Polish population.
Age groups | Women | Men | ||
Value, n (%) | 95% CI | Value, n (%) | 95% CI | |
20–39 years | 1224 (8.8) | 7.2–10.3 | 1263 (21.8) | 19.5–24 |
40–59 years | 1028 (35.9) | 33–38.8 | 1006 (50.4) | 47.3–53.5 |
60–79 years | 767 (59.7) | 56.2–63.2 | 587 (56.2) | 52.2–60.2 |
80 years and older | 205 (59.6) | 52.8–66.3 | 90 (43.4) | 32.9–53.8 |
Total | 3224 (32.8) | 31.1–34.4 | 2946 (39) | 37.3–40.8 |
Based on the WOBASZ II study, the prevalence of MS in the Polish population was 32.8% (95% CI, 31.1–34.4) in women and 39% (95% CI, 37.3–40.8) in men. The analysis by age groups showed a significant difference in the prevalence of MS between the sexes in the 2 youngest age groups (ie, 20–39 and 40‑59 years), while in the population aged over 60 years it was not significant. However, there was a trend towards a higher prevalence of MS in women over 80 years of age. The highest prevalence of MS, both in women and men, was observed in the age group of 60 to 79 years.
The prevalence of MS clearly increased with age, regardless of the sex. In men aged 40 to 59 years, MS occurred almost twice as often as in those aged 20 to 39 years (50.4% vs 21.8%, respectively). In women, the prevalence of MS was almost 4 times higher in the former age group compared with the latter group (35.9% vs 8.8%, respectively).
The prevalence of individual components of MS in the Polish population is shown in Figure 1. Based on the WOBASZ II study, the most frequent component in women in all age groups was abdominal obesity (64.7%; 95% CI, 63.1–66.4 vs 55.2%; 95% CI, 53.4–57 in women and men, respectively), whereas in men it was elevated BP (48.2%; 95% CI, 46.5–50 vs 62%; 95% CI, 60.2–63.7 in women and men, respectively).
Data on the percentage of men and women meeting the criteria of individual components of MS by age groups are presented in Table 3. Abdominal obesity and elevated BP were the most frequently occurring MS components in all age groups. It should be emphasized that abdominal obesity was very common in women. In the youngest age group (20–39 years) as many as 42.1% of women had central obesity, while in the age group of 60 to 79 years, only 1 in 10 women was is not obese. Also, in the youngest group of men, the percentage of individuals meeting all the criteria of all MS components was high.
Parameter | 20–39 years | 40–59 years | 60–79 years | ≥80 years | All | |||||
Women | Men | Women | Men | Women | Men | Women | Men | Women | Men | |
All data are presented as percentage (95% CI).
Abbreviations: see Table 1 | ||||||||||
Increased waist circumference | 42.1 (39.4–44.9) | 38.9 (36.2–41.6) | 71.3 (68.5–74) | 65.6 (62.7–68.5) | 87.2 (84.8–89.6) | 72.5 (68.9–76.1) | 82.3 (77.1–87.6) | 56.24 (45.79–66.7) | 64.7 (63.1–66.4) | 55.2 (53.4–57) |
Elevated triglycerides | 8.9 (7.3–10.5) | 28.6 (26.1–31.1) | 24.7 (22.1–27.3) | 41 (38–44.1) | 27.9 (24.7–31.1) | 30.9 (27.1–34.6) | 22 (16.3–27.7) | 29.57 (19.95–39.18) | 19.3 (17.9–20.7) | 33.3 (31.6–35) |
Reduced HDL‑C | 26.2 (23.7–28.6) | 24.1 (21.7–26.4) | 31.1 (28.2–33.8) | 29.3 (26.5–32.2) | 41.2 (37.7–44.6) | 26 (22.4–29.5) | 49.4 (42.5–56.3) | 29.21 (19.63–38.79) | 32.8 (31.1–34.4) | 26.4 (24.8–28) |
Elevated blood pressure + hypertension | 16.4 (14.3–18.5) | 44.8 (42–47.5) | 52.4 (49.4–55.5) | 69.9 (67–72.7) | 82.8 (80.2–85.5) | 83.3 (80.2–86.3) | 88.3 (83.9–92.7) | 76.61 (67.69–85.53) | 48.3 (46.5–50) | 62 (60.2–63.7) |
Elevated fasting glucose + diabetes | 6.7 (5.3–8.1) | 16.6 (14.6–18.7) | 24.7 (22–27.3) | 44.8 (41.7–47.9) | 47.2 (43.7–50.8) | 57.3 (53.3–61.3) | 48.9 (42–55.8) | 49.48 (38.94–60.01) | 24.8 (23.3–27.3) | 35.4 (33.6–37.1) |
Comparison of the results of the WOBASZ and WOBASZ II studies
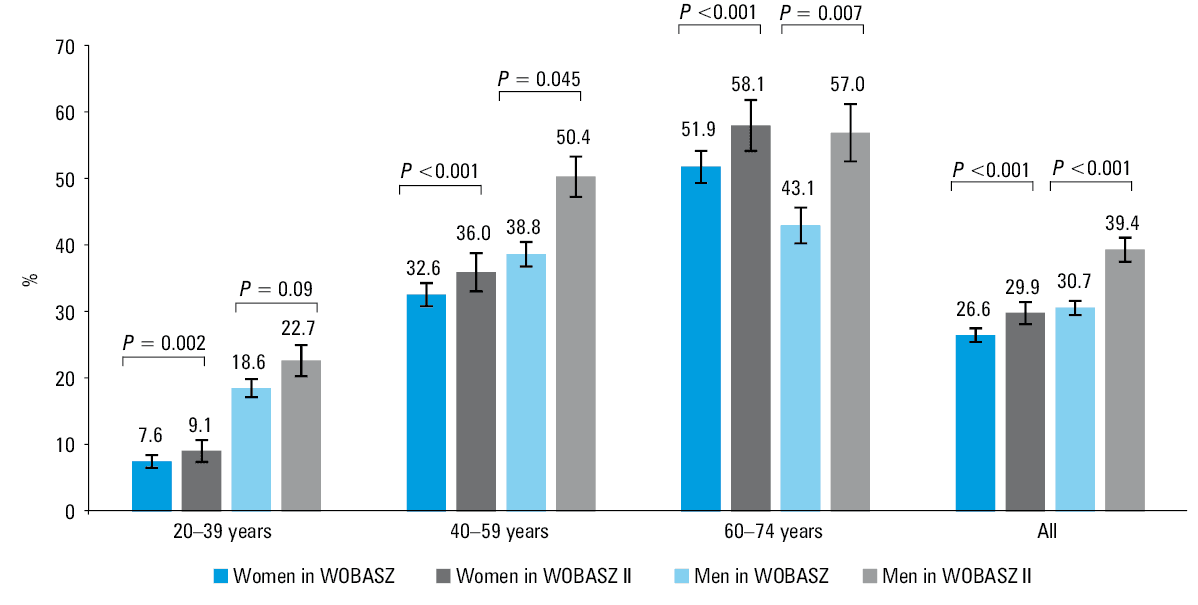
Compared with the WOBASZ study, there was a significant increase in the prevalence of MS in the Polish population aged 20 to 74 years: by 3.3 percentage points (pp) in women (from 26.6% to 29.9%; P <0.001) and 8.8 pp in men (from 30.7% to 39.4%; P <0.001) (Figure 2). The highest increase was found in the age group of 60 to 74 years: by 6.2 pp in women (52% vs 58.1%; P <0.001) and 14 pp in men (43.1% vs 57%; P = 0.007). In the remaining age groups, the respective values were as follows: age group of 40 to 59 years, 3.4 pp in women and 11.7 pp in men; age group of 20 to 39 years, 1.6 pp in women and 4.2 pp in men.
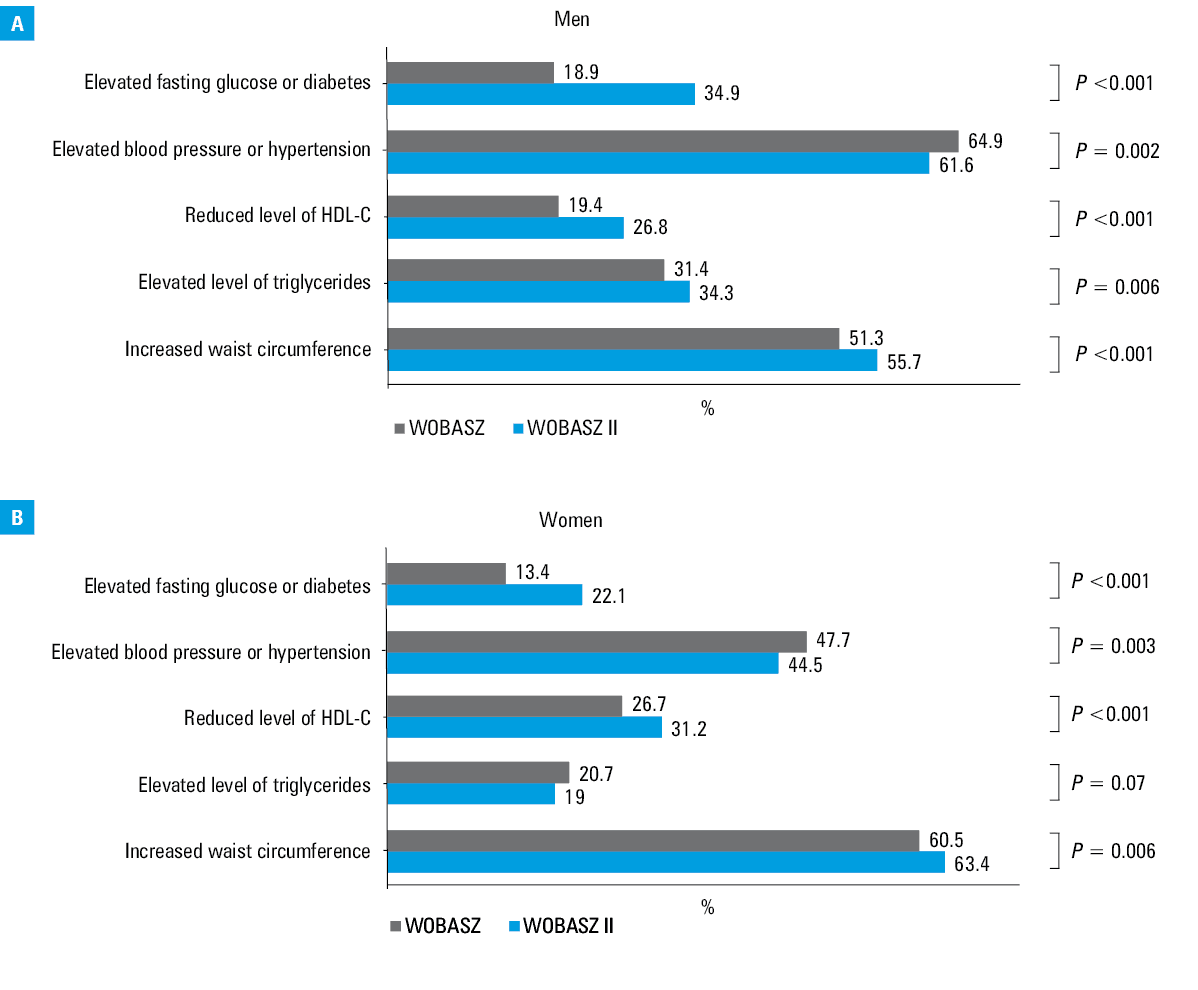
Changes in the prevalence of individual components of MS are shown in Figure 3A and 3B. Compared with the WOBASZ study, the percentage of women meeting the criteria of abdominal obesity (60.4% vs 63.4%; P = 0.006) and poor glycemic control (13.4% vs 22.1%; P <0.001) increased significantly, whereas the percentage of women meeting the hypertension criterion decreased (47.7% vs 44.4%; P = 0.003) (Figure 3A). In men, there was an increase in the percentage of respondents meeting the criteria of almost all individual MS components except for elevated BP, the prevalence of which decreased compared with the WOBASZ study (64.9% vs 61.5%; P = 0.002) (Figure 3B).
Abbreviations: see Table 1
Changes in the prevalence of individual components of MS by age groups are presented in Supplementary material, Tables S2 and S3.
Discussion
Based on the data from the WOBASZ II study, it can be inferred that the prevalence of MS in Poland is high and increases with age. Taking into account the forecasts of the Central Statistical Office regarding the aging of the Polish society,10 it can be expected that the number of people meeting the criteria for MS will increase.
Apart from the WOBASZ (2003–2005) study,11 the only analysis describing the prevalence of MS in the Polish population is the NATPOL 2002 study.12 In this study, the prevalence of MS was estimated at 22.6% in women and 18% in men, based on the 2001 Adult Treatment Panel III criteria.13
Due to the differences between the definitions of MS proposed by various expert groups over the years as well as the different cutoff values for abdominal obesity recommended for particular ethnic groups, it is difficult to compare the results of epidemiological studies between countries. The prevalence of MS in the American population was determined based on the NHANES (National Health and Nutrition Examination Survey) study.14 This study has been conducted periodically since the 1960s on a representative group of Americans to determine the prevalence of the most common diseases and risk factors. Moore et al14 used the diagnostic criteria for MS set forth in the 2009 Joint Interim Statement,4 but adopted different criteria for abdominal obesity (≥102 cm for men and ≥88 cm for women) for the American population than those recommended for the European people. According to his analysis, the prevalence of MS in the years 2007 to 2012 was 33.4% in men and 34.9% in women.14 Raposo et al15 estimated the prevalence of MS in the Portuguese population at 38.8% in women and 33.5% in men. In a systematic review by Mokhayeri et al,16 based on cross‑sectional studies conducted in Iran after 2005, the prevalence of MS was evaluated at 23% in men and 33% in women, whereas in the Chinese population, characterized by a lower average age, it was approximated at 23.8% in women and 24.6% in men, on the basis of data published in 2018.17
In the Polish population, MS was found to be more common in men. In the oldest age groups (60–79 and ≥80 years), a trend towards a more frequent occurrence of MS in women could be observed, but the difference did not reach statistical significance. This is most likely due to the fact that old and very old men are characterized by an accumulation of risk factors and high cardiovascular mortality at a younger age than women. According to the data of the Central Statistical Office, in 2018 the average life expectancy was 73.9 years for men and 81.8 years for women.18 The relatively high prevalence of MS among young men (21.8%) as well as frequently observed elevated BP, disorders of carbohydrate metabolism, and abdominal obesity, are alarming. Poor health status of this demographic group suggests that preventive measures and lifestyle modifications should be implemented at an early stage, even after meeting one of the criteria of MS. Undoubtedly, the significant increase in the prevalence of MS in the Polish population in the decade between the WOBASZ and WOBASZ II studies is very disturbing. The increase in the frequency of MS was as much as 3.3 pp in women and 8.8 pp in men. This means that in the analyzed period, the frequency of MS in women increased by 12.4% and in men by as much as 28.4%. This was mainly due to a significant increase in the number of people meeting the criterion of carbohydrate metabolism disorders. The analysis of data from the 2 studies showed an increase in the prevalence of diabetes in the Polish population from 6.6% to 8.4% and an increase in the prevalence of impaired fasting glucose from 9.3% to 18.4%.19 In the NATPOL study conducted in 2011, the prevalence of diabetes in the population aged 18 to 79 years was estimated at 6.7% and impaired fasting glucose at 15.6%.20 An alarming increase in the prevalence of carbohydrate metabolism disorders is observed globally. The main reason behind this is the growing number of overweight and obese people.21
When comparing the results of the 2 WOBASZ studies, it can be observed that the percentage of people meeting the criteria of individual MS components has increased in almost every category. The only positive finding was a decrease in the number of people meeting the high BP criterion. Interestingly, other analyses performed in this population showed an increase in the prevalence of hypertension in the Polish population and an improvement in its control.22 However, it should be remembered that the criteria for the diagnosis of arterial hypertension according to the 2018 Guidelines of the European Society of Cardiology23 differ from the cutoff values for elevated BP used as a diagnostic criterion for MS (systolic BP ≥140 mm Hg and / or diastolic BP ≥90 mm Hg vs systolic BP ≥130 mm Hg and / or diastolic BP ≥85 mm Hg). More research is required to assess the prevalence of hypertension and its control in the Polish population.
Despite the positive data on the improved control of hypertension in Poland, it should be noted that it is still unsatisfactory—only 24.3% of the WOBASZ II study participants with diagnosed and treated hypertension achieved adequate BP control. Moreover, it is important to emphasize how challenging it may be for clinicians to achieve the assumed therapeutic goals in patients with several comorbid risk factors, such as those with MS. A recent analysis published by Niklas et al24 showed that among patients with comorbid hypertension and hypercholesterolemia, good control of both factors was achieved in only 5.4% of cases.
The increase in the proportion of people meeting other criteria for MS corresponds to the results of the analyses of data from the WOBASZ II study on the prevalence of abdominal obesity and dyslipidemia.25,26
The great advantage of the WOBASZ and WOBASZ II studies is that they are national, cross‑sectional studies carried out periodically. Identical methodology and selection of a representative sample allow for a reliable determination of trends in the prevalence of the most common diseases and cardiovascular risk factors in the population. On the other hand, a limitation that may make the results less representative is the relatively low response rate in the WOBASZ II study, which was about 45%. In comparison, in the WOBASZ study, the response rate was almost 77%. The decline in participation rates in epidemiological studies has been a common phenomenon for many years. The European Health Examination Survey Pilot Project, conducted in the years 2009 to 2012, assessed the participation rate in epidemiological studies in 12 European countries and showed that it ranged from 16% to 57% in randomly selected men and 31% to 74% in women.27 However, the low response rate may result in the selection of healthier people in the sample and underestimation of the actual prevalence of MS in the Polish population.
Conclusions
The prevalence of MS in the Polish population is high. This is largely due to high rates of elevated BP and central obesity. The relatively high prevalence of MS among young men is alarming.
The increasing prevalence of obesity, dyslipidemia and carbohydrate metabolism disorders has contributed to the increase in the prevalence of MS in the Polish population. Therefore, intensified preventive efforts are required to reduce potential complications, such as increased cardiovascular morbidity and mortality. These preventive programs should be population‑based, also including young Polish adults.
- Galassi A, Reynolds K, He J. Metabolic syndrome and risk of cardiovascular disease: a meta‑analysis. Am J Med. 2006; 119: 812‑819. | Crossref
- Reaven GM. Role of insulin resistance in human disease. Diabetes. 1988; 37: 1595‑1607. | Crossref
- Alberti KGMM, Zimmet PZ. Definition, diagnosis and classification of diabetes mellitus and its complications. Part 1: diagnosis and classification of diabetes mellitus. Provisional report of a WHO Consultation. Diabet Med. 1998; 15: 539‑553. | Crossref
- Alberti KGMM, Eckel RH, Grundy SM, et al. Harmonizing the metabolic syndrome: a joint interim statement of the International Diabetes Federation Task Force on Epidemiology and Prevention; National Heart, Lung, and Blood Institute; American Heart Association; World Heart Federation; International Atherosclerosis Society; and International Association for the Study of Obesity. Circulation. 2009; 120: 1640‑1645. | Crossref
- Drygas W, Niklas AA, Piwońska A, et al. Multi‑centre National Population Health Examination Survey (WOBASZ II study): assumptions, methods, and implementation. Kardiol Pol. 2015; 74: 681‑690. | Crossref
SUPPLEMENTARY MATERIAL
ARTICLE INFORMATION