Radiological markers of granulomatosis with polyangiitis with nasal involvement
Key words: granulomatosis with polyangiitis, nasal cavity, nasal mucosa, proteinase 3 antineutrophil cytoplasmic antibodies, respiratory system


 CC BY-NC-SA 4.0
Radiological markers of granulomatosis with polyangiitis with nasal involvement
Introduction: Granulomatosis with polyangiitis (GPA) is an autoimmune disease leading to necrotizing lesions in the affected tissues. Computed tomography (CT) of paranasal sinuses reveals multiple lesions in patients with GPA, for example, sinus opacification, bone / cartilage destruction, and neoosteogenesis.
Objectives: We aimed to describe and compare CT lesions found in patients with GPA and those with chronic rhinosinusitis (CRS) and to propose a new radiological marker of GPA—nasal strands.
Patients and methods: This retrospective study (2014–2019) included 53 patients with GPA (22 men, 31 women) at a median (interquartile range) age of 45 (34–60) years. Computed tomography findings of mucosal lesions in paranasal sinuses, neoosteogenesis, bony and cartilaginous lesions, and nasal strands were analyzed. Nasal strands were described as intermucosal adhesions resembling bands. A total of 71 patients with CRS (reference group) were assessed for the presence of the same parameters.
Results: Computed tomography scans showed mucosal lesions in the sinuses of 35 patients (66%) with GPA. Nasal septum perforation was observed in 19 patients (35.8%), neoosteogenesis in 17 (32.1%), and bone damage in 14 (26.4%). External nose deformity was present in 16 patients (30.2%). Nasal strands on CT were found in 36 patients with GPA (68%) and 32 patients with CRS (45%). The presence of 5 or more strands was more characteristic of GPA than CRS (P <0.001). A positive correlation was found between the number of strands greater than or equal to 5 and the presence of proteinase 3 antineutrophil cytoplasmic antibodies (P = 0.046).
Conclusions: Nasal strands, a parameter reflecting pathologic mucus and atrophic lesions (tissue loss), should have a place in CT evaluation of the nasal cavities in patients suspected of or diagnosed with GPA.
What's new?
This paper presents a new, previously undescribed radiological marker observed in patients with granulomatosis with polyangiitis (GPA). Nasal endoscopy allows otorhinolaryngologists to observe nasal crusting, commonly occurring in patients with GPA. Without nasal endoscopy it is more difficult to notice this nasal symptom attributed to necrotizing lesions in the nasal mucosa. When analyzing computed tomography scans of patients with GPA, we have come across strands forming in the nasal cavities. They were also found in patients with chronic rhinosinusitis, but they were significantly fewer in number and thinner. Moreover, in patients with 5 or more strands, there was a significant positive correlation with the presence of proteinase 3 antineutrophil cytoplasmic antibodies.
Introduction
Autoimmune diseases develop in approximately 7% to 8% of the population. The number of autoimmune diseases exceeds 80, with some of the most common ones being celiac disease, Graves’ disease, Hashimoto’s thyroiditis, type 1 diabetes, rheumatoid arthritis, Sjögren’s syndrome, and multiple sclerosis. Granulomatosis with polyangiitis (GPA) is an autoimmune disease belonging to antineutrophil cytoplasmic antibody (ANCA)-associated vasculitides (AAV) that leads to necrotizing lesions in the affected tissues. Its etiology includes environmental factors as well as infectious and toxic agents, genetic background, and epigenetic regulation.1 The disease involves small and / or medium‑sized vessels. Its prevalence in Europe is 23 to 160 per 1 million people and it affects primarily White adults (rarely children), with no gender predilection.2,3 The Polish Vasculitis (POLVAS) Registry, encompassing 58.2% of the Polish population, showed that demographic characteristics and frequency of AAV in Poland are similar to other European countries.3
The diagnostic criteria for GPA according to the American College of Rheumatology (ACR) established in 1990 include hematuria, abnormal chest radiograph, ulcers in the oral and / or nasal mucosa, and positive histological examination. The disease is diagnosed if at least 2 of the abovementioned criteria are met.4
Granulomatosis with polyangiitis is a type of AAV5 in which cytoplasmic (C)-ANCA / proteinase 3 (PR3)-ANCA and perinuclear (P)-ANCA / myeloperoxidase (MPO)-ANCA are involved in the damage to the vascular endothelium, leading to necrosis.6,7 The ANCA tests were already known in the early 1990s, but they were not routinely performed then; they reached their current status in the diagnosis of GPA in the late 1990s,8 when they started to complement the ACR diagnostic criteria. In the localized form of the disease, ANCAs are present in 40% to 50% of patients, while as many as 75% to 95% of patients with the generalized form of the disease are C‑ANCA–positive. If uncertain, the diagnosis requires confirmation with a biopsy of the affected area followed by histological examination.8,9
The European Vasculitis Study divided vascular diseases associated with ANCA (including GPA) into 5 groups, according to the level of severity10: localized, early systemic, generalized, severe, and refractory. This division guides further treatment in patients with GPA. According to a retrospective analysis of the POLVAS registry, in patients with AAV independent risk factors for death are permanent renal replacement therapy, renal / respiratory involvement, age over 65 years, and the presence of c/PR3 ANCA. Ear, nose, and throat (ENT) involvement was identified as a factor negatively associated with permanent renal replacement therapy.3
Computed tomography (CT) findings in patients with GPA often include multiple lesions in the head and neck regions, especially in the nose and paranasal sinuses. The most common lesions are sinus opacification, bone / cartilage destruction, and neoosteogenesis. To date, there has been no description of CT lesions in the nasal cavities of patients with GPA, except for nasal septum perforation or lateral nasal wall destruction.
This study aims to provide a description of lesions found in sinonasal CT scans of patients with GPA in comparison with those found in patients with chronic rhinosinusitis (CRS) and to introduce a new radiological marker of the disease with its relation to the presence of PR3‑ANCA. Since PR3‑ANCA is considered a risk factor in AAV and given that there is a need to identify the subsets of patients at risk for relapses or infectious complications,11 we decided to present an analysis of GPA patients with upper respiratory tract involvement.
Patients and methods
This retrospective analysis was conducted between May 2014 and September 2019 at a university referral center. Approval of the Bioethical Committee was waived (AKBE/186/2018) due to the nonexperimental design of the study. The inclusion criteria comprised diagnosis of GPA based on the ACR criteria and European League Against Rheumatism (EULAR) guidelines,12 CT of the sinonasal region, and otorhinolaryngological examination with endoscopic assessment of the nose, ear, and larynx. Patients enrolled into the study were either primarily diagnosed—in the first year of treatment for GPA (12 out of 53 patients), were admitted to hospital in the course of the disease with a relapse (18 out of 53 patients), or were in remission (23 out 53 patients). All patients signed informed consent to participate in the study. A total of 53 (22 men and 31 women) out of 68 patients with GPA (diagnosed according to the ACR criteria and EULAR guidelines) met the inclusion criteria. The age of patients in the study group ranged between 14 and 86 years, with a median (interquartile range [IQR]) of 45 (34–60) years.
For the purpose of the study, all patients with GPA were divided into subgroups with or without rhinological manifestation of the disease (R[+] or R[–], respectively). The division was based on otorhinolaryngological examination involving nasal endoscopy. Patients without rhinological manifestation presented either otological or orolaryngeal symptoms, or none of them. Rhinological manifestation of the disease involved symptoms of rhinitis with nasal crusting, epistaxis, rhinosinusitis, septal perforation, or external nose deformity. Otological manifestation comprised external, middle, and internal ear lesions such as aural skin ulcers, acute / secretory otitis media, or sensorineural hearing loss and vertigo. Rarely, otitis media was complicated with facial nerve palsy. Orolaryngeal manifestation involved laryngeal stenosis with temporary tracheotomy, vocal cord paresis, or ulcerations in the oral cavity.
In the course of the disease, patients were treated with glucocorticoids with either cyclophosphamide or azathioprine. Plasmapheresis was applied rarely during treatment. None of the study patients received biological treatment (rituximab). Duration of the disease in the study group ranged between 0 and 24 years. Patients were examined at different time points in the course of the disease.
In the study group, the PR3‑ANCA test results were collected and Staphylococcus aureus nasal carriers were specified. The phase of the disease was determined as either active or in remission.
To assess the mucosal lesions of the sinuses on CT scans, a Lund–Mackay score (LMS) was used and each sinus was assigned a score13 of 0 (no abnormality), 1 (partial opacification), or 2 points (complete opacification). The ostiomeatal complex was assigned a score of either 0 (not obstructed) or 2 (obstructed). The total score ranged between 0 and 24 points and the evaluation included the frontal sinus, anterior and posterior ethmoidal cells, maxillary sinus, sphenoid sinus, and ostiomeatal complex.
To reflect the lesions in the bones, the Kennedy Osteitis (neoosteogenesis) Score (KOS) and Global Osteitis Score (GOS)14 were applied. In KOS, the sinus walls of the sinuses mentioned above were scored 0 points for a sinus wall thinner than 3 mm, 1 point for a sinus wall thickness of 3 to 5 mm, and 2 points for a sinus wall thicker than 5 mm (0–20 points in total). In GOS, the thickness of bones and obliteration of each sinus group as above were taken into consideration. The points were given as follows: 0 points, thickness <3 mm, obliteration <50% of the sinus; 1 point, thickness 3 to 5 mm, obliteration <50% of the sinus; 2 points, thickness >5 mm, obliteration <50% of the sinus or thickness <3 mm and obliteration >50% of the sinus; 3 points, thickness 3 to 5 mm, obliteration >50% of the sinus; and 4 points, thickness >5 mm, obliteration >50% of the sinus. The scale ranged from 0 to 40 points.
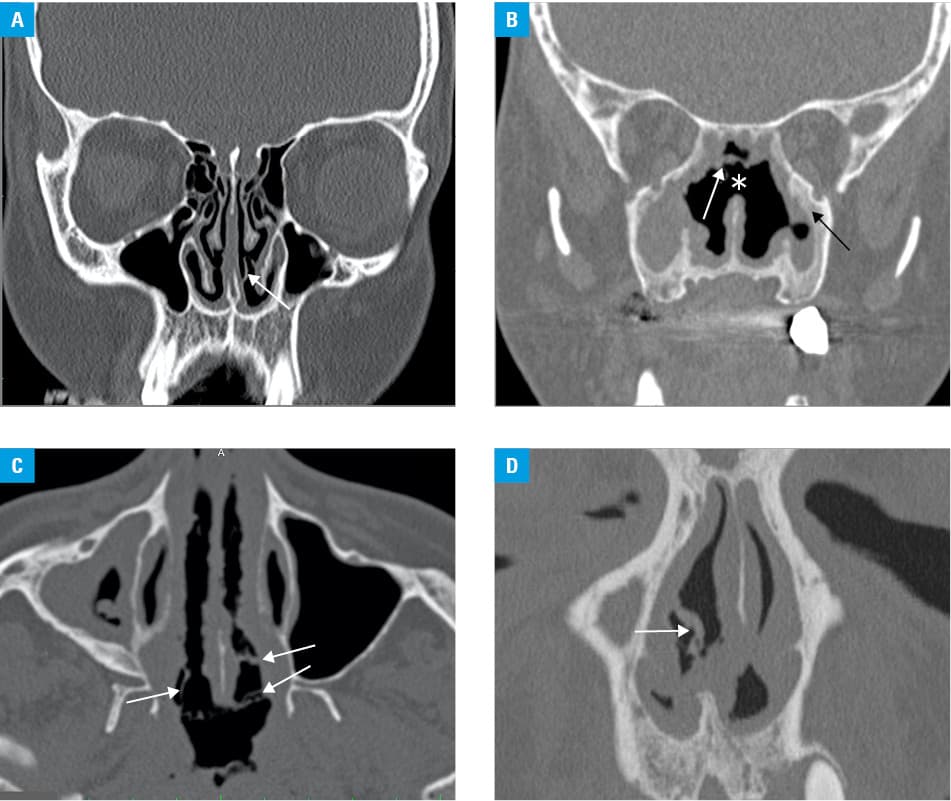
The CT scans were examined for the presence of intranasal soft‑tissue lesions herein referred to as nasal strands (NSs), that is, formations of dried mucus and atrophic tissue that form bridges between the walls of the nasal cavity. They may be either straight or irregular in shape (Figure 1) and may represent tissue remnants or tissue loss in the nasal cavity in patients with GPA. Strands found in the nasal vestibule or nasal valve area were not taken into consideration. The number of NSs in both nasal cavities was counted and divided into 3 categories: 0 to 1, 2 to 4, and 5 or more.
Patients with CRS were chosen as the reference group. The diagnosis of CRS was based on the EPOS 2012 criteria.15 They were analyzed as a group but also with a division into subgroups of patients with or without polyps (CRSwP or CRSsP, respectively). The LMS was assessed in 150 patients and the KOS, GOS, and NSs in 71 patients.
Statistical analysis
Variables were compared with the t test and the Mann–Whitney test. Correlations were analyzed using the Spearman correlation coefficient (ρ). Differences between dichotomous variables were tested using the χ2 and Fischer tests. For multiple comparisons, the Kruskal–Wallis test was applied. A receiver operating characteristic (ROC) curve was generated to show the true positive rate (sensitivity) and false positive rate (1‑specificity). The ROC curve and odds ratios (ORs) with 95% CIs were estimated by means of logistic regression. The differences were statistically significant for a P value of less than 0.05. Statistical analysis was performed with the SAS software (SAS Institute Inc, Cary, North Carolina, United States).
Results
The study patients presented with involvement of the following sites: upper respiratory tract, 48 patients (90.5%); lower respiratory tract, 31 patients (58.5%); kidneys, 29 patients (54.7%); osteoarticular system, 19 patients (35.8%); peripheral nervous system, 13 patients (24.5%); orbit, 10 patients (19.6%), skin, 5 patients (9.4%); central nervous system, 3 patients (5.7%); heart, 2 patients (3.8%); muscles, 2 patients (3.8%); and digestive tract, 1 patient (1.9%).
The results of the comparison between patients with GPA and CRS without divisions into subgroups are presented in Table 1. The comparison between patients with rhinological manifestation of GPA and individuals with CRS with or without polyps is presented in Table 2. In the GPA group, 36 patients presented with rhinological manifestation (68%) and 23 of those patients had a coexisting otological manifestation. Overall, 34 patients (64%) showed otological manifestation. In 5 patients (9%) orolaryngeal symptoms were found in the course of the disease. One patient was diagnosed due to orbital pseudotumor. Four patients did not present any symptoms related to the head and neck.
Parameter | GPA | CRS | P value | |||
N | Median (IQR) or n (%) | N | Median (IQR) or n (%) | |||
Abbreviations: CRS, chronic rhinosinusitis; GOS, Global Osteitis Score; GPA, granulomatosis with polyangiitis; KOS, Kennedy Osteitis Score; LMS, Lund–Mackay Score; S. aureus, Staphylococcus aureus; IQR, interquartile range | ||||||
Age, y | 53 | 45 (34–60) | 150 | 46 (35–61) | 0.93 | |
LMS, points | 53 | 3 (0–8) | 150 | 11 (8–16) | <0.001 | |
KOS | Overall | 53 | 0 (0–1) | 71 | 0 (0–0) | 0.008 |
0 points | 39 (73.6) | 65 (91.6) | ||||
≥1 points | 14 (26.4) | 6 (8.4) | ||||
GOS | Overall | 53 | 0 (0–1) | 71 | 0 (0–0) | 0.006 |
0 points | 39 (73.6) | 65 (91.6) | ||||
≥1 points | 14 (26.4) | 6 (8.4) | ||||
S. aureus (+) | 44 | 29 (65.9) | 74 | 11 (14.9) | <0.001 | |
Previous surgery | 53 | 8 (15.1) | 71 | 21 (29.6) | 0.09 | |
Parameter | GPA R(+) | CRSsP | CRSwP | P value 1 vs 2 | P value 1 vs 3 | P value 2 vs 3 | P value | ||||
N | Median 1 (IQR) or n (%) | N | Median 2 (IQR) or n (%) | N | Median 3 (IQR) or n (%) | ||||||
Abbreviations: CRSsP, chronic rhinosinusitis without polyps; CRSwP, chronic rhinosinusitis with polyps; GPA R(+), granulomatosis with polyangiitis with rhinological manifestation; others, see Table 1 | |||||||||||
Age, y | 36 | 46 (31–63) | 74 | 42.5 (31–59) | 76 | 50 (39–64) | 0.36 | 0.38 | 0.009 | 0.04 | |
LMS | 36 | 6.5 (2–11.5) | 74 | 8 (6–11) | 76 | 15 (11–18) | 0.08 | <0.001 | <0.001 | <0.001 | |
KOS | Overall | 36 | 0 (0–3) | 24 | 0 (0–0) | 47 | 0 (0–0) | 0.003 | 0.004 | 0.34 | <0.001 |
0 points | 22 (61.1) | 23 (95.8) | 42 (89.4) | ||||||||
≥1 points | 14 (38.9) | 1 (4.2) | 5 (10.6) | ||||||||
GOS | Overall | 36 | 0 (0–5) | 24 | 0 (0–0) | 47 | 0 (0–0) | 0.003 | 0.002 | 0.34 | <0.001 |
0 points | 22 (61.1) | 23 (95.8) | 42 (89.4) | ||||||||
≥1 points | 14 (38.9) | 1 (4.2) | 5 (10.6) | ||||||||
S. aureus (+) | 32 | 24 (75) | 47 | 3 (6.4) | 27 | 8 (29.6) | <0.001 | 0.001 | 0.01 | <0.001 | |
Previous surgery | 36 | 8 (22) | 24 | 4 (16.7) | 47 | 17 (36.2) | 0.75 | 0.23 | 0.11 | 0.18 | |
In the study group (GPA), the LMS ranged from 0 to 20 points, with a median (IQR) of 3 (0–8) points for the whole group (Table 1). Computed tomography scans showed mucosal changes in the sinuses of 35 patients with GPA (66%). Among R(+) patients, the median (IQR) value of LMS was 6.5 (2–11.5) points (Table 2). The sinus involvement was as follows:
-
maxillary sinus: 29 patients (80.6% of the R(+) subgroup / 64.2% of all GPA patients);
-
anterior ethmoidal cells: 22 (58.3%/41.5%, respectively);
-
sphenoid sinus: 19 (52.8%/35.9%, respectively);
-
frontal sinus: 19 (52.8%/35.9%, respectively);
-
posterior ethmoidal cells: 15 (41.7%/28.3%, respectively).
Neoosteogenesis in GPA patients was evaluated with 2 scoring systems addressed to osteitis in paranasal sinuses.16 It was observed in 17 cases (32.1% of the study group) (Table 3). The Kennedy Osteitis Score (0–20) was positive in 14 cases (26.4% of the study group, 39% of the R[+] subgroup), with the results ranging from 1 to 14 points. Patients with a score of 0 points contstituted 73.6% of the GPA group. The Global Osteitis Score was also positive in 14 patients and the results ranged between 1 and 22 points (Table 1 and Table 2). The sinus involvement was as follows:
Study | Sinus opacification | Neoosteogenesis | Bone destruction | Septal perforation | Nasal strands |
Data are presented as percentages. | |||||
Lloyd et al18; 2002 (n = 28) | 85.7 | 50 | 75 | – | – |
Lohrmann et al19; 2006 (n = 28) | 75 | 21 | 57 | – | – |
Grindler et al20; 2009 (n = 74) | 90.5 | 78 | 62 | 35.1 | – |
Życińska et al21; 2016 (n = 43) | 78 | 9 | 32 | 21 | – |
Present study (whole study group, n = 53) | 66 | 32.1 | 26.4 | 35.8 | 68 |
Present study (rhinological manifestation, n = 36) | 83.3 | 47.2 | 38.8 | 52.8 | 78 |
-
maxillary sinus: 12 patients (33% of the R[+] subgroup / 22.5% of all patients with GPA);
-
sphenoid sinus: 6 (17%/11%, respectively);
-
posterior ethmoidal cells: 4 (11%/7.5%, respectively); and
-
anterior ethmoidal cells: 2 (5.5%/4%, respectively).
Neoosteogenesis was rarely observed in the early stages of the disease (2 out of 12 newly diagnosed patients), and the highest incidence was observed in the third and fourth years of the disease.
Bone damage was noted in 14 patients (26.4% of the study group, 38.9% of the R[+] subgroup) and affected the nasal bones, nasal bony septum, nasal turbinates, or lateral nasal wall. Septal perforation (cartilaginous or mixed bony and cartilaginous) was present in 19 patients (35.8% of the study group; 52.8% of the R[+] subgroup) and in 11 cases it coexisted with neoosteogenesis in the sinuses. External nose deformity was present in 16 patients (14 women and 2 men); 12 of those patients had also developed septal perforation (cartilaginous or bony), whereas 4 had not.
Patients with LMS exceeding 10 points (13 patients) presented with higher incidence of neoosteogenesis (11 patients) and septal perforation (11 patients). Three out of 8 patients who had been previously operated on (all from the R[+] subgroup) were either KOS- or GOS‑positive. The differences regarding the history of previous surgery between patients with GPA and CRS were not significant (Table 1 and Table 2).
Staphylococcus aureus was cultured in nasal swabs of 29 patients with GPA (65.9%; n = 44) (Table 1), including 24 patients from the R(+) subgroup (75%) (Table 2). Patients with GPA had a greater risk of S. aureus nasal carriage than patients with CRS (OR, 11.07; 95% CI, 4.53–27.06; P <0.001). Most commonly, S. aureus was present in patients with either septal perforation (15 patients) or neoosteogenesis (14 patients). Based on that, risk for septal perforation co‑occurring with S. aureus was established to be 6 times as high as for septal perforation alone (OR, 6.07; 95% CI, 1.16–31.82; P = 0.045). Odds ratio for the coexistence of neoosteogenesis and S. aureus was insignificant.
Among all patients with GPA, 24 (46.2%) were PR3‑ANCA positive (including 16 patients [45.7%] in the R[+] subgroup). In a single case data were unavailable. The disease was active in 28 patients (52.8%) and 25 (47.2%) were in remission. Among individuals with rhinological manifestation, an active phase was detected in 22 cases (61.1%). MPO‑ANCA was found in 4% of patients with GPA (3% of the R[+] subgroup).
The analysis of CT scans also confirmed the presence of NSs, which were found between 2 sites in the nasal cavity, frequently on the opposite sides of the cavity. They were either straight or irregular in shape (Figure 1). In patients with GPA, at least a single NS was found in 36 patients (67.9% of the study group), including 28 patients with rhinological manifestation of GPA (77.8%). In the R(–) subgroup, NSs were observed in 8 patients (47%). A total of 71 CT scans of patients with CRS were assessed for the presence of NSs. The results of the comparison between the GPA and CRS groups are presented in Table 4 and the multiple comparisons between subgroups of patients with GPA R(+), CRSsP, and CRSwP are presented in Table 5.
NSs, n | GPA (n = 53) | CRS (n = 71) | P value |
Data are presented as percentages.
Abbreviations: NSs, nasal strands; others, see Table 1 | |||
0–1 | 32.08 | 70.42 | <0.001 |
2–4 | 28.3 | 25.35 | 0.84 |
≥5 | 39.62 | 4.2 | <0.001 |
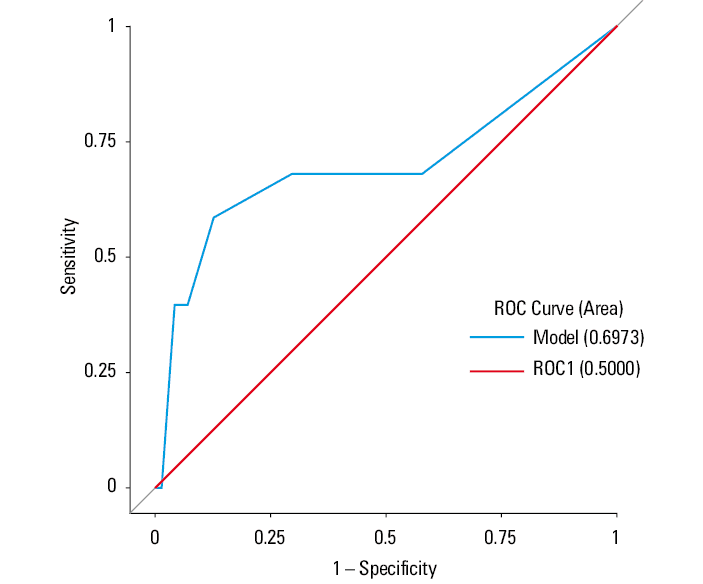
In patients with GPA, NSs were correlated with LMS, KOS, GOS, and duration of the disease. A negative Spearman correlation coefficient (ρ = –0.26)(P = 0.07) was established for the association between duration of the disease and the presence of NSs. The associations between PR3‑ANCA (n = 52) / phase of the disease (n = 53) and NSs were evaluated with the Fisher test; the results are presented in Table 6. A higher number of NSs (≥5) on CT was significantly more common among patients with PR3‑ANCAs than in those without the antibodies (P = 0.046). The associations between NSs and phase of the disease were not significant. Of 29 patients with S. aureus–positive cultures, 13 (44.8%) were found to have 5 or more NSs (P = 0.53) (Table 6). The sensitivity and specificity of the higher number of NSs (≥5) on CT were 39.6% and 95.8%, respectively. In the present study, the positive predictive value of this marker was 87.5% while the negative predictive value was 68%. A receiver operating characteristic (ROC) curve was generated to show how much the NSs are useful in terms of distinguishing between GPA and CRS (Figure 2).
NSs <5 | NSs ≥5 | Total | P value | |
Data are presented as number (percentage).
| ||||
PR3‑ANCA | ||||
(–) | 21 (75) | 7 (25) | 28 | 0.046 |
(+) | 11 (45.8) | 13 (54.2) | 24 | |
Total | 32 | 20 | 52 | |
Phase of disease | ||||
Remission | 17 (68) | 8 (32) | 25 | 0.4 |
Active | 15 (53.6) | 13 (46.4) | 28 | |
Total | 32 | 21 | 53 | |
S. aureus | ||||
(–) | 10 (66.7) | 5 (33.3) | 15 | 0.53 |
(+) | 16 (55.2) | 13 (44.8) | 29 | |
Total | 26 | 18 | 44 | |
Discussion
Study patients with GPA showed a higher prevalence of ENT involvement than described in the POLVAS registry (90.5% vs 75.5%, respectively). The rate of involvement of other organs was lower compared with the registry, except for neurological involvement (peripheral nervous system), which was found in 24.5% and 18% of cases, respectively.3
Radiological features of GPA have already been described as mucosal thickening, bone destruction, septal erosion, neoosteogenesis, orbital involvement, and bone obliteration.17 In this study, mucosal thickening was evaluated with LMS, originally developed for patients with rhinosinusitis. Positive results were observed in 35 patients (66%). In their systematic review of sinonasal lesions in GPA, Danza et al17 found mucosal thickening in sinuses in 87.7% patients. In the present study, taking into consideration only the patients with rhinological manifestation of GPA, the prevalence of mucosal thickening amounted to 83.3%. Thus, any discrepancies between the results may be explained by patient selection bias, as patients with GPA included in studies usually present to the ENT specialist with a certain manifestation of the disease. Our study included GPA patients diagnosed not only in ENT departments but also in a Department of Family Medicine, Internal, and Metabolic Diseases. A comparison of literature data on LMS and sinus opacification in studies exceeding 20 patients with GPA is presented in Table 3.18-21 Benoudiba et al22 analyzed mucosal thickening together with nodular lesions of the mucosa based on their observations in only 9 patients with GPA. We found that nodular lesions are more typical of another autoimmune disease—sarcoidosis. Makary et al23 described 53 patients with different autoimmune diseases and compared their sinus lesions with those of patients with CRS.23 They found no significant differences in CT scores between the groups but the autoimmune study group only included 8 patients. In the present analysis, the comparison between patients with GPA and CRS showed that LMS in the GPA group was significantly lower: median (IQR), 3 (0–8) vs 11 (8–16) (P <0.001) (Table 1). In the multiple comparison of the GPA R(+), CRSsP, and CRSwP subgroups, the difference was also significant (P <0.001), but it was not so for the comparison between the GPA R(+) and CRSsP subgroups (P = 0.08)(Table 2).
Bony and / or cartilaginous damage in our study was observed in 20 patients, 19 of which had septal perforation, either cartilaginous (8 cases) or bony / cartilaginous (11 cases). D’Anza et al17 found bony destruction in 59.9% of GPA patients. In our study, the result was similar (55.5% of the R[+] subgroup); however, the prevalence was lower in the total group of GPA patients due to the aforementioned patient selection bias.
Neoosteogenesis in our study affected 17 patients (47.2% of the R[+] patients), while D’Anza et al17 reported a rate of 56.1%. We did not analyze obliteration of sinuses separately, as it was evaluated with GOS as part of the neoosteogenesis process. Neoosteogenesis scores based on KOS and GOS were significantly higher in patients with GPA than those with CRS, whether with or without polyps (Table 1 and Table 2). Holme et al24 described changes in CT findings with the duration of the disease—23% of patients with GPA had significant osteitis, defined as GOS of 5 points or more, in the first year of the disease. This proportion increased to 40% at the last CT, performed more than 12 months from the first one.24 Similarly, in our study patients in the early stages of GPA had fewer lesions than those who had had the disease for a longer time, whereas in the entire group of patients with GPA the rate of neoosteogenesis reached 32.1%.
The analysis of external nose deformities revealed that 4 patients with a saddle nose deformity did not have septal perforation. The majority of patients with an external nose deformity were female (female‑to‑male ratio, 14:2), which allowed us to conclude that GPA had a higher burden of nasal deformity in women, but the deformity was not always accompanied by septal perforation.
Staphylococcus aureus carriage was found to be 11 times higher in patients GPA than those with CRS (P <0.001). In the former group, S. aureus carriage was also associated with septal perforation.
Cannady et al25 examined 120 patients with GPA and found that 89% of them exhibited sinonasal lesions, including nasal crusting (69%), chronic rhinosinusitis (61%), nasal obstruction (58%), bloody nasal discharge (52%), septal perforation (33%), saddle‑nose deformity (23%), epiphora (13%), and mucocele formation (3.3%). Crusting in patients with GPA goes along with tissue loss following vasculitis and necrosis. Given that crusting is one of the most frequently described types of lesions in the examination of nasal cavities in GPA patients and that crust removal usually requires aspiration with endoscopic procedures, our study also aimed to analyze the CT scans in terms of crusting in the nasal cavities. Measuring the crust on CT scans is difficult as it is hard to differentiate it from mucosal tissues. Thus, we analyzed narrow strands forming between the opposite sides of the nasal cavity, which were frequently irregular in shape (Figure 1). Dryness and crusting may be present in the nasal vestibule up to the nasal valve in different conditions in patients without septal perforation and rarely occur in the nasal cavity behind the nasal valve. Thus, the nasal vestibule and nasal valve areas were excluded from the analysis. Nasal strands were found in 77.8% of patients with rhinological manifestation of the disease (67.9% of all patients with GPA). Of note, they were also present in 35% of patients without rhinological symptoms of vasculitis; the patients in the GPA R(–) subgroup presenting with strands on CT scans did not complain of any rhinological symptoms. A comparison between patients with GPA and CRS in terms of NSs revealed that a finding of 5 or more strands on a CT scan was significantly more common in GPA than in CRS (P <0.001), while 2 to 4 strands were found in both groups (more often in CRSwP than CRSsP). The presence of none or 1 strand was significantly more common in the CRS group (P <0.001). This analysis showed that a finding of 5 or more NSs on a CT scan can be a valuable predictive factor for GPA.
Interestingly, the presence of 5 or more NSs was positively correlated with PR3‑ANCA–positive results (P = 0.046) but not during the active phase of the disease (P = 0.34). Such divergence may be explained by the fact that patients with decreasing, but still positive, PR3‑ANCA titers are commonly identified as in remission.
The analysis of NSs revealed that they are highly specific for GPA, especially when there are 5 or more of them, but it is possible to find them in other autoimmune diseases leading to tissue necrosis in nasal cavities (eg, sarcoidosis). A negative Spearman correlation coefficient (ρ = –0.26)(P = 0.07) for the association between duration of the disease and NSs could relate to treatment efficacy and decrease in tissue loss in time; however, the association between these 2 parameters did not meet the criteria for statistical significance. The sensitivity and specificity of a higher number of NSs (≥5) on CT were 39.6% and 95.8%, respectively. The reason for quite a low sensitivity could probably be the characteristics of the study group, which included patients with both rhinological and nonrhinological manifestations of the disease. If the analysis included only R(+) patients (n = 36), the sensitivity of the marker would increase to 52.8%. Similarly, the ROC curve would approach 1 (a better measure of separability) in this scenario.
The aim to compare rhinosinusitis with GPA was due to the overlapping symptoms of the 2 entities and a high prevalence of upper airway involvement in GPA. The presented analysis and comparison attempted at finding a way to differentiate between patients with rhinosinusitis and GPA, which is often difficult for both ENT and internal medicine spacialist. Localized nasal involvement of GPA tends to be misdiagnosed in its early stages as rhinosinusitis, which leads to a delay in diagnosis of even up to 5 months. This difficulty is enhanced by the fact that intermittent steroid therapy in patients with CRS (usually intranasal but sometimes systemic steroid therapy) blurs the picture of the disease.
The limitations of this study were the diversity in the stage of the disease at the time of CT examination (the duration of the disease ranged from 0 to 24 years) and different treatment regimens. Some study patients were examined due to inflammatory disease in the upper airways and were finally diagnosed with GPA, others were referred to an otorhinolaryngologist for a routine examination of any signs of relapse in the upper respiratory tract. These limitations apply to all the lesions previously described in GPA, such as sinus opacification, neoosteogenesis, and perforation of the nasal septum. Nevertheless, by determinig the presence of PR3‑ANCA we were able to disclose an important feature of the disease, which is correlated with intranasal lesions. Of note, PR3‑ANCAs were assessed in 52 patients with 24 positive results.
In summary, the analysis of CT scans in patients with GPA revealed the following abnormalities (according to the frequency of occurrence):
-
nasal strands in the nasal cavities: 68% of the whole GPA group / 78% of the GPA R(+) subgroup;
-
mucosal thickening: 66%/83.3%, respectively;
-
cartilaginous or bony damage: 37.7%/55.5%, respectively; and
-
neoosteogenesis: 32.1%/47.2%, respectively.
A comparison between the GPA and CRS groups showed that LMS was significantly lower, while KOS and GOS were significantly higher in patients with GPA than those with CRS. Staphylococcus aureus carriage was higher among patients with GPA and it was also more often found in individuals with septal perforation. The presence of NSs on a CT scan can be a factor helping to differentiate patients with GPA from those with CRS. As a parameter reflecting pathologic mucus and possible atrophic changes (tissue loss), NSs should be included along with mucosal thickening, bone damage, and neoosteogenesis as part of the CT evaluation of the nasal cavities in patients with either a suspicion of GPA or in the course of the disease.
- Csernok E, Gross WL. Current understanding of the pathogenesis of granulomatosis with polyangiitis (Wegener’s). Expert Rev Clin Immunol. 2013; 9: 641‑648. | Crossref
- Mohammad AJ, Jacobsson LT, Westman KW, et al. Incidence and survival rates in Wegener’s granulomatosis, microscopic polyangiitis, Churg‑Strauss syndrome and polyarteritis nodosa. Rheumatology. 2009; 48: 1560‑1565. | Crossref
- Wojcik K, Wawrzycka‑Adamczyk K, Wludarczyk A, et al. Clinical characteristics of Polish patients with ANCA‑associated vasculitides – retrospective analysis of POLVAS registry. Clin Rheumatol. 2019; 38: 2553‑2563. | Crossref
- Leavitt RY, Fauci AS, Bloch DA, et al. The American College of Rheumatology 1990 criteria for the classification of Wegener’s granulomatosis. Arthritis Rheum. 1990; 33: 1101‑1107. | Crossref
- Jennette JC, Falk RJ, Bacon PA, et al. 2012 revised International Chapel Hill Consensus Conference Nomenclature of Vasculitides. Arthritis Rheum. 2013; 65: 1‑11. | Crossref
ARTICLE INFORMATION