Does weight loss after laparoscopic sleeve gastrectomy contribute to reduction in blood pressure?
Key words: bariatric surgery, hypertension, obesity, sleeve gastrectomy


 CC BY-NC-SA 4.0
Does weight loss after laparoscopic sleeve gastrectomy contribute to reduction in blood pressure?
Introduction: Obesity‑related hypertension is a life‑threatening medical condition that significantly increases the risk of cardiovascular diseases and premature mortality. Effective treatment of obesity may be achieved by laparoscopic sleeve gastrectomy (LSG). This surgical method contributes not only to sustained weight loss but also to normalization of blood pressure.
Objectives: To evaluate the effect of weight loss after LSG on partial or full control of blood pressure.
Patients and methods: A retrospective analysis of medical and clinical data of 305 patients who had undergone LSG was performed. The bariatric effect of LSG was assessed by calculating percentage of total weight loss (%TWL), percentage of excess weight loss (%EWL), and percentage of excess BMI loss (%EBMIL). Blood pressure status after surgery was categorized as partial or full hypertension resolution.
Results: A total of 143 patients (46.9%) were diagnosed with hypertension preoperatively with median (IQR) hypertension duration of 7.52 (1.88–13.16) years. Hypertensive patients were older (49 vs 38.5 years) and had higher prevalence of coexisting diseases (type 2 diabetes, dyslipidemia, and obstructive sleep apnea) than patients with normal blood pressure. During 1‑year follow‑up, 90 patients (63%) used lower doses of antihypertensive medications and 33 patients (23%) discontinued the therapy. Twelve months after the surgery, median (IQR) %TWL in the control group was 32.5% (28.1%–37.7%), while in the hypertensive group, 29.1% (25.9%–33.6%) (P <0.001); %EWL was 62.9% (53%–74.6%) and 54.8% (47.4%–68.2%), respectively (P = 0.001), and %EBMIL 73.9% (59.5%–91.2%) and 63% (55%–80.5%), respectively (P = 0.002).
Conclusions: Laparoscopic sleeve gastrectomy is an effective method for the treatment of obesity‑related hypertension. However, weight loss induced by LSG does not affect the blood pressure status after the surgery.
What's new?
Obesity has rapidly became an emerging health issue worldwide and is a major risk factor for cardiovascular diseases. The need to effectively fight against obesity has led to the rapid development of metabolic / bariatric surgery. Laparoscopic sleeve gastrectomy (LSG), being one of the most effective surgical methods, results in long‑term weight loss and resolution of obesity‑related diseases such as hypertension. This study was performed to evaluate the impact of LSG on total or partial control of blood pressure. The current study shows that weight loss induced by LSG does not contribute to the treatment of hypertension. This finding may serve as a benchmark for future studies to evaluate the exact mechanism of hypertension resolution after LSG.
Introduction
The incidence of obesity worldwide has been constantly rising and reached the size of a global pandemic with almost 2 billion adults considered overweight or obese.1 In Poland, abdominal obesity is observed in every third man and every second woman.2 A significant percentage of obese people in the general population and insufficient effect of conservative treatment has led to the development of bariatric surgery. Among all bariatric procedures, laparoscopic sleeve gastrectomy (LSG) is considered to be one of the most effective methods that promote long‑term weight loss and improvement or resolution of obesity‑related diseases such as hypertension, type 2 diabetes mellitus, and hypercholesterolemia.3-5 Laparoscopic sleeve gastrectomy is recently the most common bariatric procedure worldwide and is highly recommended by the experts as the first‑choice standalone procedure for patients who are considered high risk: kidney and liver transplant candidates, morbidly obese patients with metabolic syndrome, patients with a BMI of 30 to 35 kg/m2 with comorbidities; patients with inflammatory bowel disease, and elderly morbidly obese patients.6 The pathophysiologic mechanism leading to hypertension in obese patients is complex and includes overactivation of the sympathetic nervous system (SNS), stimulation of the renin–angiotensin–aldosterone system (RAAS), insulin resistance, and alterations in adipose‑derived cytokines such as adiponectin and leptin.7,8 Available studies demonstrate that weight loss results in a decline in activity of the RAAS and the SNS, which may have a significant effect on reducing blood pressure.9,10 Reduction in body mass also results in elimination of the adipose tissue‑related source of hypertension. Additionally, surgically‑induced weight loss combined with better control of blood pressure decrease the rate of cardiac events and premature death.
The objective of this study was to determine the efficacy of LSG for decreasing blood pressure to target levels in morbidly obese patients.
Patients and methods
This is a retrospective cohort study of consecutive adult patients between 18 and 65 years old who underwent LSG as a single‑stage procedure between January 2014 and December 2018 at the University Hospital in Białystok. All patients were qualified for surgical treatment of morbid obesity according to the European Guidelines on Metabolic and Bariatric Surgery.11 Inclusion criteria regarded inability to achieve sustained weight loss with conservative management and BMI of 40 kg/m2 or greater, or 35 to 40 kg/m2 with the presence of obesity‑related comorbidities such as type 2 diabetes mellitus, hypertension, obstructive sleep apnea, nonalcoholic fatty liver disease and steatohepatitis, hyperlipidemia, depression, and others. The surgical procedure was performed by the same surgeon with 2 alternating assistants. Patients were excluded from the study when perioperative complications occurred and if data were missing.
Data collection
Demographic and clinical data were gathered prospectively along with repeated measurements of selected laboratory parameters. The preoperative measurements included fasting glucose and insulin concentrations, glycated hemoglobin level, alanine aminotransferase, aspartate aminotransferase, total cholesterol and its fractions, triglycerides, and C‑reactive protein. Bariatric effect was assessed using following equations:
1 Percent of total weight loss (%TWL):
2 Percent excess BMI loss (%EBMIL):
3 Percent excess weight loss (%EWL):
while an ideal weight is defined by the weight corresponding to the BMI of 25 kg/m2.
Homeostatic model assessment of insulin resistance index (HOMA‑IR) was performed using the following formula:
where a result greater than 2.6 confirmed insulin resistance.
The hypertensive status of the patients and bariatric effect were assessed during follow‑up visits that were scheduled 1, 3, 6, and 12 months postoperatively.
Patients were considered hypertensive when the blood pressure was greater than 140/90 mm Hg or if they were receiving antihypertensive medications. The diagnosis of arterial hypertension was made according to the guidelines of the Polish Society of Hypertension.12 Any adjustments in antihypertensive therapy during follow‑up were made by primary care providers. Data about any changes in medications were assessed during the follow‑up visits at a surgical outpatient clinic based on medical interview. Partial control of blood pressure was defined as a reduction in the dose of the antihypertensive drugs, while total control of blood pressure was defined as a blood pressure of less than 140/90 mm Hg in combination with no antihypertensive therapy.
All patients were informed about the risk of the surgical procedure and written informed consent was obtained from every participants prior to the surgery. The study was approved by the Bioethical Committee of the Medical University (no. R‑I‑002/248/2018).
Statistical analysis
Data were analyzed using the GraphPad Prism 8.0 software (GraphPad Software Inc, La Jolla, California, United States). The normality of variables distribution was assessed with the Shapiro–Wilk test. The variables had non‑Gaussian distribution and were analyzed using the Kruskal–Wallis test with the Dunn multiple comparisons post‑hoc test due to missing data in some patients. The differences between the control group and the hypertensive group in a particular follow‑up were analyzed with the Mann–Whitney test. Continuous values were presented as medians with interquartile ranges (IQRs). Qualitative data on hypertension and the effect of bariatric surgery on a modification of its treatment were analyzed using the Pearson χ2 test. A P value of less than 0.05 was considered statistically significant.
Results
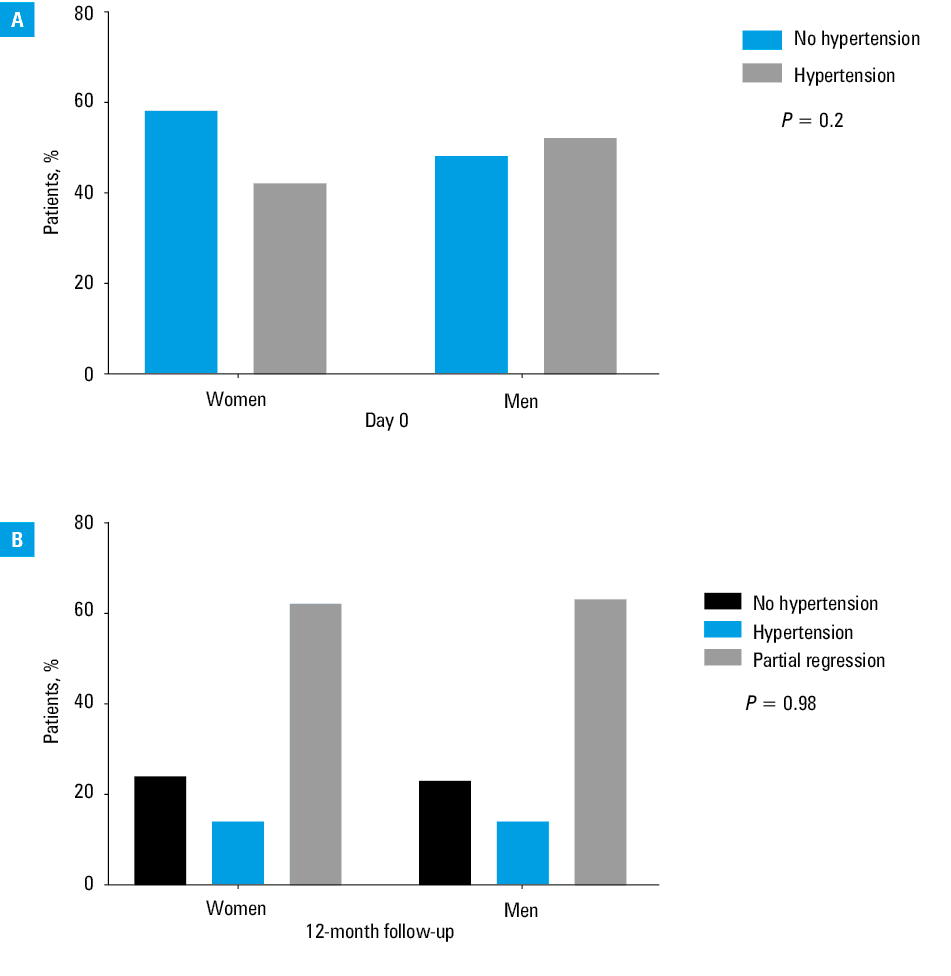
The study group included 305 patients: 131 men (43%) and 174 women (57%), at the median (IQR) age of 43 (37–54) years. The median (IQR) preoperative BMI was 45 (41.4–49.4) kg/m2. A total of 143 patients (46.9%) were diagnosed with hypertension preoperatively. All patients who were diagnosed with hypertension prior to the surgery received antihypertensive therapy. The most frequently administered drugs were: angiotensin converting enzyme inhibitors, angiotensin II receptor blockers, diuretics, calcium channel blockers, and α-blockers. The median (IQR) duration of hypertension was 7.52 (1.88–13.16) years. The most common comorbidities beside hypertension were: type 2 diabetes mellitus (63 patients), obstructive sleep apnea (56 patients), and dyslipidemia (96 patients). The repeated measurements of selected laboratory parameters in all patients at baseline as well as during follow‑up visits are presented in Table 1, while Table 2 presents laboratory data in 12‑month follow‑up between the hypertensive group and the control group. Hypertensive patients were older (49 vs 38.5 years) and had higher prevalence of type 2 diabetes, dyslipidemia, and obstructive sleep apnea than patients with normal blood pressure. The distribution of hypertension between women and men at baseline and during 12‑month follow‑up is presented in Figure 1. There were no significant differences between women and men in the treatment of hypertension after LSG.
Variable | Baseline (n = 305) | 1 month (n = 305) | 3 months (n = 285) | 6 months (n = 273) | 12 months (n = 278) | P value |
Data are presented as median (interquartile range).
Abbreviations: ALT, alanine transaminase; AST, aspartate transaminase; BMI, body mass index; CRP, C‑reactive protein; %EBMIL, percentage of excess BMI loss; %EWL, percentage of excess weight loss; FPG, fasting plasma glucose; HbA1c, glycated hemoglobin; HDL, high‑density lipoprotein; HOMA‑IR, homeostatic model assessment of insulin resistance index; LDL, low‑density lipoprotein; NA, not applicable; %TWL, percentage of total weight loss | ||||||
BMI, kg/m2 | 45 (41.4–49.4) | 40.3 (37.2–44.9) | 36.1 (32.9–40.5) | 33 (29.8–36.9) | 31 (27.1–35.2) | <0.001 |
%TWL | NA | 9.8 (8.2–11.9) | 19.3 (16.5–22.3) | 26.5 (22.7–30) | 31.2 (27.2–35.7) | <0.001 |
%EWL | NA | 19.2 (15.3–23.6) | 37.0 (30.6–44.3) | 50.1 (41.6–59.8) | 59.6 (49.5–71.1) | <0.001 |
%EBMIL | NA | 22.8 (17.8–28.1) | 43.5 (35.1–53.1) | 59.1 (46.5–72.6) | 70.1 (57.1–86.7) | <0.001 |
CRP, mg/l | 6.8 (3.6–9.8) | 3.4 (2.2–8.1) | 4.4 (2–8.7) | 3.2 (1.2–8.2) | 1.8 (0.8–4.9) | <0.001 |
FPG, mg/dl | 106 (97–120) | 101 (92–112) | 98 (90–106) | 98 (90–106) | 95 (89–101) | <0.001 |
Insulin, mIU/l | 21.5 (13.4–30.3) | 11 (7.8–13.9) | 10.4 (7.1–13.9) | 8.3 (5.3–14.3) | 8.2 (6.1–10.9) | <0.001 |
HOMA‑IR | 5.4 (3.4–8.6) | 2.9 (1.9–3.8) | 2.5 (1.6–3.5) | 2 (1.2–3.6) | 1.8 (1.3–2.6) | <0.001 |
HbA1c, % | 5.7 (5.3–6.3) | 5.5 (5.2–6) | 5.3 (5–5.7) | 5.3 (5–5.7) | 5.3 (5–5.6) | <0.001 |
ALT, IU/l | 35.1 (24–55.2) | 35 (24–48) | 23.1 (18–33) | 19 (13.1–25.9) | 20 (15–26) | <0.001 |
AST, IU/l | 26 (19.7–43.5) | 27 (21–36) | 22 (16.8–29) | 19 (15.4–25) | 20 (16–25) | <0.001 |
Total cholesterol, mg/dl | 205 (175–234) | 170 (148–191) | 176 (154.5–199) | 192 (165–219) | 179 (156–208) | <0.001 |
LDL cholesterol, mg/dl | 141.7 (112–172) | 111.9 (94–133) | 117 (94–138) | 128 (102–151) | 119 (98.1–142.2) | <0.001 |
HDL cholesterol, mg/dl | 47.5 (39–60) | 36 (31–42) | 44 (36–50) | 51 (41–61) | 57 (47–66) | <0.001 |
Triglycerides, mg/dl | 156.5 (113.5–199) | 127 (101–161) | 114 (89–145) | 98 (77–134) | 93 (70.7–125.3) | <0.001 |
Parameter | Group | Baseline (n = 305) | 1 month (n = 305) | 3 months (n = 285) | 6 months (n = 273) | 12 months (n = 278) | P value |
Data are presented as median (interquartile range).
a P value for controls vs patients with hypertension
Abbreviations: see Table 1 | |||||||
CRP, mg/l | Control | 6.8 (3.6–10.5) | 3.7 (2.2–8.2) | 4.2 (2–10.4) | 3.2 (1.2–8.4) | 2.3 (0.7–6.5) | <0.001 |
Hypertensive | 6.4 (3.7–9.5) | 4.1 (1.8–8.1) | 4.4 (1.9–8.2) | 3.5 (1.7–8.2) | 1.6 (0.8–4.1) | <0.001 | |
P valuea | 0.39 | 0.87 | 0.72 | 0.70 | 0.28 | – | |
FPG, mg/dl | Control | 105 (96–119.5) | 101 (91–108) | 95 (88–105) | 97.5 (90–106) | 93 (87–100) | <0.001 |
Hypertensive | 107 (97.3–120) | 104.5 (95–116.5) | 100 (92–107) | 98.5 (90.3–107.5) | 98 (90–104) | <0.001 | |
P valuea | 0.4 | 0.013 | 0.026 | 0.52 | 0.006 | – | |
Insulin, mIU/l | Control | 21.7 (14.5–30.9) | 11 (7.5–14.5) | 9.5 (6.6–13.8) | 8.5 (5.6–14.2) | 8.5 (6.4–11.3) | <0.001 |
Hypertensive | 19.9 (12.7–30.3) | 10.9 (7.9–13.6) | 10.9 (7.3–14.2) | 7 (4.9–15.1) | 7.9 (6–10.7) | <0.001 | |
P valuea | 0.93 | 0.93 | 0.55 | 0.93 | 0.93 | – | |
HOMA‑IR | Control | 5.5 (3.4–8.5) | 2.7 (1.8–3.6) | 2.3 (1.5–3.3) | 2 (1.2–3.6) | 1.8 (1.4–2.6) | <0.001 |
Hypertensive | 5.1 (3.2–8.7) | 3.1 (2.1–4.1) | 2.7 (1.7–3.7) | 1.4 (1.1–3.9) | 1.7 (1.2–2.6) | <0.001 | |
P valuea | 0.92 | 0.99 | 0.99 | 0.99 | 0.99 | – | |
HbA1c, % | Control | 5.6 (5.3–6.1) | 5.5 (5.2–5.9) | 5.3 (5–5.7) | 5.3 (5–5.7) | 5.3 (5–5.7) | <0.001 |
Hypertensie | 5.7 (5.3–6.4) | 5.5 (5.2–6) | 5.4 (5.1–5.7) | 5.3 (5–5.7) | 5.3 (5–5.6) | <0.001 | |
P valuea | 0.31 | 0.82 | 0.45 | 0.55 | 0.79 | – | |
ALT, IU/l | Control | 36 (24.9–55.2) | 35.6 (24–47.7) | 22.5 (17–32.6) | 19.3 (13.3–25.9) | 20 (15.8–26.4) | <0.001 |
Hypertensive | 32.9 (22.6–56.8) | 34.7 (24–49) | 24 (18.2–34.7) | 19 (13–26) | 20 (14.7–26) | <0.001 | |
P valuea | 0.68 | 0.88 | 0.14 | 0.83 | 0.65 | – | |
AST, IU/l | Control | 26.4 (20–46.7) | 26.8 (20.8–35.7) | 22 (16–28) | 18.4 (15.2–25) | 20 (16–25) | <0.001 |
Hypertensive | 25.5 (19–40) | 27 (21–36.7) | 22 (17.9–30.5) | 20 (16.2–24.9) | 20.4 (16.2–25.1) | <0.001 | |
P valuea | 0.63 | 0.63 | 0.14 | 0.35 | 0.48 | – | |
Total cholesterol, mg/dl | Control | 212 (179–234.8) | 171 (152–190) | 176.5 (157–202.3) | 195 (165.8–222) | 177 (162–208) | <0.001 |
Hypertensive | 202 (171–234) | 166.5 (146–192.3) | 176 (151–198) | 189 (163–215) | 182.5 (154.5–209.8) | <0.001 | |
P valuea | 0.47 | 0.5 | 0.17 | 0.47 | 0.87 | – | |
LDL cholesterol, mg/dl | Control | 145 (113–173) | 114 (96–131.3) | 120 (94–143.2) | 132.5 (105–151) | 119 (93.3–138.7) | <0.001 |
Hypertensive | 137.7 (109–170.5) | 106.5 (91–135.5) | 115 (93–134) | 123 (100–151) | 120 (101–145) | <0.001 | |
P valuea | 0.25 | 0.47 | 0.28 | 0.18 | 0.63 | – | |
HDL cholesterol, mg/dl | Control | 47 (39–58) | 37 (32–42) | 43 (37–48) | 51 (42–59.2) | 56 (47–64.9) | <0.001 |
Hypertensive | 49 (38–62.5) | 35 (30–41.2) | 44 (36–51) | 50.3 (41–62.5) | 58.2 (47.1–67) | <0.001 | |
P valuea | 0.49 | 0.11 | 0.44 | 0.8 | 0.33 | – | |
Triglycerides, mg/dl | Controls | 157.5 (114.3–202.8) | 131 (101.5–165) | 122.5 (92.7–147.8) | 98.5 (77–145) | 96 (74–126) | <0.001 |
Hypertensive | 154.5 (112–198.3) | 123 (100.3–154) | 107 (88–140) | 98 (76.5–133) | 90 (69–125) | <0.001 | |
P valuea | 0.7 | 0.27 | 0.04 | 0.63 | 0.24 | – | |
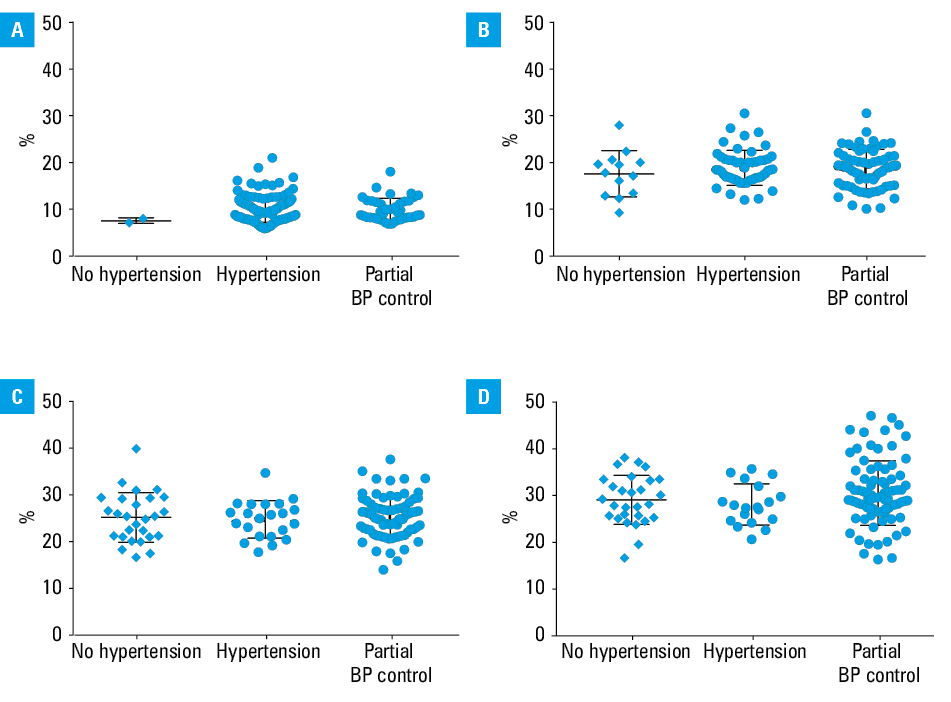
During follow‑up, the median (IQR) BMI in the study group decreased from 45 (41.4–49.4) kg/m2 preoperatively to 31 (27.1–35.2) kg/m2 1 year after the surgery (P <0.001). The median (IQR) %TWL 12 months after LSG reached 31.2% (27.2%–35.7%) (P <0.001), the median (IQR) percentage of excess weight loss was 59.6% (49.5%–71.1%) (P <0.001), and the median (IQR) percentage of the excess BMI loss reached 70.1% (57.1%–86.7%) (P <0.001). Weight loss parameters in 12‑month follow‑up between the hypertensive group and the nonhypertensive group are presented in Table 3. Although all patients presented considerable weight loss after the surgical procedure, no association between total weight loss after the surgery and partial or full control of blood pressure was seen (Figure 2).
Variable | Group | Baseline (n = 305) | 1 month (n = 305) | 3 months (n = 285) | 6 months (n = 273) | 12 months (n = 278) | P value |
Data are presented as median (interquartile range).
a P value for controls vs patients with hypertension
Abbreviations: see Table 1 | |||||||
BMI, kg/m2 | Control | 44.9 (41.4–48.9) | 40 (37.1–44.4) | 35.7 (32.3–39.9) | 32.1 (29.1–36.1) | 30.1 (26.4–34.5) | <0.001 |
Hypertensive | 45.2 (41.5–49.9) | 40.8 (37.2–45.7) | 36.5 (33.5–41.4) | 34.5 (30.5–38.2) | 32.8 (28.5–35.8) | <0.001 | |
P valuea | 0.7 | 0.53 | 0.14 | 0.01 | 0.01 | – | |
%TWL | Control | N/A | 10.6 (8.3–12) | 20 (16.9–23.1) | 27.9 (23.2–31.7) | 32.5 (28.1–37.7) | <0.001 |
Hypertensive | N/A | 9.5 (8–11.8) | 18.5 (16–20.8) | 25.3 (21.5–28.2) | 29.1 (25.9–33.6) | <0.001 | |
P valuea | – | 0.14 | 0.004 | <0.001 | <0.001 | – | |
%EWL | Control | N/A | 19.8 (15.6–23.7) | 38.7 (31.2–46.1) | 54.2 (44.2–62.7) | 62.9 (53–74.6) | <0.001 |
Hypertensive | N/A | 18.4 (15.1–23.4) | 36 (28.8–42.7) | 48.7 (40.2–56.3) | 54.8 (47.4–68.2) | <0.001 | |
P valuea | – | 0.25 | 0.02 | 0.001 | 0.001 | – | |
%EBMIL | Control | N/A | 23.4 (18.1–28.6) | 46.1 (36.9–57.3) | 65.9 (50.2–75.5) | 73.9 (59.5–91.2) | <0.001 |
Hypertensive | N/A | 21.9 (17.6–27.7) | 41.7 (32.4–50.8) | 56.3 (44.4–68) | 63 (55–80.5) | <0.001 | |
P valuea | – | 0.17 | 0.02 | 0.002 | 0.002 | – | |
Abbreviations: BP, blood pressure
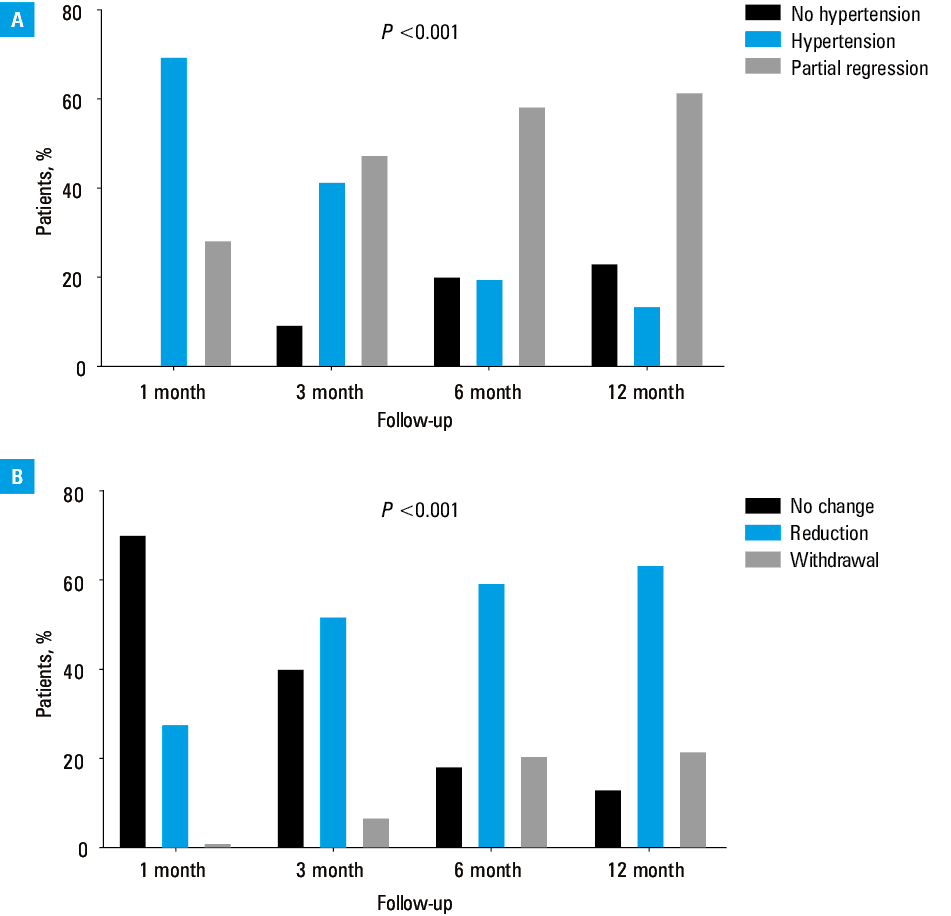
The reduction or discontinuation of antihypertensive therapy was already observed at 1 month after the surgery. During 1‑year follow‑up, 90 patients (63%) had the dosage of antihypertensive drugs reduced and 33 patients (23%) discontinued the therapy (Table 4). Changes in hypertensive status during 1‑year follow‑up are presented in Figure 3.
Blood pressure status | Baseline | 1 month | 3 months | 6 months | 12 months | P value |
Data are presented as number (percentage).
| ||||||
Hypertension | 143 | 100 (69.9) | 58 (40.6) | 27 (18.9) | 20 (14) | <0.001 |
Partial BP control | NA | 41 (28.7) | 71 (49.7) | 85 (59.4) | 90 (63) | |
Full BP control | NA | 2 (1.4) | 14 (9.8) | 31 (21.7) | 33 (23) | |
Discussion
The present data indicate that LSG significantly reduces body weight as early as 1 month after the surgical procedure in morbidly obese patients, which was seen as a significant decrease in BMI and an increase in %TWL, excess weight, and BMI loss at every point of follow‑up. During the follow‑up, an increase in the proportion of patients with partial or full control of blood pressure was also observed.
Hypertension is a serious medical condition and a primary, modifiable risk factor for cardiovascular diseases such as stroke, ischemic heart disease, and heart failure.13,14 More than 1 billion people are affected by hypertension worldwide.15 Medication therapies are commonly used to control blood pressure; however, their effects are insufficient especially in morbidly obese hypertensive patients. There is abundant evidence that bariatric procedures improve the course of type 2 diabetes mellitus; however, the impact of LSG on blood pressure has been investigated in few cohort studies.16 The rates of patients who achieved full control of blood pressure after bariatric surgery vary between 60% and 70% in 1‑year follow‑up and may reach even 90% in long‑term follow‑up.17,18 In our study, improvement of blood pressure control after LSG was observed in 86% of patients in 1‑year follow‑up. Additionally, several studies proved that the rates of patients who achieved full control of blood pressure were lower compared with other obesity‑related diseases.19,20 Flores et al21 showed a reduction in systolic and diastolic blood pressure (20 and 11 mm Hg, respectively) in 12‑month follow‑up of hypertensive patients who had undergone bariatric surgery. Kaya et al22 observed a significant decrease in systolic and diastolic pressure only 6 months after LSG. They also noticed significant reduction in heart rate as well as triglyceride and LDL cholesterol levels.
Age is an independent risk factor for hypertension, which is associated with structural changes in the arteries mainly with significant vessels stiffness.23,24 This explains higher frequency of hypertension in older obese patients. Higher preoperative BMI and other obesity‑related diseases in hypertensive patients may be explained by the duration of hypertension and coexistence of metabolic syndrome. It highlights the need to perform LSG as soon as the patient meets the procedure criteria, which is in line with the expert opinion.6
In this study, reduction or discontinuation of antihypertensive therapy was seen as early as 1 month after LSG. These results are in line with previously published studies.25,26 However, this rapid decrease in blood pressure is not consistent with weight loss following bariatric surgery. This may indicate that blood pressure control after the surgery is not directly related to weight loss after LSG.
The exact pathophysiological mechanism associated with the reduction of blood pressure after LSG in still unclear. Obesity‑related hypertension is multifactorial and may be associated with gastrointestinal hormones, such as leptin and ghrelin. The removal of gastric fundus cells also results in an increase in glucose‑like peptide 1 and peptide YY levels.27 This changes may play a significant role in hypertension in obese patients due to diuretic and natriuretic effect of glucose‑like peptide 1 and peptide YY on the kidney.28,29 Moreover, leptin secretion from adipose tissue stimulates the SNS, that activates systemic and local RAAS. Therefore, a decrease in leptin secretion could be responsible for control of obesity‑related high blood pressure.30,31 Additionally, bariatric surgery promotes decrease in inflammatory response, which together with an amelioration in insulin resistance may decrease arterial stiffness and reduce sodium reabsorption. These changes lead to better control of blood pressure after a bariatric procedure.32 Briones et al33 also showed that adipocytes may produce aldosterone through calcineurin‑dependent signaling pathways. Adipocyte‑derived aldosterone is significantly higher in metabolic syndrome related to obesity which additionally contributes to vascular dysfunction. Furthermore, dietary changes after LSG such as reduced salt and food intake and recovery of endothelial functions also play an important role in reducing blood pressure.34
Our study has several limitation. First of all, it was conducted in a single bariatric center and there was no control group. Another limitation may be a short period of observation which was continued only for 12 months. The strong point of our study is the considerable cohort size and the fact that all procedures were performed by the same surgeon.
Conclusions
In summary, LSG is an effective surgical method to induce significant weight loss and provide blood pressure control in obese patients. However, no relationship between total weight loss after the bariatric surgery and partial or full control of blood pressure was observed in this study. Further studies are needed to verify this observation and discover mechanisms of surgically‑induced reduction in blood pressure.
- Chooi YC, Ding C, Magkos F. The epidemiology of obesity. Metabolism. 2019; 92: 6‑10. | Crossref
- Świdnicka‑Siergiejko AK, Wróblewski E, Hady HR, et al. Esophageal pH and impedance reflux parameters in relation to body mass index, obesity‑related hormones, and bariatric procedures. Pol Arch Intern Med. 2018; 128: 594‑603. | Crossref
- Gill RS, Majumdar SR, Rueda‑Clausen CF, et al. Comparative effectiveness and safety of gastric bypass, sleeve gastrectomy and adjustable gastric banding in a population‑based bariatric program: prospective cohort study. Can J Surg. 2016; 59: 233‑241. | Crossref
- Rosenthal RJ; International Sleeve Gastrectomy Expert Panel. International Sleeve Gastrectomy Expert Panel Consensus Statement: best practice guidelines based on experience of >12 000 cases. Surg Obes Relat Dis. 2012; 8: 8‑19. | Crossref
- Ministrini S, Mondovecchio G, Lupattelli G. New insights in pathophysiology of cardiovascular benefits after obesity surgery. Kardiol Pol. 2020; 78: 657‑658. | Crossref
ARTICLE INFORMATION