Impact of continuous glucose monitoring on improving emotional well‑being among adults with type 1 diabetes mellitus: a systematic review and meta‑analysis
Key words: adults, continuous glucose monitoring, quality of life, self-monitoring of blood glucose, type 1 diabetes


 CC BY-NC-SA 4.0
Impact of continuous glucose monitoring on improving emotional well‑being among adults with type 1 diabetes mellitus: a systematic review and meta‑analysis
Introduction: Real‑time continuous glucose monitoring (CGM) has changed the way people with type 1 diabetes mellitus (T1DM) and health care providers perceive diabetes management and glucose control.
Objectives: The purpose of this meta‑analysis was to compare the emotional well‑being of adults with T1DM who used CGM and those using conventional self‑monitoring of blood glucose (SMBG).
Patients and methods: The MEDLINE/PubMed, Cochrane Library / Embase, CINAHL, Scopus, Web of Science, and ProQuest databases were searched for relevant publications. Primary outcome measures were health‑related quality of life, glycemic control, and fear of hypoglycemia. Randomized controlled trials and survey studies focused on the quality of life and fear of hypoglycemia among adult patients using CGM and SMBG were included in the analysis.
Results: The meta‑analysis included 11 studies involving a total of 1228 patients with T1DM. Analysis of the Worry subscale of the Hypoglycemia Fear Survey indicated a reduction of hypoglycemia fear in CGM users compared with SMBG users (Cohen d = –0.24; 95% CI, –0.41 to –0.07; mean difference, –3.15; 95% CI, –5.48 to –0.82). Outcome analysis of studies including the Diabetes Treatment Satisfaction Questionnaire showed Cohen d of 0.23 (95% CI, –0.18 to 0.63). The overall value of Cohen d equaled –0.24 (95% CI, –0.57 to 0.09), indicating a lack of effect of CGM use on improving HbA1c levels; however, after one of the studies was excluded from calculations, the reduction of HbA1c levels was significantly higher in CGM users (Cohen d = –0.33; 95% CI, –0.66 to 0.00; P = 0.047).
Conclusions: This is the first quantitative meta‑analysis of studies involving adult patients exclusively with T1DM, providing further evidence for the ability of CGM systems to reduce fear of hypoglycemia and improve quality of life. Continuous glucose monitoring systems have advantage over SMBG in adults with T1DM and improve HbA1c levels.
What's new?
Studies showed that continuous glucose monitoring (CGM) among people treated with continuous subcutaneous insulin infusion led to a reduction in the level of glycated hemoglobin compared with self‑monitoring of blood glucose. Users of CGM retrospectively reported a higher level of hypoglycemia safety and positive impact on their quality of life owing to some features of the system, such as audible alarms that either predict or signal low glucose levels. However, the results of randomized controlled trials (RCTs) have not been consistent in demonstrating the effects of CGM use on the quality of life and other patient‑reported outcomes such as fear of hypoglycemia or hypoglycemia awareness. It is important to learn why retrospective reports and personal experience of users suggest positive impact of CGM on daily life with diabetes while RCTs fail to demonstrate it. This is the first quantitative meta‑analysis of studies performed solely in adults with type 1 diabetes mellitus that provides further evidence for the ability of CGM systems to reduce fear of hypoglycemia and improve emotional well‑being.
Introduction
Real‑time continuous glucose monitoring (rtCGM) has changed the attitude of people with type 1 diabetes mellitus (T1DM) and health care providers towards diabetes management and glucose control.1,2 A growing body of evidence on the efficacy of rtCGM3-8 led to the recommendation of this method in 2019 by the American Diabetes Association (ADA) to be used daily for the best results.9
Patients with T1DM who were using rtCGM reported greater confidence in detecting and managing hypoglycemia, especially in social situations, and believed they could live more freely and safely despite the risk of hypoglycemia,10 which remains one of the major sources of emotional distress in people with diabetes.11,12 The results of the HypoDE study demonstrated that the use of rtCGM reduced emotional distress and fear of hypoglycemia.12,13 Nevertheless, randomized controlled trials (RCTs) provided mixed results regarding the impact of rtCGM use on the quality of life4,6,14 and other patient‑reported outcomes such as fear of hypoglycemia or hypoglycemia awareness.5,9,15,16
A review by Langendam et al17 examined the effectiveness of continuous glucose monitoring (CGM) systems compared with conventional self‑monitoring of blood glucose (SMBG) in patients with T1DM. However, it did not focus on aspects such as emotional well‑being, quality of life, or fear of hypoglycemia and the authors emphasized a need for such research.
This meta‑analysis concentrates on studies published after 2012, as no relevant papers had been issued before that year. To our best knowledge, this is the first study to analyze the impact of CGM use on emotional well‑being in adults with T1DM.
Continuous glucose monitoring systems can be divided into those integrated with an insulin pump (sensor‑augmented pump) and independent ones. The quality of treatment in patients with T1DM is also affected by the model of insulin therapy, whether it be multiple daily insulin injections or continuous subcutaneous insulin infusion. Newer types of insulin pumps integrated with CGM have additional functions and automatic features such as close‑loop systems that protect against hypoglycemia.
It is important to learn why retrospective studies and personal experience of users pointed to a positive impact of rtCGM use on daily life, whereas RCTs failed to demonstrate a significant effect on patient‑reported outcomes.12 We decided to analyze the effect sizes for patient‑reported outcome measures to investigate the impact of rtCGM use on the reported T1DM outcomes. The control group included T1DM patients who used conventional SMBG. The 2 methods measure the level of glucose in different ways—either directly in the blood (SMBG) or in subcutaneous tissue (CGM). Thus, the measurements may not necessarily be in line with each other and the largest differences are observed in the case of low blood glucose levels. Nevertheless, CGM is considered appropriate for evaluating trends in the glucose level. Occasionally, SMBG may also be performed in patients using CGM, for example, when there is a need for system calibration or when a sensor has to be changed.14-17
The aim of this meta‑analysis was to compare the differences in emotional well‑being (including fear of hypoglycemia) among adults with T1DM using CGM and SMBG. The additional objective was to compare the levels of glycated hemoglobin (HbA1c) in these 2 groups of patients. This was the only clinical parameter common for all studies included in the present meta‑analysis.
Patients and methods
Inclusion criteria
Types of studies, participants, and interventions
The study included RCTs and survey studies comparing the markers of emotional well‑being (such as health‑related quality of life and fear of hypoglycemia) in patients with T1DM. The participants were individuals aged 18 years or older classified as having T1DM with a HbA1c level of at least 7.5% (58 mmol/mol) and using any type of CGM system (invasive, retrospective, or real‑time system; intervention group) or conventional SMBG, defined as self‑measurement of blood glucose using glucometers and finger sticks (control group).
Types of outcome measures
The primary outcome measures were emotional well‑being, including quality of life—either diabetes‑specific (measured with the Hypoglycemia Fear Survey [HFS], Diabetes Distress Scale [DDS], or Diabetes Treatment Satisfaction Questionnaire [DTSQ]) or generic (measured with the World Health Organization–5 Well‑being Index [WHO‑5] or other instrument) and glycemic control, that is, changes in the level of HbA1c.
We were not able to analyze secondary outcomes such as complications and adverse effects, CGM‑derived glycemic control, death, costs, covariates, effect modifiers, or confounders because data from each study were presented differently and thus they were hard to compare. The same referred to episodes of hypoglycemia (<70 mg/dl, <3.9 mmol/l) or ketoacidosis.
Search methods
The MEDLINE / PubMed, Cochrane Library / Embase, CINAHL, Scopus, Web of Science, and ProQuest databases were searched for relevant papers published between January 1, 2013 and October 30, 2019, using various combinations of key words: continuous glucose monitoring, adults, quality of life, hypoglycemia fear survey. Reference lists of included trials, (systematic) reviews, meta‑analyses, and health technology assessment reports were checked manually to identify additional studies. Only articles published in English were taken into consideration. Additional information is provided in Supplementary material 1, Search strategies.
Data collection and analysis
Selection of studies
Two authors independently scanned the titles or abstracts of every record retrieved to identify studies for further assessment. All potentially relevant articles were investigated as full texts. We tried to find the final publication of the trial in cases when only abstracts were available. Studies without a final publication of the results were considered separately. In cases of duplicate publications and reports accompanying a primary study, we tried to maximize the amount of information by simultaneous evaluation of all available data.
Full‑text articles were assessed for compliance with the eligibility criteria. Studies were included in the present analysis if they were RCTs or survey studies, included adults (>18 years of age) with T1DM, lasted more than 8 weeks, and included parameters such as the use of a CGM system and emotional well‑being. The analyses had to include comparisons between CGM system and conventional self‑monitoring or between different types of CGM systems.
The exclusion criteria comprised studies involving children, adolescents, pregnant women, or patients exclusively with type 2 diabetes, studies in which a CGM system was not compared with conventional SMBG measurement or another type of CGM system, and those in which none of the selected outcomes were reported.
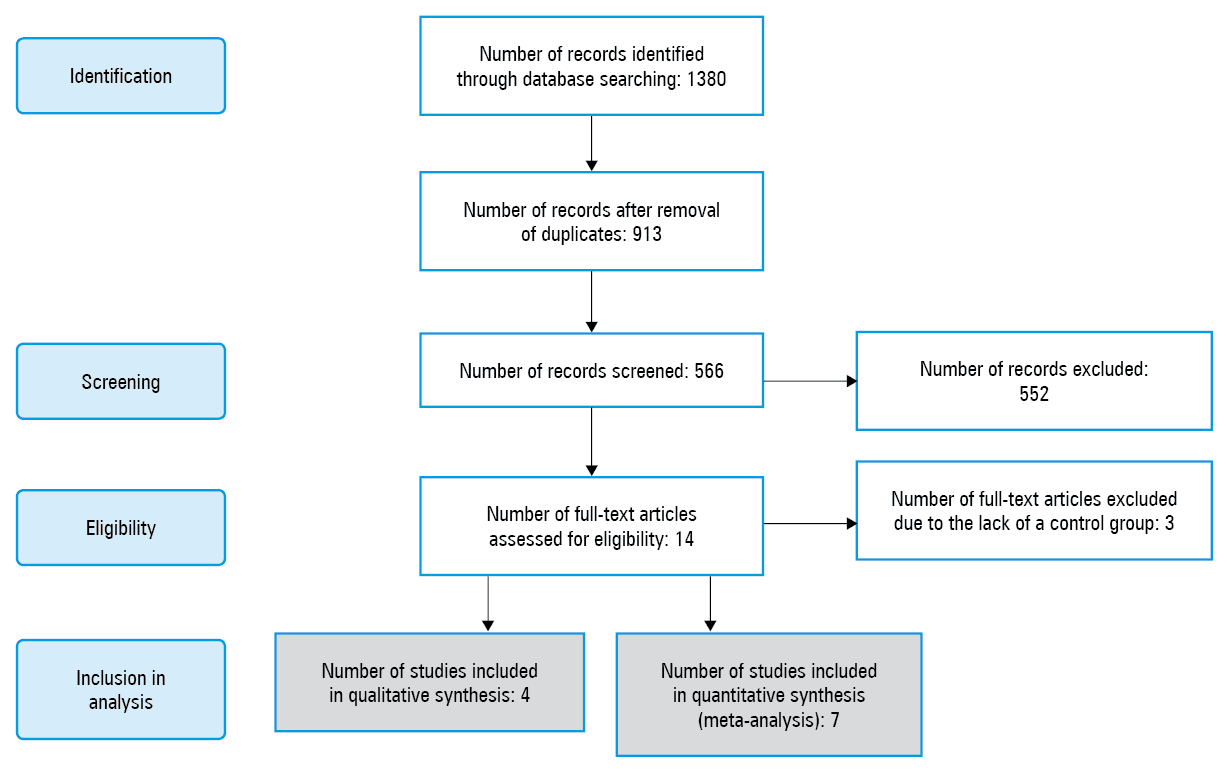
Two researchers independently performed the study selection. Any differences of opinion were resolved by consensus. The adapted PRISMA flow chart of study selection18 is presented in Figure 1. The study was registered in the International Prospective Register of Systematic Reviews (PROSPERO; ID: CRD42020155077).
Data extraction and management
Two researchers independently extracted the relevant population and intervention characteristics from studies that met the inclusion criteria using standard data extraction templates. Additional data are described in Supplementary material, Table S1. Disagreements were resolved by consensus. Any missing relevant information was sought from the original author(s) of the article. The extracted data are presented in Table 1.
Study | Population | Year | Country | Study design | Sample | Women, % | Age, y, mean (SD) | CGM type | Duration of intervention and follow‑up | Control group (eg, SMBG or blinded CGM) | HbA1c inclusion criterion | Baseline HbA1c, mean (SD) | Insulin pump users, % | Duration of disease, y, mean (SD) or median (IQR) | Quality of life instruments | Funding source |
Abbreviations: CGM, continuous glucose monitoring; DDS, Diabetes Distress Scale; DTSQ, Diabetes Treatment Satisfaction Questionnaire; GMSS, Glucose Monitoring Satisfaction Survey; HbA1c, glycated hemoglobin; HCQ, Hypoglycemia Confidence Questionnaire; HFS‑II, Hypoglycemia Fear Survey; HFS‑W, Worry subscale of the Hypoglycemia Fear Survey; N/A, not applicable; ND, no data; PAIDS, Problem Areas in Diabetes Scale; QLI‑D, Quality of Life Index–Diabetes; SMBG, self‑measurements of blood glucose; WHO‑5, World Health Organization–5 Well‑being Index | ||||||||||||||||
Table 1. Characteristics of included studies | ||||||||||||||||
Studies included in quantitative synthesis | ||||||||||||||||
Polonsky et al,14 2017 | Adults | ND | United States | Prospective randomized trial | 158 | 45 | 48 | Dexcom G4 Platinum | 24 weeks | SMBG | 7.5%–10% | 8.6% (0.6%) | N/A | 12 (14) | WHO‑5, EQ‑5D‑5L, DDS, HFS‑W, HCQ | Fundings from Dexcom Inc provided to the Behavioral Diabetes Institute and to the Jaeb Center for Health Research |
Walker et al,25 2014 | Adults | ND | United States | Quasi‑experimental comparative pilot study | 10 | 60 | 42.6 (9.6) | Dexcom SEVEN PLUS CGM system | 12 weeks | CGM units modified to obscure the numerical glucose value | ND | 7.68% (1.56%) in CGM, 7.24% (1.05%) in controls | 40 | 20 (13.6) | HFS‑II, QLI‑D | Unrestricted equipment grant from Dexcom Inc |
Polonsky et al,20 2016 | ≥65 y | 2016 | United States | Online survey | 285 | 48.1 | 70.7 (5) | Dexcom Inc | 4 months | rtCGM hopefuls | N/A | N/A | 56.5 | 36.1 (18.5) | WHO‑5, HFS‑II, DDS | Funded by Dexcom Inc |
Kropff et al,26 2016 | Adults | ND | France, Italy, the Netherlands | Multicenter randomized crossover trial | 32 | 56.3 | 47 (11.2) | Continuous glucose monitoring | 8 weeks | Closed‑loop glucose control using an artificial pancreas | 7.5%–10% | 8.2% (0.6%), 66 (5) mmol/mol | 100 | 28.6 (10.8) | HFS‑II, DTSQ, | Supported by the European Community Framework Programme 7 (FP7‑ICT‑2009–4; grant no. 247138). |
Little et al,27 2018 | Adults | ND | United Kingdom | Multicenter randomized 2 × 2 factorial study | 96 | 63 | 49.(12) | RT‑CGM, Medtronic iPRO | 24 weeks | SMBG | < and ≥8%, (< and ≥64 mmol/mol) | 66 (12) mmol/mol | 3 | 29 (12) | HFS‑II, DTSQ | Funded by a peer‑reviewed grant from Diabetes UK (07/0003556); data entry and trial support funded by the National Institute for Health Research and the Cambridge National Institute for Health Research Biomedical Research Center |
Little et al,16 2014 | Adults | ND | United Kingdom | Multicenter randomized 2 × 2 factorial study | 96 | 64 | 48.6 (12.2) | Medtronic iPro1 | 24 weeks | SMBG | < and ≥8%, (< and ≥64 mmol/mol) | 8.3% (67 mmol/mol) | 3 | 29 | HFS‑II, DTSQ | Funded by a peer‑reviewed grant from Diabetes UK (07/0003556); data entry and trial support funded by the National Institute for Health Research and the Cambridge National Institute for Health Research Biomedical Research Center |
Table 1. Characteristics of included studies | ||||||||||||||||
Lind et al,28 2017 | Adults | 2014–2016 | Sweden | Randomized crossover open‑label controlled trial | 161 | 45.3 | 43.7 | Dexcom G4 PLATINUM, Dexcom Inc, San Diego, CA | 69 weeks | SMBG | ≥7.5% (58 mmol/mol) | 8.6% (70 mmol/mol) | N/A | 22.2 (11.8) | WHO‑5, DTSQ, HFS‑II, HCQ, PAIDS | Sponsored by the NU Hospital Group, Trollhättan and Uddevalla, Sweden |
Studies included in qualitative synthesis | ||||||||||||||||
Ehrmann et al,12 2019 | Adults | ND | Germany | Multicenter randomized controlled trial | 141 | 31.8 in controls, 46.7 in CGM | 47.3 (10.1) in controls, 45.8 (12) in CGM | Dexcom Gen 4 Platinum sensor | 30 weeks | SMBG | ≤9% | 7.4% (1.0) in controls, 7.6% (1.0) in CGM | N/A | 20.8 (13.1) in controls, 20.9 (14.0) in CGM | GMSS, HFS‑II, EQ‑5D | Funded by Dexcom Inc, San Diego |
van Beers et al,29 2017 | Adults | ND | ND | Randomized open‑label crossover trial | 52 | 46.2 | 48.6 (11.6) | ND | 16 weeks | SMBG | ND | 7.5% (0.8%) | 44.2 | 30.5 (18.5–40.8) | WHO‑5, PAID‑5, HFS‑W | Funding from Eli Lilly and Sanofi; continuous glucose monitoring devices provided by Medtronic |
Reddy et al,30 2018 | Adults | ND | United Kingdom | Prospective randomized nonmasked parallel group study | 36 | ND | ND | Dexcom G4 | 16 weeks | Flash glucose monitoring (Abbott Freestyle Libre) | <58 or ≥58 mmol/mol | 54.0 (46.0–62.0) in CGM, 51.0 (48.5–59) in controls | ND | ND | HFS‑II, PAID | Funded by Dexcom Inc |
Olafsdottir et al,10 2018 | Adults | 2014–2016 | Sweden | Open‑label multicenter crossover randomized clinical trial | 161 | 46.4 | 44.6 (12.7) | Dexcom G4 PLATINUM | 69 weeks | SMBG | ≥7.5% (58 mmol/mol) | 8.7 (0.84)%, 72 (9.1) mmol/mol | N/A | 22.2 (11.8) | HCQ | Sponsored by the NU Hospital Group, Trollhättan and Uddevalla, Sweden |
Risk of bias
Two authors assessed each study independently using the Cochrane Collaboration’s tool.19 Disagreements were resolved by consensus. Additionally, an online study20 included in the analysis was assessed according to the guidelines of the EQUATOR Network21 and the Checklist for Reporting Results of Internet E‑Surveys (CHERRIES)22,23 to verify its quality. Additional data are described in Supplementary material, Tables S2 and S3.
Reporting biases
We used funnel plots with Begg–Mazumdar and Egger tests to assess the potential asymmetry of results and small study bias. Potential sources of asymmetry on the funnel plots are publication bias, poor methodological quality of smaller studies, and true heterogeneity in the effect, associated with study size.19
Heterogeneity and sensitivity
Heterogeneity of the studies was evaluated using the I2 inconsistency index (0%–100%) and between‑study variance of true effects (T2). Higher I2 values pointed to greater heterogeneity—the I2 value exceeding 50% indicated substantial heterogeneity, whereas the value over 75% indicated high heterogeneity.24 The value of T2 higher than 0 was considered substantial. Sensitivity analysis was performed by removing individual studies from the overall result.
Statistical analysis
The effect size between CGM and SMBG users, expressed by Cohen d and pooled mean difference with 95% CI, was estimated using random‑effects model. A P value of less than 0.05 was considered significant. Statistical analyses were performed with STATISTICA software, version 13.1 (Dell Inc 2016, Tulsa, Oklahoma, United States).
Results
Included studies
A total of 14 full‑text articles were chosen for analysis. Of these, 11 studies with a total of 1228 patients with T1DM were included in the meta‑analysis10,12,14,16,20,25-30: 9 were RCTs,10,12,14,16,26-30 1 was a quasi‑experimental comparative pilot study25 and 1 was an online survey.20 The mean age of participants ranged from 42.625 to 70.720 years. The proportion of women in intervention groups varied between 45%14 and 64%.16 The percentage of people using an insulin pump varied significantly between studies and ranged from 3%16,27 to 100%.26 Three studies10,12,28 included participants who did not use an insulin pump and 1 study did not provide such information.30 The characteristics of included studies are presented in Table 1.
Overall, 7 studies14,16,20,25-28 were included in quantitative synthesis and 4 studies10,12,29,30 in qualitative synthesis. In the second group of studies, outcomes were reported as median and interquartile range,30 mean difference,29 or baseline‑adjusted means.12 The study by Olafsdottir et al10 was excluded from quantitative analysis because it replicated the results of the study by Lind et al.28
Excluded studies
Three full‑text studies with a total of 931 patients with T1DM31-33 were excluded from analysis because they lacked control groups. The methodological characteristics of the excluded studies are described in Supplementary material, Table S1.
Quality assessment
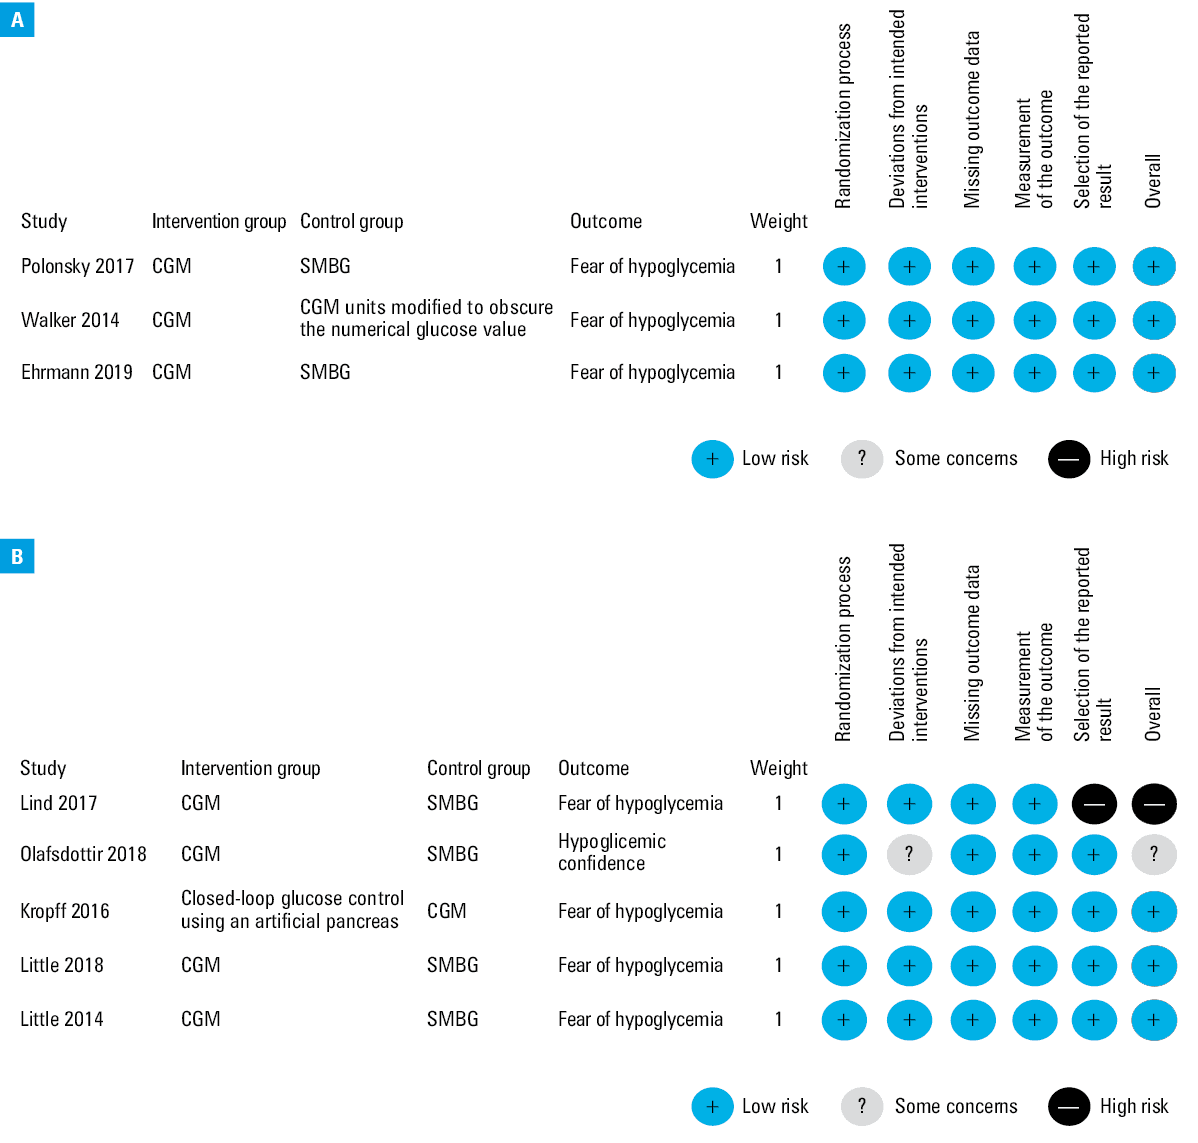
Of the 11 included studies, 1 was conducted using questionnaire as a method of data collection. Among the suggested guidelines, we found CHERRIES to be the most suitable tool for the analysis of a web‑based survey. The scoring system and outcomes are summarized in Supplementary material, Table S2. Out of the 10 randomized studies, 8 had a low risk of bias, 1 had a moderate risk of bias, and 1 had a high risk of bias (Supplementary material, Table S3). Two studies were analyzed with intention to treat. The risk of bias in individual studies is presented in Supplementary material, Table S4. Eight studies had pre‑protocols; 3 of them were individually‑randomized parallel‑group trials and 5 were individually randomized crossover trials. Detailed presentation of the risk of bias for individual studies is shown in Figure 2A and 2B.
Abbreviations: see Table 1
Qualitative synthesis
The outcomes of the qualitative synthesis are shown in Supplementary material, Table S5. A single study reported higher levels of HbA1c in the CGM group after intervention (compared with the control group).12 The studies using the total HFS‑II scale, HFS Worry [HFS‑W], or HFS Behavior [HFS‑B] subscale reported higher scores in the control group after follow‑up.12,29 The only exception was the study by Reddy et al,30 in which higher scores on the total HFS‑II scale, HFS‑W and HFS‑B subscales, and the Problem Areas in Diabetes Scale (PAIDS) were found in the CGM group. No differences were observed for DDS scores.12 A study by Olafsdottir et al10 was the only one to analyze the Hypoglycemic Confidence Questionnaire and reported higher scores in the CGM group compared with the SMBG group. The WHO‑5 was analyzed by van Beers et al29; however, the authors did not disclose the results.
Quantitative synthesis
Hypoglycemia Fear Survey II
Four studies were included in the outcome analysis of the total HFS‑II questionnaire.16,24,26,27 Cohen d value for total HFS‑II equaled –0.04 (95% CI, –0.32 to 0.24; P = 0.78), indicating a lack of the effect of CGM use in reducing the fear of hypoglycemia. Additional data are described in Supplementary material, Figure S1.
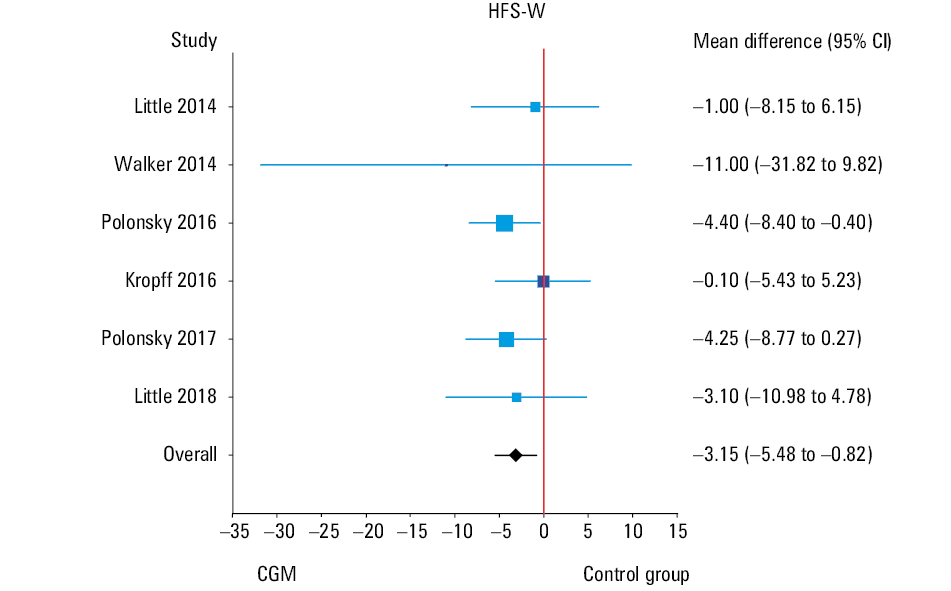
Six studies were included in the outcome analysis of HFS‑W.14,16,20,25-27 Cohen d value equaled –0.24 (95% CI, –0.41 to –0.07) and the result was significant (P = 0.005) (Supplementary material, Figure S2). Pooled mean difference was –3.15, which means that the use of CGM reduced the level of fear of hypoglycemia by approximately 3 points (P = 0.008; 95% CI, –5.48 to –0.82) (Figure 3).
Abbreviations: see Table 1
Four studies were included in the outcome analysis of HFS‑B.16,25-27 Cohen d value for this subscale was –0.03 (95% CI, –0.30 to 0.24), indicating a lack of the effect of CGM in reducing the fear of hypoglycemia (Supplementary material, Figure S3).
Diabetes Treatment Satisfaction Questionnaire
Four studies were included in the outcome analysis of DTSQ (status version).16,26-28 Cohen d value equaled 0.23 (95% CI, –0.18 to 0.63), indicating that the use of CGM did not have an effect on higher treatment satisfaction (Supplementary material, Figure S4).
Change in glycated hemoglobin levels
The reduction of HbA1c levels in the CGM intervention groups varied between 0.43 and 1.0 percentage points in 3 of the studies.14,25,28 Little et al27 found no differences in HbA1c levels between the intervention and control groups (7.7% in both groups). Meanwhile, in 2 other studies16,26 a minor reduction of HbA1c levels in control groups was observed (by 0.1% percentage points in each study). Changes in HbA1c levels for each study are presented in Table 2. The overall Cohen d value equaled –0.24 (95% CI, –0.57 to 0.09), indicating no impact of CGM use on the level of HbA1c (Supplementary material, Figure S5).
Source | Intervention group | Control group | ||
Primary endpoint HbA1c, %, mean (SD) | Number | Primary endpoint HbA1c, %, mean (SD) | Number | |
Abbreviations: see Table 1 | ||||
Lind et al, 201728 | 7.92 (0.79) | 142 | 8.35 (0.97) | 142 |
Polonsky et al, 201714 | 7.7 (0.8) | 105 | 8.2 (0.5) | 53 |
Walker et al, 201425 | 6.18 (1.14) | 5 | 7.18 (1.31) | 5 |
Polonsky et al, 201620 | Questionnaire survey | |||
Kropff et al, 201626 | 8.0 (0.4) | 32 | 7.9 (0.5) | 32 |
Little et al, 201827 | 7.7 (3.1) | 36 | 7.7 (3.2) | 36 |
Little et al, 201416 | 8.2 (1.1) | 46 | 8.1 (0.9) | 43 |
Sensitivity analysis and publication bias assessment
Hypoglycemia Fear Survey II
Studies using the total HFS‑II questionnaire16,25-27 demonstrated low heterogeneity with I2 = 0% (95% CI, 0%–63%) and T2 = 0 (95% CI, 0.00–0.16). Sensitivity analysis showed that exclusion of individual studies did not significantly change the results. Cohen d values ranged from –0.07 (95% CI, –0.44 to 0.31) to 0.00 (95% CI, –0.29 to 0.28) (Table 3). The relationship between effect size and study size is presented in the funnel plot (Supplementary material, Figure S6). The Egger test did not show any association between effect size and standard error (P = 0.06); however, the Begg–Mazumdar test indicated such an association (P = 0.04).
Excluded study | Cohen d | 95% CI | P value | Weight, % | Standard error of Cohen d | Change in standard error of Cohen d, % |
Abbreviations: HFS‑B, Behavior subscale of the Hypoglycemia Fear Survey; others, see Table 1 | ||||||
Total HFS‑II | ||||||
Little et al, 201416 | –0.07 | –0.44 to 0.31 | 0.73 | 55.96 | 0.19 | 33.68 |
Walker et al, 201425 | 0.00 | –0.29 to 0.28 | 0.96 | 95.22 | 0.15 | 2.48 |
Kropff et al, 201626 | –0.05 | –0.38 to 0.28 | 0.76 | 72.63 | 0.17 | 17.34 |
Little et al, 201827 | –0.04 | –0.36 to 0.28 | 0.79 | 76.19 | 0.16 | 14.56 |
All studies included | –0.04 | –0.32 to 0.24 | 0.79 | 100 | 0.14 | 0 |
HFS‑W | ||||||
Little et al, 201416 | –0.27 | –0.45 to –0.09 | 0.003 | 84.46 | 0.09 | 8.81 |
Walker et al, 201425 | –0.23 | –0.4 to –0.07 | 0.006 | 98.3 | 0.09 | 0.86 |
Polonsky et al, 201620 | –0.21 | –0.42 to 0.00 | 0.06 | 60.76 | 0.11 | 28.29 |
Kropff et al, 201626 | –0.26 | –0.44 to –0.09 | 0.003 | 90.34 | 0.09 | 5.21 |
Polonsky et al, 201714 | –0.20 | –0.4 to –0.01 | 0.04 | 75.37 | 0.10 | 15.18 |
Little et al, 201827 | –0.24 | –0.42 to –0.07 | 0.007 | 90.76 | 0.09 | 4.96 |
All studies included | –0.24 | –0.41 to –0.07 | 0.005 | 100 | 0.08 | 0 |
HFS‑B | ||||||
Little et al, 201416 | 0.02 | –0.34 to 0.37 | 0.93 | 58.11 | 0.18 | 31.18 |
Walker et al, 201425 | –0.01 | –0.29 to 0.27 | 0.96 | 95.34 | 0.14 | 2.41 |
Kropff et al, 201626 | –0.06 | –0.38 to 0.27 | 0.74 | 70.08 | 0.17 | 19.46 |
Little et al, 201827 | –0.08 | –0.39 to 0.23 | 0.63 | 76.48 | 0.16 | 14.35 |
All studies included | –0.03 | –0.3 to 0.24 | 0.82 | 100 | 0.14 | 0 |
DTSQ | ||||||
Little et al, 201416 | 0.3 | –0.18 to 0.78 | 0.23 | 75.03 | 0.24 | 17.83 |
Kropff et al, 201626 | 0.28 | –0.21 to 0.77 | 0.27 | 77.52 | 0.25 | 21.33 |
Lind et al, 201728 | 0.03 | –0.25 to 0.3 | 0.85 | 69.29 | 0.14 | –31.66 |
Little et al, 201827 | 0.27 | –0.23 to 0.77 | 0.29 | 78.16 | 0.25 | 22.85 |
All studies included | 0.23 | –0.18 to 0.63 | 0.27 | 100 | 0.21 | 0 |
HbA1c levels | ||||||
Little et al, 201416 | –0.32 | –0.67 to 0.03 | 0.07 | 81.73 | 0.18 | 6.56 |
Walker et al, 201425 | –0.21 | –0.55 to 0.14 | 0.24 | 94.84 | 0.18 | 5.02 |
Kropff et al, 201626 | –0.33 | –0.66 to 0 | 0.05 | 83.64 | 0.17 | 0.16 |
Polonsky et al, 201714 | –0.12 | –0.48 to 0.23 | 0.49 | 79.73 | 0.18 | 7.93 |
Lind et al, 201728 | –0.17 | –0.6 to 0.26 | 0.43 | 77.17 | 0.22 | 30.12 |
Little et al, 201827 | –0.29 | –0.66 to 0.08 | 0.13 | 82.9 | 0.19 | 13.86 |
All studies included | –0.24 | –0.57 to 0.09 | 0.15 | 100 | 0.17 | 0 |
Studies analyzing HFS‑W14,16,20,25-27 demonstrated low heterogeneity with I2 = 0% (95% CI, 0%–48%) and T2 = 0 (95% CI, 0.00–0.04). Sensitivity analysis showed that exclusion of individual studies did not significantly change the result. Cohen d values ranged from –0.27 (95% CI, –0.45 to –0.09) to –0.20 (95% CI, –0.40 to –0.01) (Table 3). The relationship between the effect size and study size is presented in the funnel plot (Supplementary material, Figure S7). The Begg–Mazumdar and Egger tests did not indicate any associations between effect size and standard error (P = 0.85 and P = 0.86, respectively).
Studies including HFS‑B16,25-27 showed low heterogeneity: I2 = 0% (95% CI, 0%–62%); T2 = 0 (95% CI, 0.00–0.14). Sensitivity analysis revealed that after exclusion of individual studies the results did not significantly change. Cohen d values ranged from –0.08 (95% CI, –0.39 to 0.23) to 0.02 (–0.34 to 0.37) (Table 3). The relationship between effect size and study size is presented in the funnel plot (Supplementary material, Figure S8). Neither the Begg–Mazumdar nor Egger test showed an association between effect size and standard error (P >0.99 and P = 0.45, respectively).
Diabetes Treatment Satisfaction Questionnaire
Studies including DTSQ16,26-28 demonstrated high heterogeneity with I2 = 74.5% (95% CI, 29.0%–90.9%) and T2 = 0.12 (95% CI, 0.02–0.42). The study by Lind et al28 distinguished itself substantially from other studies in terms of greater effect size (0.67) (Supplementary material, Figure S4). Sensitivity analysis showed that exclusion of this study lowered the effect size to almost 0 (d = 0.03; 95% CI, –0.25 to 0.30). Cohen d values varied from 0.03 (95% CI, –0.25 to 0.30) to 0.30 (95% CI, –0.18 to 0.78) (Table 3). The relationship between the effect size and study size is presented in the funnel plot (Supplementary material, Figure S9). The Begg–Mazumdar test did not indicate any association between effect size and standard error (P = 0.12); however, such association was indicated by the Egger test (P = 0.04).
Changes in HbA1c
Studies analyzing HbA1c levels14,16,25-28 showed high heterogeneity: I2 = 71.7% (95% CI, 34.5%–87.8%) and T2 = 0.11 (95% CI, 0.02–0.31). In sensitivity analysis, exclusion of the study by Kropff et al26 had a significant impact on Cohen d value, as it changed to –0.33 (95% CI, –0.66 to –0.00), which was the lowest value obtained. The highest value was –0.24 (95% CI, –0.57 to 0.09) (Table 3). The relationship between the effect size and study size is presented in the funnel plot (Supplementary material, Figure S10). The Begg–Mazumdar and Egger tests did not reveal any association between the effect size and standard error (P = 0.77 and P >0.99, respectively).
Discussion
This systematic review and meta‑analysis examined 11 studies in terms of head‑to‑head comparisons of CGM and SMBG interventions for T1DM in adult populations. To our best knowledge, this is the first quantitative meta‑analysis of adults exclusively with T1DM, which provides further evidence for the ability of CGM systems to reduce the fear of hypoglycemia and improve emotional well‑being. Our results show that CGM use may reduce the level of hypoglycemia fear by approximately 3 points (mean difference, –3.15). This may not be considered a substantial reduction as HFS‑W scores range between 0 and 72 points, with higher scores indicating greater fear.34 Sensitivity analysis showed that CGM use was able to improve HbA1c levels; however, it did not affect the scores for total HFS‑II, HFS‑B, or DTSQ.
Studies included in HFS‑W analysis14,16,20,25-27 demonstrated low heterogeneity, while Cohen d value indicated that the use of CGM increased patient satisfaction compared with control groups. Due to the fact that the heterogeneity of these studies was low and Cohen d value was significant, the reliability of this result is rather high. Studies using DTSQ16,26-28 had high heterogeneity with a single large effect size 0.67 for the study by Lind et al.28
Out of the 7 studies included in quantitative synthesis, 6 investigated changes in HbA1c levels14,16,25-28 and a single study by Polonsky et al20 was questionnaire‑based. The value of Cohen d suggested a positive effect of CGM use on HbA1c levels. Exclusion of the study by Kropff et al26 from sensitivity analysis showed a significant improvement of HbA1c levels with a larger effect size. The possible explanation is that the control group in this study consisted of T1DM patients using a closed‑loop glucose control system (artificial pancreas). Therefore, this study was excluded from the analysis. The studies by Polonsky et al14 and Lind et al28 included large groups of T1DM patients (158 and 161, respectively) and their individual effect sizes were large (–0.70; 95% CI, –1.0 to –0.36; P <0.001 and –0.49; 95% CI, –0.72 to –0.25; P <0.001, respectively), suggesting that these 2 studies may be considered the most reliable. This finding is in line with the results of another meta‑analysis17 that involved both adult and pediatric populations.
Strengths and limitations of the study
The strengths of our study comprise narrow inclusion criteria, which made the calculations more reliable. Unlike other studies, we also included fear of hypoglycemia in the analysis. This meta‑analysis is the first to assess the emotional well‑being (including quality of life) in adult T1DM patients using CGM and to attempt the evaluation of the effect of CGM use on fear of hypoglycemia in this population. The risk of publication bias was found to be low; however, due to the small number of included studies this result is not reliable and should be treated with great caution. There is still a need to analyze larger samples to determine the true effect of rtCGM use. This issue requires further insightful examination, also in terms of the methodology of RCTs that investigate the emotional well‑being of patients with T1DM.
A qualitative meta‑synthesis by Messer et al35 demonstrated a positive impact of CGM use on physical, emotional, and social aspects of life. Our quantitative meta‑analysis focused on general emotional well‑being that includes some aspects of the quality of life and fear of hypoglycemia. This was due to the fact that we did not identify any studies that would quantify the quality of life and meet the inclusion criteria. Questionnaires such as HFS, EQ‑5D, or DTSQ are not designed to assess the quality of life but rather to reflect the of emotional well‑being; therefore, the available evidence is another limitation.
The limitations also include a relatively small number of analyzed studies. Moreover, we were not able to compare the clinical outcomes as each study used different measures or methodology. Heterogeneity of methodologies was the reason for excluding 3 studies with considerable samples31-33 as they had no control groups. A study by Lind et al,28 in which a Swedish version of HFS‑B was used, is an example. Hence, some studies could only be subjected to qualitative analysis.10,12,29,30
Our meta‑analysis involves articles that analyzed the impact of CGM and SMBG use on emotional well‑being in adults with T1DM. Therefore, we were not able to compare in detail the treatment methods for T1DM, for example, the frequency of measurements, differences in insulin doses between the CGM and SMBG groups, or evaluation of hypoglycemia.
Implications for current clinical practice and future research
This systematic review suggests minor superiority of CGM systems in controlling glycemia among adults. However, it is important to note that there are also other treatment methods for T1DM and different types of CGM systems used in clinical practice. Our results are in line with those of Ehrmann et al,12 who concluded that CGM use has significant impact and medium effect size on fear of hypoglycemia (d = 0.32; 95% CI, 0.01–0.66). This suggests that inclusion of larger samples of patients could result in larger effect sizes and differences in outcomes. Analysis of a greater number of studies could also result in more significant Cohen d values. However, substantial differences in the methodology of studies addressing the aspects of quality of life and fear of hyperglycemia were the reason for only including 7 studies that used the same research tool (questionnaire).14,16,20,25-28
Larger sample sizes may be essential to better determine the true effect of rtCGM. Large‑scale clinical trials with longer follow‑up periods are necessary to thoroughly investigate how patients with T1DM benefit from the use of different CGM systems in terms of their quality of life and how these systems affect glucose variability, hypoglycemia risk, HbA1c levels as well as acute and chronic diabetes complications.
This study suggests that CGM systems have an advantage over SMBG as they significantly reduce the fear of hypoglycemia and improve HbA1c levels. However, more studies with larger samples are necessary to investigate the associations between CGM use and quality of life or fear of hypoglycemia. It is also essential to standardize the methods, measures, and results of clinical trials that examine the quality of life and fear of hypoglycemia in adults with T1DM.
A comparison of effect sizes demonstrated that the effect of CGM use on patient‑reported outcomes was considerably small. This should be taken into account when future RCTs in this field are planned.
- Mastrototaro JJ. The MiniMed continuous glucose monitoring system. Diabetes Technol Ther. 2000; 2: S13‑S18. | Crossref
- Danne T, Nimri R, Battelino T, et al. International consensus on use of continuous glucose monitoring. Diabetes Care. 2017; 40: 1631‑1640. | Crossref
- Pickup JC, Freeman SC, Sutton AJ. Glycaemic control in type 1 diabetes during real time continuous glucose monitoring compared with self‑monitoring of blood glucose: meta‑analysis of randomised controlled trials using individual patient data. BMJ. 2011; 343: d3805. | Crossref
- Yeh HC, Brown TT, Maruthur N, et al. Comparative effectiveness and safety of methods of insulin delivery and glucose monitoring for diabetes mellitus: a systematic review and meta‑analysis. Ann Intern Med. 2012; 157: 336‑347. | Crossref
- Beck RW, Riddlesworth T, Ruedy K, et al. Effect of continuous glucose monitoring on glycemic control in adults with type 1 diabetes using insulin injections: the DIAMOND randomized clinical trial. JAMA. 2017; 317: 371‑378. | Crossref
SUPPLEMENTARY MATERIAL
ARTICLE INFORMATION