Risk prediction score for the incidence of long-term cerebrovascular events among patients undergoing primary percutaneous coronary intervention: a retrospective real-world study
Key words: cerebrovascular events, follow-up, primary percutaneous coronary intervention, risk prediction score


 CC BY-NC-SA 4.0
Risk prediction score for the incidence of long-term cerebrovascular events among patients undergoing primary percutaneous coronary intervention: a retrospective real-world study
Introduction: Although the rates of long‑term outcome events are low, stroke is associated with high short- and long‑term mortality and adversely affects the quality of life of patients with a history of primary percutaneous coronary intervention (PCI).
Objectives: We sought to develop and validate a novel marker‑based risk score to improve stroke prognostication in patients with myocardial infarction (MI) undergoing primary PCI.
Patients and methods: A retrospective study was conducted to internally validate a new biomarker‑based risk score for the incidence of stroke in 4103 patients with MI undergoing primary PCI who were randomized into derivation and validation cohorts.
Results: Significant predictors of cerebrovascular events included age, history of atrial fibrillation, history of hypertension, and the target lesion involving branches. The models had good calibration and discrimination in both derivation and internal validation. The areas under the receiver operating characteristic curve for predicting cerebrovascular events were 0.826 (sensitivity, 84.78%; specificity, 65.18%) and 0.846 (sensitivity, 71.43%; specificity, 90.29%) for the derivation and validation cohorts, respectively, at the 5‑year follow‑up. We calculated the total risk score for each participant, and divided them into low- and high‑risk groups according to the median of the total risk score. A Kaplan–Meier survival analysis for the cohort showed significant differences in the total cohort (P <0.001) and derivation cohorts (P = 0.001).
Conclusions: The prediction model was internally validated and calibrated in large cohorts of patients with MI receiving primary PCI therapy. This risk score allows re‑evaluation of the risk of cerebrovascular events in patients after primary PCI.
What's new?
This risk score proposed in our study incorporates routine clinical data, serum inflammatory markers, and coronary angiography results. By incorporating the time since an event, it allows re‑evaluation of the risk of cerebrovascular events at 5 or more years after primary percutaneous coronary intervention. The risk prediction score includes the variables of age, history of hypertension, history of atrial fibrillation, and the target lesion involving branches. The established risk score may be used to inform decisions about novel therapies and be trialed in the context of changes in quantifiable risk. To our best knowledge, our study is the first to develop and validate a risk score for stroke prediction that is suitable for patients with acute myocardial infarction who had undergone primary percutaneous coronary intervention. The robustness of our results was confirmed through rigorous statistical analysis: least absolute shrinkage and selection operator regression, receiver operating characteristic curve analysis, nomogram model, calibration graph, and Kaplan–Meier survival analysis.
Introduction
Primary percutaneous coronary intervention (PCI) for patients with acute myocardial infarction (MI) is regarded as the optimal method for achieving reperfusion and has been shown to increase the survival rate.1 Although the long‑term outcome event rates are low, stroke is associated with high short- and long‑term mortality and adversely affects the patients’ quality of life after they undergo PCI. Conclusive data on the exact incidence and consequences of long‑term stroke following primary PCI remain insufficient thus far.2-5 Initially, relatively simple cases were treated; however, the complexity of lesions has increased, and cases of long‑term stroke following primary PCI have now reached 30% of the initial patient load. Additionally, several interventions are routinely carried out for octogenarians with diffuse atherosclerosis, multivessel disease, and left main coronary artery lesions. Therefore, healthcare decisions, practices, and interventions should be adapted to individuals based on their predicted risk of diseases. We sought to develop and validate a novel marker‑based risk score to evaluate the long‑term (5‑year) risk probability of stroke in patients with MI who had undergone primary PCI. We prepared this article in accordance with the TRIPOD reporting checklist.1
Patients and methods
Study design and participants
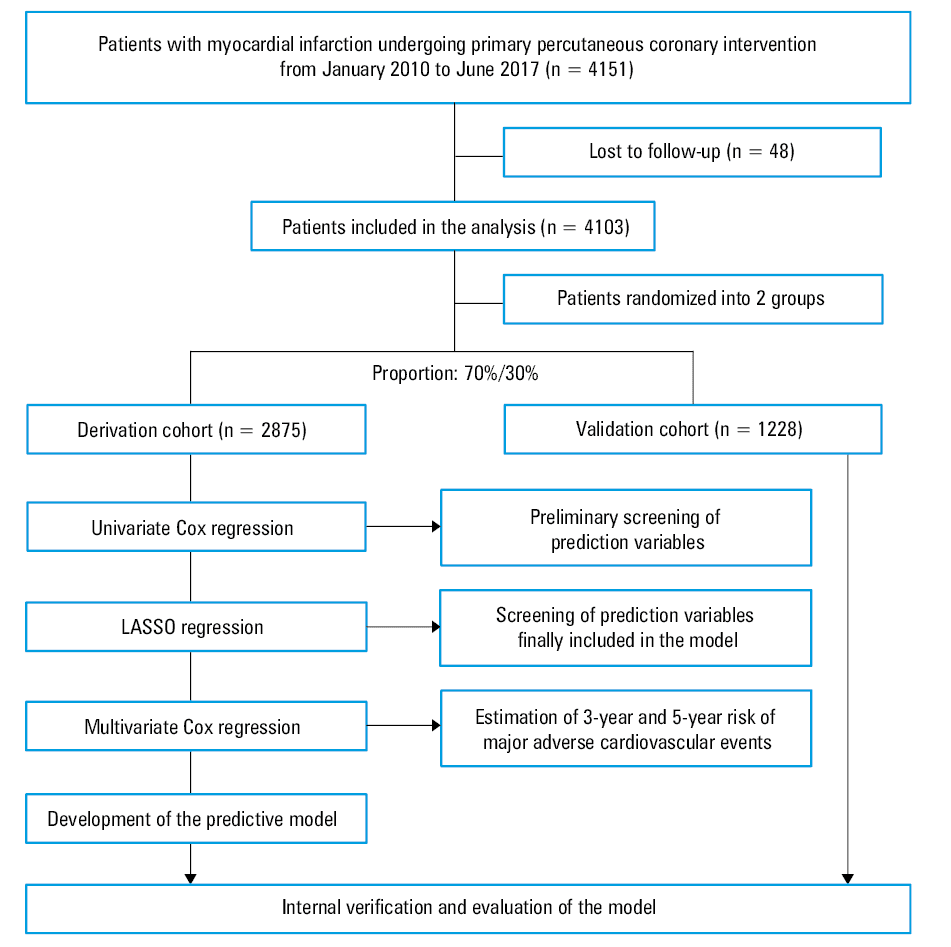
A total of 4151 consecutive patients with acute MI who underwent primary PCI at Fuwai Hospital (Beijing, China) between January 2010 and June 2017 were enrolled. After exclusion of individuals without follow‑up data, a total of 4103 patients remained (3582 cases of ST‑segment elevation acute myocardial infarction and 521 cases of non–ST‑segment elevation acute myocardial infarction). The outcome of this study included only initial ischemic stroke. The diagnosis of the outcome was confirmed by local neurologists when patients were moved to another center and source documents were obtained via follow‑up. The R software (R Foundation for Statistical Computing, Vienna, Austria) was used to randomly and proportionally divide the patients into derivation and validation cohorts (70%:30%). All patients were referred to a coronary catheterization center with a diagnosis of MI fulfilling the criteria for primary PCI according to the guidelines of the European Society of Cardiology6 and American College of Cardiology Foundation / American Heart Association.7 Patient records, including demographics, medical history, physical examination, blood test results, electrocardiography, echocardiographic data, and discharge medication regimen were reviewed. Blood testing was performed in a clinical laboratory at Fuwai Hospital. The study flow chart is shown in Figure 1.
Definitions
Hypertension was defined as blood pressure (BP) equal to or greater than 140/90 mm Hg at rest in 3 measurements or a previous diagnosis of hypertension and current use of antihypertensive drugs. Diabetes mellitus (DM) was defined according to the 75‑g oral glucose tolerance test. Specifically, patients were diagnosed with DM if they met one of the following criteria: 1) fasting plasma glucose level of 7.0 mmol/l or higher, 2) a 2‑h value of 11.1 mmol/l or higher in the 75‑g oral glucose tolerance test, and 3) a casual plasma glucose level of 11.1 mmol/l or higher. Dyslipidemia was defined by any of the following parameters8: total cholesterol level of 5.0 mmol/l or higher, low‑density lipoprotein cholesterol level of 3.0 mmol/l or higher, triglyceride level of 1.7 mmol/l or higher, high‑density lipoprotein cholesterol level below 1.2 mmol/l (in women) or 1.0 mmol/l (in men). Trained medical staff measured the height and weight of each patient; body mass index was calculated by dividing weight (kg) by the square of height (m2). No‑reflow phenomenon was described as Thrombolysis in Myocardial Infarction flow grade of less than 3 after primary PCI. Stroke was determined according to the World Health Organization’s Multinational Monitoring of Trends and Determinants in Cardiovascular Diseases standard.9
Follow‑up visits were conducted via phone calls or the patients’ health status was confirmed using their health records with permission from the Review Board of Fuwai Hospital, and patients were followed for at least 1 year after discharge. Stroke was defined as a rapidly developing focal or widespread brain dysfunction that lasted for more than 24 hours or caused death, excluding nonvascular causes (eg, trauma, metabolic disorders, tumors, and any neurological abnormalities due to central nervous system infection). In this study, cases of ischemic stroke included those of cerebral thrombosis and cerebral embolism. A hemorrhagic stroke included subarachnoid hemorrhage and intracranial hemorrhage; transient ischemic attack and chronic cerebrovascular disease were not included in the analysis. Investigators collected data from computed tomography and magnetic resonance imaging of the head, and hospital records of patients during their hospitalization.
The study was approved by the Ethics Committee of Fuwai Hospital (2016‑I2M‑1‑009), and all patients provided informed consent for coronary angiography and primary PCI.
Statistical analysis
The normal distribution of outcome variables was confirmed using the Kolmogorov–Smirnov test. Continuous data were presented as medians (interquartile ranges [IQRs]) for normal or nonnormal distribution. The intergroup differences were analyzed using the Mann–Whitney test or the independent sample t test. Categorical data were described as numbers (percentages) and were compared using the Pearson χ2 test or the Fisher exact test, as appropriate. All variables included in the new prediction model were prespecified. A univariable Cox regression analysis was conducted to initially screen candidate factors for predicting stroke with a P value of less than 0.8. These included variables required for calculating the risk of major adverse cardiovascular events (ie, sex, age, diabetes status, atrial fibrillation [AF], history of coronary artery bypass grafting, history of hypertension, history of PCI, levels of high‑density lipoprotein cholesterol, lipase activator, and low‑density lipoprotein cholesterol, estimated glomerular filtration rate, triglycerides, and coronary angiography results). The least absolute shrinkage and selection operator method (LASSO; Tibshirani [1996]), employed for further screening of the independent variables, was included in the Cox regression model so as to obtain the simplification and reduction of the model. The LASSO method is used to obtain a relatively refined model by constructing a penalty function, which compresses some coefficients and sets some coefficients to zero. Therefore, it retains the advantage of subset contraction and is a slightly biased estimation for processing data with multicollinearity to prevent overfitting. The selection of parameters was based on previous clinical practice experience, with reference to relevant literature10,11 and in combination with the results of univariable Cox regression analysis. We used multiple imputations with automated variable selection to account for missing values.
Depending on the regression coefficient of the selected independent variables, the corresponding nomogram model was drawn. For variables selected in the nomogram model, the values of particular variables corresponded to different scores on the integral line at the top of the nomogram through the projection of the vertical line, and the total score could be obtained by adding up the scores corresponding to the values of each variable. The cumulative probability of the occurrence of cerebrovascular events in 5 years could be obtained from the total score on the prediction line at the bottom of the nomogram (range, 0–200 points). To reduce overfitting bias, the self‑sampling method was used to verify the nomogram model. Model discrimination was quantified by Harrell C statistic and calibration chart. The receiver operating characteristic (ROC) curve was drawn. We calculated the total risk score for each participant and divided them into low- and high‑risk groups based on the median of the total score. A Kaplan–Meier survival analysis was conducted for the 2 groups and the discrepancy results of the analysis were exported. The LASSO method adopts the “glmnet” package of the R language for variable selection, as well as the “rms” package of the R language for drawing and internal validation of the nomogram (calibration chart). Cox regression analysis was performed using the survival package. The accuracy of the new prediction model and the CHA2DS2-VASc score in predicting cerebrovascular events was evaluated according to the area under the ROC curve (AUC) and was compared with a nonparametric test developed by DeLong et al.12
Baseline survival probabilities of each model were obtained with commands that were utilized to fit the models. The calibration performance was graphically assessed to predict the 5‑year risk of cerebrovascular events and plot the predicted 5‑year risk against the observed 5‑year risk. A diagonal line with a slope of 1 represented perfect calibration. The observed 5‑year risk was obtained via the Kaplan–Meier method, and the slopes for regression lines comparing the predicted 5‑year risk to the observed 5‑year risk were calculated. Standard statistical metrics of the model and discrimination performance (R2, Harrell C statistic) were calculated. The calibration and discrimination performance of equations developed in the derivation subcohort were assessed in the validation subcohort and compared with the performance of models developed in the entire cohort; baseline survival functions and hazard ratios were also compared. The degree of calibration was represented by a calibration graph.
Statistical tests were performed using the SPSS, version 20.0 (IBM Corp, Armonk, New York, United States), the R Programming Language I 386 3.6, and MedCalc, version 18.2.1 (MedCalc Software, Ostend, Belgium). All P values were 2‑tailed, and statistical significance was set at P of less than 0.05.
Results
Demographics of patients in the derivation and validation cohorts
The study population comprised 4151 men and women aged 24 to 97 years at the time of their first predicted risk assessment between January 1, 2010 and June 30, 2017 (Figure 1). Due to the lack of follow‑up data, 48 patients were excluded from the study and 4103 individuals remained (3582 patients with ST‑segment elevation myocardial infarction and 521 patients with non–ST‑segment elevation myocardial infarction). A total of 2875 and 1228 individuals were randomly allocated to the derivation and validation cohorts, respectively. Furthermore, 55 participants (1.9%) in the derivation cohort and 14 participants (1.1%) in the validation cohort experienced a cerebrovascular event during follow‑up. The characteristics of participants are outlined in Table 1.
Variable | Derivation cohort (n = 2875) | Validation cohort (n = 1228) | P value |
Continuous variables are presented as median (interquartile range) and categorical variables, as number (percentage).
Abbreviations: ACEI, angiotensin‑converting enzyme inhibitor; ARB, angiotensin receptor blocker; CABG, coronary artery bypass grafting; CKD, chronic kidney disease; DBP, diastolic blood pressure; eGFR, estimated glomerular filtration rate; HDL‑C, high‑density lipoprotein cholesterol; hs‑CRP, high‑sensitivity C‑reactive protein; LDL‑C, low‑density lipoprotein cholesterol; PCI, percutaneous coronary intervention; PTCA, percutaneous transluminal coronary angioplasty; SBP, systolic blood pressure | |||
Age, y | 59 (51–67) | 60 (52–68) | 0.04 |
Male sex | 2273 (79.1) | 949 (77.3) | 0.2 |
Height, cm | 170 (164–173) | (164–173) | 0.21 |
Weight, kg | 74 (65–81) | 73.5 (65–81) | 0.1 |
Heart rate, bpm | 76 (67–86) | 75 (66–85) | 0.62 |
SBP, mm Hg | 123 (112–135) | 122 (110–136) | 0.056 |
DBP, mm Hg | 74 (66–81) | 74 (65–83) | 0.36 |
Medical history | |||
Hypertension | 1765 (61.4) | 742 (60.4) | 0.56 |
Diabetes | 941 (32.7) | 406 (33.1) | 0.84 |
Hyperlipidemia | 2661 (92.6) | 1127 (91.8) | 0.39 |
Previous PCI | 401 (13.9) | 164 (13.4) | 0.61 |
Previous CABG | 30 (1) | 18 (1.5) | 0.25 |
Atrial fibrillation | 186 (6.5) | 67 (5.5) | 0.22 |
CKD | 227 (7.9) | 101 (8.2) | 0.72 |
Laboratory examinations | |||
HDL‑C, mmol/l | 1.4 (1.0–2.0) | 1.5 (1.1–2.0) | 0.15 |
LDL‑C, mmol/l | 2.7 (2.1–3.3) | 2.7 (2.2–3.3) | 0.16 |
Triglycerides, mmol/l | 1.0 (0.9–1.2) | 1.0 (0.9–1.2) | 0.56 |
Lipase activator, g/l | 183.7 (88.5–357.5) | 184.2 (86.3–367.6) | 0.91 |
hs‑CRP, mg/l | 7.2 (2.8–12.1) | 7.6 (2.6–12.0) | 0.79 |
D‑dimer at baseline, mg/l | 0.3 (0.2–0.6) | 0.3 (0.2–0.5) | 0.366 |
Creatinine, μmol/l | 78.1 (68.5–90.5) | 78.8 (67.2–91.5) | 0.87 |
eGFR, ml/min/1.73 m2 | 85.1 (70.0–97.8) | 83.8 (69.1–99.4) | 0.86 |
Discharge medication regimen | |||
Statin | 2609 (93.6) | 1113 (93.7) | 0.9 |
Aspirin | 2762 (99.1) | 1174 (98.8) | 0.48 |
ACEI | 1725 (61.9) | 731 (61.5) | 0.84 |
ARB | 248 (8.9) | 102 (8.6) | 0.75 |
β-Blockers | 2419 (86.8) | 1050 (88.4) | 0.16 |
Diuretic | 822 (88.4) | 328 (27.6) | 0.23 |
Spironolactone | 612 (21.9) | 253 (21.3) | 0.65 |
P2Y12 inhibitors | 2770 (99.3) | 1174 (98.8) | 0.08 |
End point events | |||
Stroke | 55 (1.9) | 14 (1.1) | 0.1 |
Triple‑vessel lesions | 1201 (43.1) | 505 (42.5) | 0.74 |
PTCA | 2444 (85) | 1053 (85.7) | 0.56 |
Outcome events were obtained exclusively from follow‑up databases between August 3, 2010 and March 11, 2019. No statistical differences in age, sex, heart rate, body mass index, BP, history of the disease, laboratory examination, discharge medication regimen, and incidence of end point events were noted between the 2 groups.
Primary screening by the univariable Cox regression analysis and the LASSO method
We included both continuous and categorical values of age, history of hypertension, DM, AF, triple‑vessel lesions, target lesion involving branches, creatinine, BP group, and other variables as candidate parameters with a P value of less then 0.8 in the univariable Cox regression model (Supplementary material, Table S1). These variables were filtered using the LASSO regression method. The filtering and cross‑validation processes for independent variables are presented in Supplementary material, Figure S1A and S1B, respectively. Lambda.min is the lambda value of the optimal efficiency model in the standard error range that provides a model with excellent performance. At this time, a total of 4 independent variables, namely, the age groups, history of AF, history of hypertension, and target lesions involving branches were included in the prediction model.
Establishment of the risk prediction score model
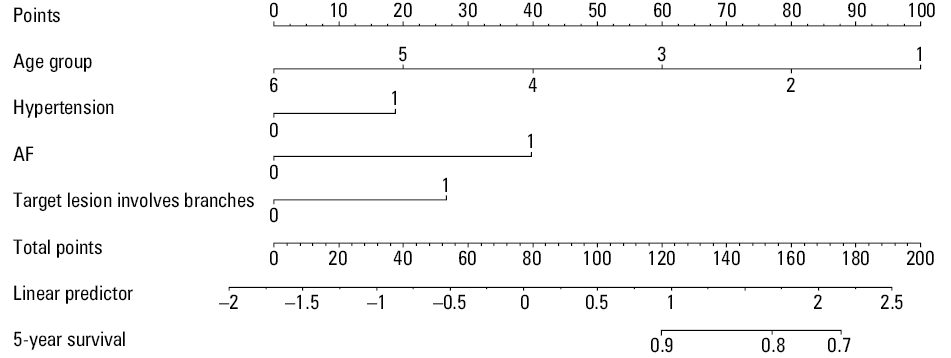
For variables selected in the nomogram model, the values of different variables could correspond to different scores on the integral line at the top of the nomogram through the projection of the vertical line, and the total score could be obtained by adding up the scores corresponding to the values of each variable. Points for the score (range, 0–200) were assigned as follows. Patients were categorized into 6 groups according to age (≤40 years, >40 years and ≤50 years, >50 years and ≤60 years, >60 years and ≤70 years, >70 years and ≤80 years, and >80 years) based on a study similar to ours that examined the risk of stroke after MI and PCI,13 and in the nomogram model, these groups were assigned 100, 80, 60, 40, 20, and 0 points, respectively. Furthermore, the prediction scores for history of hypertension, history of atrial fibrillation and the target lesion involving branches were 18.7, 39.8, and 26.7 points, respectively.
Model and discrimination metrics indicated that the risk equations performed excellent in predicting long‑term (5‑year) risk of cerebrovascular events. With the increase in the total score of the nomogram model, the corresponding 5‑year risk of ischemic stroke increased (Figure 2).
Model discrimination was quantified by Harrell C statistic and calibration chart. The predicted versus observed 5‑year risk plots for cerebrovascular events using the risk prediction model showed excellent calibration performance (Figure 3A and 3B).
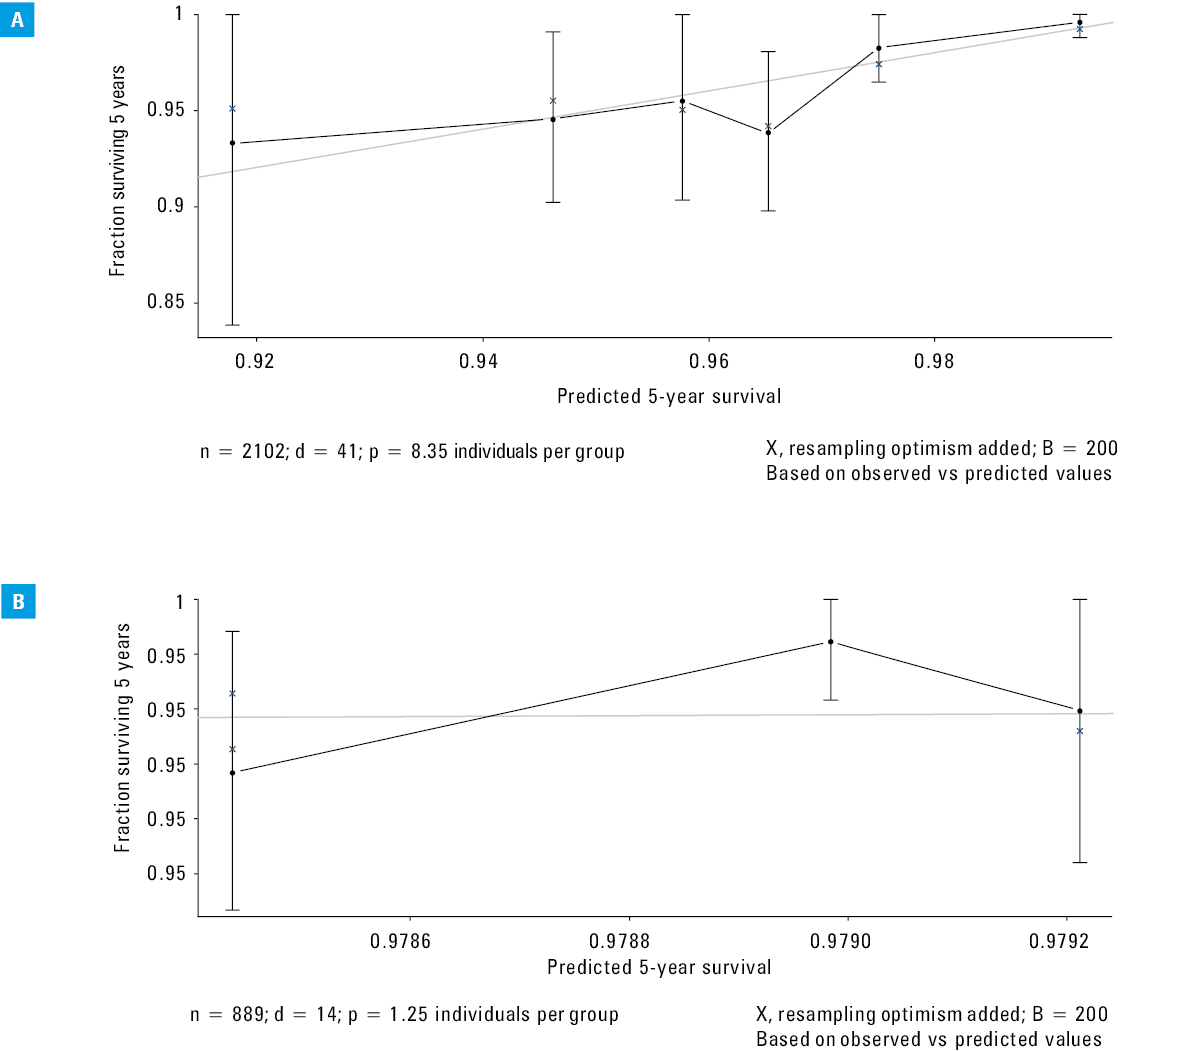
Abbreviations: B, bootstrap validation; d, datalist; n, sample size; p, population proportion
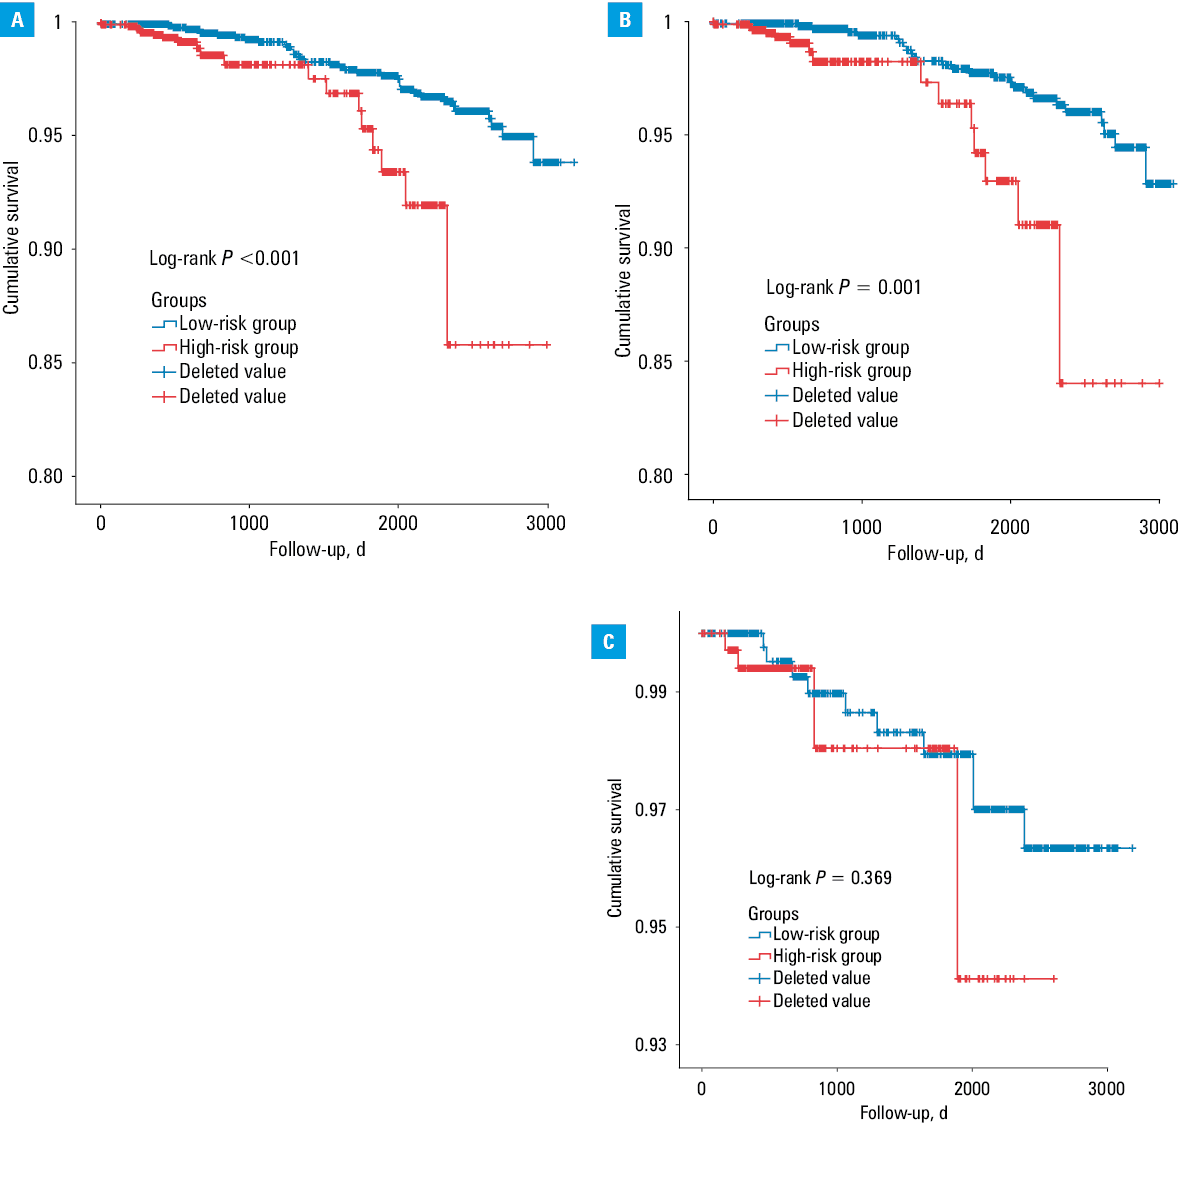
We conducted a Kaplan–Meier survival analysis (Figure 4) for the low- and high‑risk groups and exported the discrepancy result of the analysis. Both groups showed significant differences in the total, derivation, and validation cohorts (P <0.001, P = 0.001, and P = 0.34, respectively). The ROC curves for the discriminatory value of the 5‑year evaluation performance of the risk prediction model in the derivation and validation cohorts are shown in Figure 5. The AUCs were 0.826 (sensitivity, 84.78%; specificity, 65.18%) and 0.846 (sensitivity, 71.43%; specificity, 90.29%) for the derivation and validation cohorts, respectively.
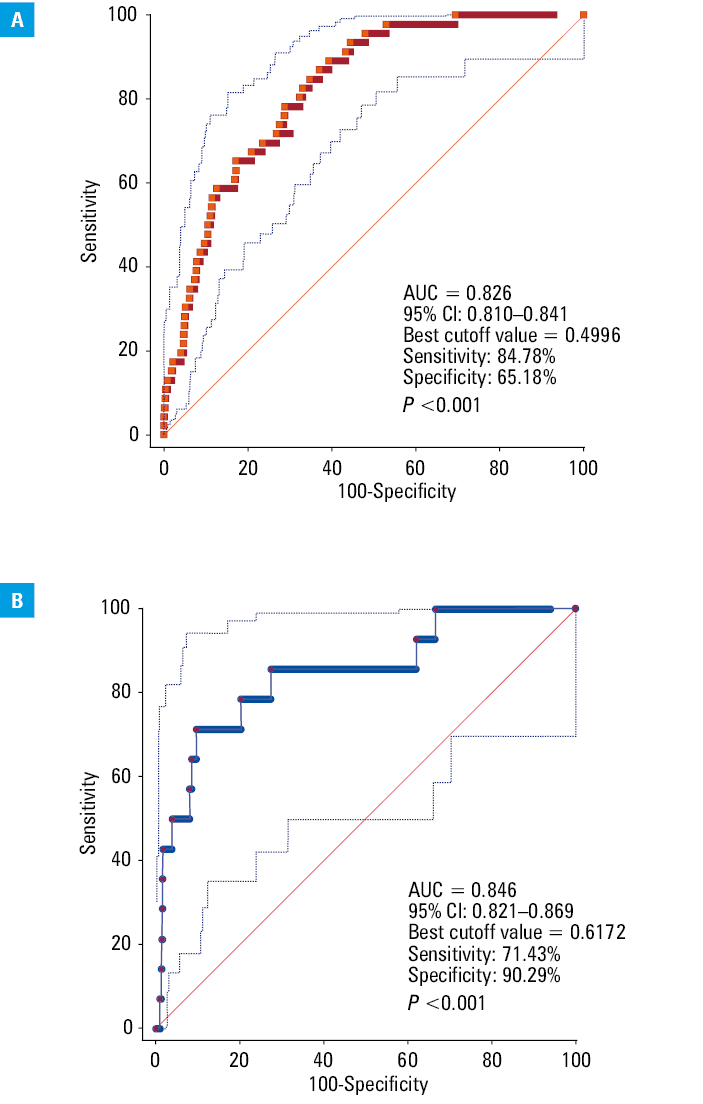
Abbreviations: AUC, area under the curve
Discussion
We analyzed data of over 4000 patients undergoing primary PCI included in the Fuwai Hospital and National Center for Cardiovascular Diseases PCI database. Patients undergoing primary PCI frequently have a worse risk profile than elective patients. We identified prior history of hypertension, dyslipidemia, history of atrial fibrillation, and a target lesion involving branches as common independent risk factors for predicting the incidence of long‑term ischemic stroke. Furthermore, the results of this study demonstrated higher stroke rates for patients aged under 40 years, and counterintuitively, lower stroke rates among patients aged over 40 years in the long‑term follow‑up after PCI. Significantly, the risk factors for stroke in the long term (5 years) (including chronic risk factors and chronic disease) following primary PCI differed from those in the immediate periprocedural period (including procedure‑related atherothrombotic embolization or use of antithrombotic agents). However, there are limited data addressing the risk factors predicting the long‑term incidence of ischemic stroke among patients who undergo primary PCI. Therefore, the management and assessment of this particular patient population should be individualized and precise to ensure a sustainable development of the contemporary healthcare system.
To our best knowledge, our study is the first to develop and validate a risk model for stroke prediction that is suitable for patients with acute MI who had undergone primary PCI from a large‑scale national perspective. The robustness of our results was confirmed through rigorous statistical analysis: LASSO regression, ROC curve analysis, nomogram model, calibration graph, and Kaplan–Meier survival analysis. To evaluate the further 5‑year risk probability of stroke in patients with MI who had undergone primary PCI, we developed a risk prediction score project that could be used by both primary care physicians and specialists to enhance risk assessment and management.
Risk indicators were identified from among routinely available clinical variables and data obtained from coronary angiography to maximize the clinical application of the nomogram in the well‑characterized and large cohort of patients with acute coronary syndrome undergoing primary PCI. Atrial fibrillation (AF) and hypertension were observed as independent risk factors characteristic of thrombotic cerebrovascular events in the current study; this is consistent with other data sets,14,15 including the Patterns of Non Adherence to Anti‑Platelet Regimen in Stented Patients registry cohort and the established or stable ischemic heart disease practice guidelines. Similar results were observed in the previous studies,16 and AF emerged as the common predictor for both thrombotic and bleeding events. Luke et al17 previously reported that risk factors such as age, AF, female sex, Killip classification, and chronic disease could predict stroke incidence after PCI, which is generally in accordance with the classic risk variables in the general population.18,19 Furthermore, previous analyses showed that valvular heart disease, which mostly results in AF, is one of the most principal predictive factors for ischemic stroke complications,20 which is in keeping with the conclusion of our study. Diseases such as AF‑related cardiogenic embolism and a proinflammatory state may extend to the cerebral vasculature from the coronary artery.21 A prior analysis of APEX research data22 concluded that new‑onset AF was independently correlated with mortality and was an index of adverse end points in individuals undergoing primary PCI. The authors of this study also concluded that patients with AF are more fragile and usually have more complications during (external) hospitalization. Hence, it is crucial to account for confounding elements when evaluating the relevance of AF with respect to long‑term outcomes. Furthermore, we identified age, particularly that of under 40 years or between 40 and 50 years, as a risk factor for cerebrovascular events following primary PCI. In the present study, patients were categorized into 6 groups according to age (≤40 years, >40 years and ≤50 years, >50 years and ≤60 years, >60 years and ≤70 years, >70 years and ≤80 years, and >80 years) and in the nomogram model, these groups were assigned 100, 80, 60, 40, 20, and 0 points, respectively. The results of our analysis suggest that age is among the strongest predictors of stroke complications. Additionally, our results are consistent with those of the study by Luke et al,17 who reported a maximum incidence rate ratio of 28.1 for age ranging from 35 to 39 years compared with an incidence rate ratio of 0.65 for age of more than 85 years. The potential explanations for this result are as follows. For frail, elderly patients or those with multiple morbidities, clinicians may be less likely to conduct primary PCI; therefore, the results reflect a more robust elderly population. Furthermore, risk factors are monitored and controlled more closely following primary PCI among the elderly than in younger patients. Previous studies23,24 also illustrated that patients receiving primary PCI therapy have characteristics that are distinct from those of other individuals with stroke in the general population. Patients aged over 80 years were more often female and showed lower rates of dyslipidemia and smoking, which are risk factors for stroke, than nonelderly patients. Fuchs et al25 suggested the potential association between a history of hypertension and stroke. Administration of a contrast medium during PCI may be complicated by transient or ongoing deterioration in renal function. The pathogenesis of kidney injury is not yet completely understood, and multiple mechanisms may be involved, including sustained intrarenal vasoconstriction, direct cytotoxic effect of the contrast medium, renal medullary hypoxia, ischemic injury, oxidative stress, and inflammation.26,27
Furthermore, we identified that bifurcation lesion of the target artery was a risk factor for cerebrovascular events, which has also been confirmed by several studies.28,29 Chen et al30 enrolled 212 patients with 230 true bifurcation lesions treated by crush stenting with drug‑eluting stents and concluded that the location of bifurcation lesions correlated with the clinical outcome. In the present study, BP on admission was divided into 5 groups and the risk coefficient increased with BP. The relationship between BP on admission and long- and short‑term outcomes in patients with acute MI who had undergone primary PCI is well documented,31,32 which corroborates the conclusion of the present study.
Hypertension, AF, dislodgement of atherosclerotic debris from the aorta, and aggressive anticoagulant and / or antiplatelet treatment regimens may increase the risk of hemorrhagic stroke by acting on the platelet‑mediated process of a thrombus.33 Defining the long‑term risk of stroke and its clinical implications is of paramount importance in an era where patients are fully informed of the treatment options and are actively included in the decision‑making process. In our pervious study,34 we created a model to evaluate the major adverse cardiovascular events among patients with MI who underwent primary PCI with a derivation and validation study using the same cohort. Therefore, we believe that the statistical methods are reliable, and that the results of this study can be applied in clinical practice. The present scores reflect a good calibration between the actual and perceived risk. Thus, this study provides decision‑supporting tools to guide out‑of‑hospital post‑PCI care, and creates an opportunity to enhance the quality and processes of post–primary PCI care.
Strengths and limitations
Our study has several strengths. The models presented in this study incorporated variables such as routine clinical data, serum inflammatory markers, coronary angiography results, and other relevant clinical parameters that are commonly considered in clinical assessment. The Fuwai Hospital and National Center for Cardiovascular Diseases PCI database contains an overwhelming majority of primary PCI procedures performed in Beijing and reflects a real‑world experience. Therefore, the present study included high‑risk individuals encountered in daily interventional practice who were frequently excluded from randomized controlled trials. The variables included in the model are routinely recorded in electronic health records; hence, collection of data on these variables does not incur additional costs. Nonetheless, our study has several limitations that should be noted. Imaging of cerebral hemorrhage and cerebral ischemia to comprehend the mechanism of stroke and identify factors inducing cerebrovascular events was insufficient. Cerebrovascular events were determined by contacting the participants, followed by validation through medical records. While this method had probably enabled inclusion of almost all cases of hemorrhagic and ischemic strokes, it might have undervalued stroke incidence if the patients were asymptomatic and not admitted to the hospital.
Conclusion
In summary, we presented risk prediction models for estimating the long‑term risk of ischemic stroke based on clinical parameters that are commonly available in all individuals with MI who had undergone primary PCI. These models can be implemented alongside further medical investigations to support therapeutic decision‑making. Further independent evaluation is required in different settings including geographic locations and healthcare organizations to guide the application of these models in clinical management and practice.
- Ibanez B, James S, Agewall S, et al. 2017 ESC Guidelines for the management of acute myocardial infarction in patients presenting with STsegment elevation: the Task Force for the management of acute myocardial infarction in patients presenting with ST‑segment elevation of the European Society of Cardiology (ESC). Eur Heart J. 2018; 39: 119‑177.
- Alkhouli M, Alqahtani F, Tarabishy A, et al. Incidence, predictors, and outcomes of acute ischemic stroke following percutaneous coronary intervention. J Am Coll Cardiol Intv. 2019; 12: 1497‑1506. | Crossref
- Chandiramani R, Chen H, Aoi S, et al. Incidence, predictors and impact of stroke on mortality among patients with acute coronary syndromes following percutaneous coronary intervention – results from the PROMETHEUS registry. Catheter Cardiovasc Interv. 2020; 95: 885‑892. | Crossref
- Svilaas T, Vlaar PJ, van der Horst IC, et al. Thrombus aspiration during primary percutaneous coronary intervention. N Engl J Med. 2008; 358: 557‑567. | Crossref
- Vlaar PJ, Svilaas T, van der Horst IC, et al. Cardiac death and reinfarction after 1 year in the thrombus aspiration during percutaneous coronary intervention in acute myocardial infarction Study (TAPAS): a 1‑year follow‑up study. Lancet. 2008; 371: 1915‑1920. | Crossref
SUPPLEMENTARY MATERIAL
ARTICLE INFORMATION