Genotype-specific versus pangenotypic regimens in patients infected with hepatitis C virus genotype 1b in real-world settings
Key words: direct-acting antivirals, genotype 1b, hepatitis C virus, pangenotypic


 CC BY-NC-SA 4.0
Genotype-specific versus pangenotypic regimens in patients infected with hepatitis C virus genotype 1b in real-world settings
Introduction: The introduction of direct‑acting antivirals (DAAs) has provided us with hope to eliminate hepatitis C virus (HCV) infection as a significant public health problem in the coming years.
Objective: Our study aimed to compare the effectiveness and safety of genotype‑specific and pangenotypic regimens in genotype 1b–infected patients treated in real‑world settings.
Patients and methods: Patients were selected from 990 HCV‑infected individuals treated with DAAs in the Department of Infectious Diseases in Kielce, Poland, who had the therapy initiated between July 1, 2015 and December 31, 2020.
Results: A total of 795 genotype 1b–infected patients with a median age of 51 years, female predominance (55%), and a 21.1% rate of cirrhosis were included in the analysis. A total of 69.9% of patients were treated with genotype‑specific regimens. Those patients were significantly older, more often were treatment experienced, and had advanced liver fibrosis and cirrhosis compared with patients assigned to pangenotypic regimens. An overall sustained virologic response rate of 97.9% in the intention‑to‑treat (ITT) analysis and 99% after excluding nonvirologic nonresponders was achieved, with no significant difference between patients in the 2 treatment arms. Significantly higher proportions of men (P = 0.001) and DAA‑experienced patients (P = 0.049) were documented among virologic nonresponders.
Conclusions: We confirmed very high effectiveness and a good safety profile of both genotype‑specific and pangenotypic regimens used in patients with genotype 1b HCV infection, and we found no differences between these 2 generations of medications. Male sex and previous treatment with DAAs were identified as negative predictors for therapy effectiveness.
What's new?
The introduction of direct‑acting antivirals has provided us with hope to eliminate hepatitis C virus infection as a significant public problem in upcoming years. This study compared genotype‑specific and pangenotypic regimens in patients with genotype 1b infection, which is the most common genotype in Poland. We have confirmed very high effectiveness and a good safety profile with no significant differences between these 2 generations of drugs. Male sex and previous treatment with direct‑acting antivirals were identified as negative predictors of therapy efficacy. To the best of our knowledge, the presented results of our research are the only study of this type so far, comparing the effectiveness and safety of both generations of drugs within a single protocol carried out by the same researchers.
Introduction
According to the most recent estimates by the World Health Organization, approximately 71 million people worldwide are infected with hepatitis C virus (HCV).1 HCV infection seems to be one of the leading causes of chronic liver diseases, with a risk of severe complications. Nearly 400 000 patients die annually due to liver cirrhosis and hepatocellular carcinoma.1 Six main HCV genotypes (GT) and multiple subtypes have been identified based on the phylogenetic diversity.2 The most prevalent at a global level is GT1, accounting for nearly half of all HCV cases worldwide, followed by GT3 and GT4 with an estimated 25% and 15% frequency, respectively.2 The highest incidence of GT1 infections, exceeding 80% of patients with HCV, is documented among Polish patients, with subtype b being the most prevalent.3 In the era of treatment with pegylated interferon α (PegIFNα) and ribavirin (RBV), the HCV genotype was recognized as the most important predictor of the treatment outcome, and GT1‑infected patients were considered “difficult to treat” with an efficacy rate below 50% compared with the significantly higher effectiveness of 75% achieved among those with GT3 infection.4 In 2011, the first direct‑acting antivirals (DAAs), telaprevir (TVR) and boceprevir (BOC), were registered for use with PegIFNα and RBV in patients with GT1 infection. Triple regimens have increased the rate of sustained virologic response (SVR) in patients with GT1 but also worsened the safety profile, particularly in cirrhotic patients, who still demonstrated a low efficacy.5 The implementation of IFN‑free genotype‑specific regimens has substantially improved the safety profile and increased the treatment efficacy in GT1‑infected patients up to 100%, thus raising prospects to achieve the goal established by the World Health Organization to eliminate HCV as a significant public threat by 2030.1 In 2018, the pangenotypic regimens were introduced as a final stage of the revolution in the antiviral therapy of chronic hepatitis C, which simplified the treatment course. The introduction of pangenotypic drugs was a breakthrough in the treatment of HCV infections. Although the usefulness of these drugs has been confirmed in clinical trials, research comparing the effectiveness and safety of genotype‑specific and pangenotypic therapies has not been reported before.
Our study aimed to compare the effectiveness and safety between genotype‑specific and pangenotypic regimens in GT1b‑infected patients treated in real‑world experience (RWE) settings.
Patients and methods
Study population
The study population was selected from 990 patients infected with HCV and treated with DAAs in the Department of Infectious Diseases in Kielce, Poland, who had the antiviral therapy initiated between July 1, 2015 and December 31, 2020. The sole inclusion criterion was the identification of the GT1b HCV. The treating physician chose the therapeutic regimen according to the therapeutic program of the Polish National Health Fund (Narodowy Fundusz Zdrowia [NFZ]) and in line with the recommendations of the Polish Group of Experts for HCV.6 Drug doses and the treatment duration were consistent with the summary of product characteristics of each medication.
Data collection
Data were collected retrospectively from the hospital database. Patients provided informed consent prior to the start of treatment according to the requirements of the NFZ. Baseline patient characteristics included demographic and clinical data: sex, age, body mass index, the severity of liver disease, coinfection with hepatitis B virus and HIV, presence or absence as well as type of extrahepatic manifestations of HCV, history of previous antiviral therapies, information on comorbidities and concomitant medications. Baseline laboratory parameters included serum alanine transaminase activity, concentrations of bilirubin, albumin, creatinine, and hemoglobin, platelet count, and HCV viral load. In addition, HCV RNA was assessed at the end of treatment and at least 12 weeks following the therapy completion.
Assessment of liver disease severity
The severity of liver disease was assessed noninvasively by shear wave elastography using Aixplorer equipment (SuperSonic Imagine, Aix‑en‑Provence, France). Based on liver stiffness, fibrosis stage was defined from F0 to F4 according to the METAVIR score using the guidelines of the European Association for the Study of the Liver. The cutoff values of 9 and 13 kPa were used for the prediction of F3 and F4, respectively.7 Advanced liver fibrosis was diagnosed as stage F3. Patients with stage F4 were identified to be cirrhotic and subsequently classified according to the Child‑Pugh score and the Model for End‑Stage Liver Disease. Patients with liver cirrhosis were also evaluated for the presence of esophageal varices and data on past or present hepatic decompensation as well as the history of hepatocellular carcinoma and liver transplantation were collected.
Efficacy assessment
The efficacy end point was the SVR, defined as undetectable HCV RNA at least 12 weeks after completion of treatment. The Xpert HCV Viral Load real‑time assay with the lower limit of detection of 10 IU/ml was used. Patients with detectable viremia 12 weeks after completion of treatment were considered virologic nonresponders, whereas patients with no HCV RNA assessment at this time point, due to loss to follow‑up, were nonvirologic failures.
Safety assessment
Safety data were collected through a treatment course and a 12‑week follow‑up period. We gathered data on the occurrence of adverse events (AEs), including severe AEs and deaths, as well as the modification or discontinuation of the therapy course. Adverse events of special interest associated with deterioration of the liver function, such as gastrointestinal bleeding, ascites, and encephalopathy, were reported in patients with liver cirrhosis.
Statistical analysis
Categorical data were summarized by frequencies and percentages. Group comparisons were performed using the χ2 test or the Fisher exact test for categorical variables and the Mann–Whitney test for continuous, non‑normally distributed variables (normality of distribution was checked with the Shapiro–Wilk test). In the multiple comparisons of treatment efficacy according to the treatment regimen, the Bonferroni correction was applied. A 2‑tailed P value of less than 0.05 was considered statistically significant. Nonresponse to antiviral therapy was modeled by univariable logistic regression, and the odds ratios and 95% CIs were calculated. Continuous data were presented as medians and interquartile ranges as well as minimum and maximum values. All statistical analyses were performed using the R software package, version 4.0.3 (the R Foundation, Vienna, Austria).
Ethics
This observational study was conducted in real‑world settings with approved drugs. Patients were not exposed to any experimental interventions, nor did the study intervene with the patient’s clinical management. The study only collected information from patient medical records. The analysis included routine examinations and tests performed in patients treated within the therapeutic program of the NFZ. The data were originally collected to assess treatment efficacy and safety in individual patients, not for scientific purposes. Hence, the treating physicians did not obtain approval from the ethics committee. According to the local law (the Polish Pharmaceutical Law of September 6, 2001, art. 37al), noninterventional studies do not require an approval of an ethics committee. Furthermore, the requirement for patient consent was waived due to the retrospective design of the study.
Results
Patient characteristics
The study population included 795 patients with a median age of 51 years and female predominance (55%), 21.1% of whom were diagnosed as cirrhotic. The majority of patients had comorbidities (78%), with arterial hypertension being the most frequent, followed by diabetes. Most of the patients included in the analysis were treatment‑naïve (79.5%), and equal proportions of nonresponders and relapsers were documented (8%) among those with a history of previous therapy. The majority of patients (69.9%) were treated with genotype‑specific regimens with the most common option of ombitasvir (OBV) / paritaprevir (PTV) / ritonavir (r) + dasabuvir (DSV) (OPrD) with or without RBV depending on the fibrosis status, followed by the combination of ledipasvir (LDV) and sofosbuvir (SOF) and dual therapy with grazoprevir (GZR) and elbasvir (EBR). Regarding the LDV/SOF therapy, patients without liver cirrhosis were treated for 8 or 12 weeks depending on the history of the previous treatment and the baseline viral load, whereas cirrhotic patients received an option with RBV for 12 weeks with 4 exceptions treated with LDV / SOF for 24 weeks due to RBV intolerance. Among patients assigned to the pangenotypic options, 69% were treated with glecaprevir (GLE) and pibrentasvir (PIB), whereas the remaining ones received the combination of SOF and velpatasvir (VEL) (Table 1).
Parameter | GT1b patients (n = 795) | ||
Data are presented as number (percentage) or median (IQR); minimum–maximum.
a 9 patients received the regimen for 8 weeks; 156 patients, for 12 weeks.
b 72 patients received the regimen for 12 weeks; 2 patients, for 24 weeks.
SI conversion factors: to convert ALT to μkat/l, multiply by 0.0167; bilirubin to μmol/l, by 17.104; albumin and hemoglobin to g/l, by 10.0; creatinine to μmol/l, by 88.4; platelets to × 109/l, by 1.0.
Abbreviations: ALT, alanine transaminase; ASV, asunaprevir; BMI, body mass index; DCV, daclatasvir; DSV, dasabuvir; EBR, elbasvir; F, fibrosis stage; GLE, glecaprevir; GT, genotype; GZR, grazoprevir; HCC, hepatocellular carcinoma; HCV, hepatitis C virus; HBsAg, hepatitis B surface antigen; HBV, hepatitis B virus; IQR, interquartile range; LDV, ledipasvir; MELD, Model End‑Stage Liver Disease; OBV, ombitasvir; OLTx, orthotopic liver transplantation; PIB, pibrentasvir; PTV/r, paritaprevir; RBV, ribavirin; SMV, simeprevir; SOF, sofosbuvir; VEL, velpatasvir | |||
Sex, female / male | 441 (55.5) / 354 (44.5) | ||
Age, y | All patients | 51 (36–63); 19–89 | |
Female sex | 55 (37–65); 19–88 | ||
Male sex | 46 (36–60); 19–89 | ||
BMI, kg/m2 | 25.4 (22.7–28.6); 15.6–45 | ||
Comorbidities | Any comorbidity | 621 (78.1) | |
Hypertension | 285 (35.8) | ||
Diabetes | 95 (11.9) | ||
Renal disease | 62 (7.8) | ||
Autoimmune diseases | 60 (7.5) | ||
Non‑HCC tumors | 41 (5.2) | ||
Other | 552 (69.4) | ||
Concomitant medications | 514 (64.7) | ||
Liver fibrosis | F0 | 38 (4.8) | |
F1 | 391 (49.2) | ||
F2 | 117 (14.7) | ||
F3 | 81 (10.2) | ||
F4 | 168 (21.1) | ||
History of hepatic decompensation | Ascites | 24 (3) | |
Encephalopathy | 11 (1.4) | ||
Documented esophageal varices | 74 (9.3) | ||
Hepatic decompensation at baseline | Moderate ascites – responded to diuretics | 17 (2.1) | |
Tense ascites – no response to diuretics | 2 (0.3) | ||
Encephalopathy | 5 (0.6) | ||
Child‑Pugh, score | B | 21 (2.6) | |
C | 4 (0.6) | ||
MELD | <15 | 763 (96) | |
15–18 | 23 (2.9) | ||
19–20 | 7 (0.9) | ||
>20 | 2 (0.2) | ||
HCC history | 7 (0.9) | ||
OLTx history | 3 (0.4) | ||
HBV coinfection (HBsAg+) | 4 (0.5) | ||
HIV coinfection | 1 (0.1) | ||
History of previous therapy | Treatment‑naïve | 632 (79.5) | |
Nonresponder | 65 (8.2) | ||
Relapser | 64 (8) | ||
Discontinuation due to safety reason | 34 (4.3) | ||
Treatment regimens | Genotype‑specific treatment regimens | ASV+DCV | 19 (2.4) |
SOF+SMV±RBV | 4 (0.5) | ||
LDV/SOF±RBV | 169 (21.3) | ||
OBV/PTV/r+DSV±RBV | 220 (27.7) | ||
GZR/EBR | 144 (18.1) | ||
Pangenotypic regimens | GLE/PIBa | 165 (20.7) | |
SOF/VEL±RBVb | 74 (9.3) | ||
Laboratory test results | |||
ALT, IU/l | 53.0 (35.0–89.5); 8.0–441.0 | ||
Bilirubin, mg/dl | 0.8 (0.6–1.0); 0.2–21.3 | ||
Albumin, g/dl | 4.1 (3.8–4.3); 2.3–5.0 | ||
Creatinine, mg/dl | 0.9 (0.8–1.0); 0.4–7.4 | ||
Hemoglobin, g/dl | 14.3 (13.3–15.3); 7.5–22.4 | ||
Parameter | GT1b patients, n = 795 | ||
Platelets, × 103/μl | 187.0 (143.5–230.0); 25.0–532.0 | ||
HCV RNA, × 106 IU/ml | 0.9 (0.3–2.5); 0.001–176.0 | ||
The sex distribution was similar in the 2 treatment arms. Patients in the genotype‑specific population were significantly older and had a higher rate of coexisting diseases (Table 2). A greater proportion of patients with advanced liver fibrosis and cirrhosis was documented among patients treated with genotype‑specific than with pangenotypic regimens (35.8% vs 20.9%; P <0.001). Patients in the genotype‑specific treatment arm had a significantly higher bilirubin concentration and lower albumin level, hemoglobin concentration, platelet count, and baseline viral load.
Parameter | Genotype‑specific regimens (n = 556) | Pangenotypic regimens (n = 239) | P value | |
Data are presented as number (percentage) or median (IQR); minimum–maximum.
SI conversion factors: see Table 1
Abbreviations: see Table 1 | ||||
Sex, female / male | 309 (55.6) / 247 (44.4) | 132 (55.2) / 107 (44.8) | 0.98 | |
Age, y | All patients | 54.0 (38.0–64.0); 20–89 | 44.0 (35.0–61.0); 19–81 | <0.001 |
Female sex | 57.0 (39.0–65.0); 24–88 | 44.0 (34.0–62.0); 19–80 | 0.01 | |
Male sex | 49.0 (37.0, 61.0); 20–89 | 43.5 (36.0, 58.0); 19–81 | 0.06 | |
BMI, kg/m2 | 25.5 (22.7, 28.7); 15.6–45 | 25.3 (22.7, 28.2); 17.5–41.3 | 0.29 | |
Comorbidities | Any comorbidity | 445 (80) | 176 (73.6) | 0.045 |
Hypertension | 203 (36.5) | 82 (34.3) | 0.55 | |
Diabetes | 74 (13.3) | 20 (8.4) | 0.07 | |
Renal disease | 42 (7.6) | 20 (8.4) | 0.69 | |
Autoimmune diseases | 47 (8.5) | 13 (5.4) | 0.14 | |
Non‑HCC tumors | 26 (4.7) | 15 (6.3) | 0.35 | |
Other | 404 (72.7) | 148 (61.9) | 0.003 | |
Concomitant medications | 374 (67.3) | 140 (58.6) | 0.02 | |
Liver fibrosis | F0 | 20 (3.6) | 18 (7.5) | |
F1 | 255 (45.9) | 136 (56.9) | ||
F2 | 82 (14.7) | 35 (14.6) | ||
F3 | 63 (11.3) | 18 (7.5) | ||
F4 | 136 (24.5) | 32 (13.4) | ||
Liver fibrosis F3–F4 | 199 (35.8) | 50 (20.9) | <0.001 | |
History of previous therapy | Treatment‑naïve | 409 (73.5) | 223 (93.3) | <0.001 |
Nonresponder | 62 (11.2) | 3 (1.3) | ||
Relapser | 56 (10.1) | 8 (3.3) | ||
Discontinuation due to safety reason | 29 (5.2) | 5 (2.1) | ||
HCC history | 7 (1.3) | 0 | 0.11 | |
OLTx history | 3 (0.5) | 0 | 0.56 | |
HBV coinfection (HBsAg+) | 4 (0.7) | 0 | 0.32 | |
HIV coinfection | 1 (0.2) | 0 | 1 | |
Laboratory test results | ||||
ALT, IU/L | 56.0 (36.0–91.0); 8.0–441.0 | 49.0 (34.0–86.5); 12.0–437.0 | 0.10 | |
Bilirubin, mg/dl | 0.8 (0.6–1.1); 0.2–14.5 | 0.7 (0.5–0.9); 0.3–21.3 | <0.001 | |
Albumin, g/dl | 4.0 (3.8–4.3); 2.3–5.0 | 4.1 (3.9–4.4); 2.5–4.9 | 0.01 | |
Creatinine, mg/dl | 0.9 (0.8–1.0); 0.4–7.3 | 0.8 (0.8–0.9); 0.5–7.4 | <0.001 | |
Hemoglobin, g/dl | 14.2 (13.3–15.2); 7.5–22.4 | 14.3 (13.5–15.5); 10.5–18.0 | 0.04 | |
Platelets, × 103/μl | 184.0 (135.0–227.2); 25.0–525.0 | 197.0 (156.5–237.5); 43.0–532.0 | 0.003 | |
HCV RNA, × 106 IU/ml | 0.8 (0.2–2.5); 0.001–74.7 | 1.1 (0.5–2.6); 0.004–176.0 | 0.008 | |
The detailed comparison conducted among 168 patients with liver cirrhosis revealed no significant differences between 136 individuals treated with the genotype‑specific regimen and 32 patients receiving pangenotypic options regarding demographics, comorbidities, laboratory parameters, and liver disease severity assessed by the rate of decompensation in the past and at baseline, classification on the Child‑Pugh score, and the presence of esophageal varices. The only exception was the history of previous therapy, which was reported in the patients treated with genotype‑specific DAAs, while all of those assigned to the pangenotypic options were treatment naïve (Supplementary material, Table S1).
A total of 778 patients responded to antiviral treatment, corresponding to the SVR rate of 97.9% in the ITT analysis, and 99% after exclusion of patients lost to follow‑up in per‑protocol (PP) analysis; 9 patients were lost to follow‑up, all in the genotype‑specific arm. Higher proportions of men (P = 0.01) and DAA‑experienced patients (P = 0.049) were documented in the group of virologic nonresponders (Table 3).
Parameter | Responders (n = 778) | Nonresponders (n = 8) | P value | ||
Data are presented as number (percentage) or median (IQR); minimum–maximum.
SI conversion factors: see Table 1
Abbreviations: DAA, direct‑acting antivirals; others, see Table 1 | |||||
Male sex | 343 (44.1) | 8 (100) | 0.001 | ||
Age, y | All patients | 51 (36–63); 19–89 | 51 (47–56.8); 31–59 | 0.91 | |
Female sex | 55.0 (36–65); 19–89 | – | – | ||
Male sex | 45 (36–60); 19–89 | 51 (47–56.8); 31–59 | 0.69 | ||
BMI (kg/m2) | 25.4 (22.6–28.6); 15.6–45.0 | 27.9 (27.3–28.7); 24.9–30.7 | 0.05 | ||
Regimen | Genotype‑specific | 541 (69.5) | 6 (75) | 1 | |
Pangenotypic | 237 (30.5) | 2 (25) | |||
Comorbidities | Any comorbidity | 605 (77.8) | 7 (87.5) | 1 | |
Hypertension | 279 (35.9) | 1 (12.5) | 0.27 | ||
Diabetes | 90 (11.6) | 2 (25) | 0.24 | ||
Renal disease | 59 (7.6) | 1 (12.5) | 0.47 | ||
Autoimmune diseases | 59 (7.6) | 0 | 1 | ||
Non‑HCC tumors | 40 (5.1) | 0 | 1 | ||
Concomitant medications | 498 (64) | 7 (87.5) | 0.27 | ||
Liver fibrosis | F0–F3 | 619 (79.6) | 4 (50) | 0.06 | |
F4 | 159 (20.4) | 4 (50) | |||
History of previous therapy | Treatment‑naïve | 619 (79.6) | 6 (75) | 0.67 | |
Treatment‑experienced | 159 (20.4) | 2 (25) | 0.67 | ||
DAA‑experienced | 4 (0.5) | 1 (12.5) | 0.049 | ||
HCC history | 6 (0.8) | 0 | 1 | ||
OLTx history | 3 (0.4) | 0 | 1 | ||
HBV coinfection (HBsAg+) | 4 (0.5) | 0 | 1 | ||
HIV coinfection | 1 (0.1) | 0 | 1 | ||
Laboratory test results | |||||
ALT, IU/L | 53.0 (35.0–89.0); 8.0–441.0 | 75.0 (64.5–92.8); 48.0–106.0 | 0.12 | ||
Bilirubin, mg/dl | 0.8 (0.6–1.0); 0.2–21.3 | 1.1 (0.9–1.3); 0.6–2.3 | 0.03 | ||
Albumin, g/dl | 4.1 (3.8–4.3); 2.5–5.0 | 3.8 (3.3–4.1); 2.5–4.8 | 0.16 | ||
Creatinine, mg/dl | 0.9 (0.8–1.0); 0.4–7.4 | 0.9 (0.8–1.2); 0.6–1.5 | 0.60 | ||
Hemoglobin, g/dl | 14.2 (13.3–15.3); 7.5–22.4 | 14.8 (13.8–15.8); 11.4–16.5 | 0.48 | ||
Platelets, × 103/μl | 187.0 (145.0–231.0); 25.0–532.0 | 140.5 (104.5–192.5); 43.0–224.0 | 0.08 | ||
HCV RNA, × 106 IU/ml | 0.9 (0.3–2.5); 0.001–176.0 | 1.1 (0.5–1.6); 0.3–6.1 | 0.92 | ||
Treatment efficacy
In the univariable analysis, previous treatment with DAA and a lower albumin level were negative predictors of the response to therapy (Supplementary material, Table S2). No significant difference in the response rate was found between patients treated with genotype‑specific regimen as compared with the pangenotypic regimen; the SVR rates were 97% versus 99% and 99% versus 99% in ITT and PP analyses, respectively. Lower efficacy was noted among patients with liver cirrhosis in both treatment arms as compared with individuals with fibrosis stages F0 to F3, but the difference did not reach statistical significance in PP analysis, with SVR of 98% versus 99% and 97% versus 99% in genotype‑specific and pangenotypic groups, respectively (Figure 1).
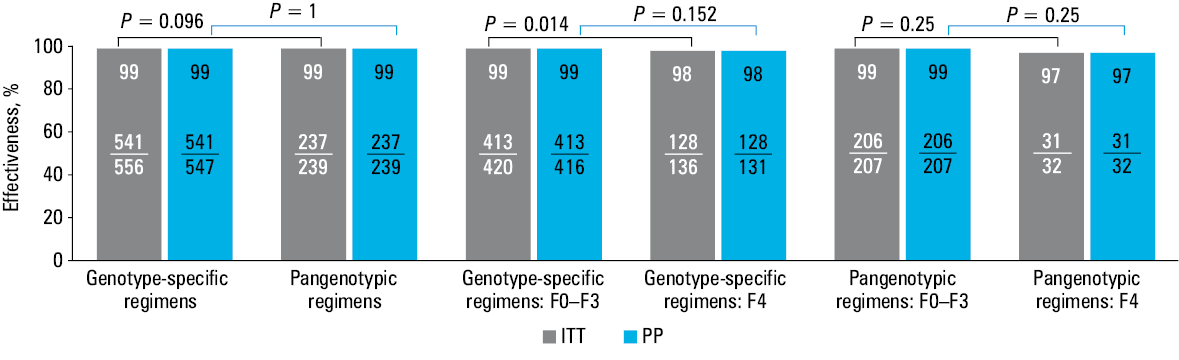
Abbreviations: ITT, intention to treat; PP, per protocol
Despite the lower value demonstrated for the combination of asunaprevir (ASV) and daclatasvir (DCV), no significant difference between options was found in the PP analysis (Table 4).
Treatment | ASV+DCV | SOF+SMV±RBV | LDV/SOF±RBV | OBV/PTV/r +DSV±RBV | GZR/EBR | GLE/PIB | SOF/VEL |
Data are presented as number / total number of patients (percentage).
a P values presented in square brackets are calculated for comparison with ASV+DCV regimen in ITT and PP, respectively.
b According to the Bonferroni correction, only a P value <0.0083 [0.05/6] is considered significant.
| |||||||
SVR ITT | 16/19 (84) | 4/4 (100); P = 1 | 164/169 (97); P = 0.04 | 217/220 (99); P = 0.007a | 140/144 (97); P = 0.03 | 164/165 (99); P = 0.003b | 73/74 (99); P = 0.03 |
SVR PP | 16/17 (94) | 4/4 (100); P = 1 | 164/166 (99); P = 0.25 | 217/219 (99); P = 0.20 | 140/141 (99); P = 0.20 | 164/165 (99); P = 0.18 | 73/74 (99); P = 0.34 |
There were 8 virologic nonresponders: 6 patients treated with genotype‑specific regimens, and 2 with pangenotypic regimens; half of them were individuals with fibrosis of F4, and 2 had the B score according to the Child‑Pugh classification (Table 5). All of them were male, and 6 (4 in the genotype‑specific and all in the pangenotypic groups) were treatment naïve. Two individuals were previously treated with a DAA‑containing regimen. A single patient was nonadherent to the therapy due to alcohol abuse; in the remaining individuals, the treatment was completed as scheduled.
Patient; age, y | Fibrosis, CP | Regimen | History of previous therapy | Baseline HCV RNA, IU/ml | Treatment course | EOT | Comment (possible reason for failure) |
Abbreviations: CP, Child‑Pugh scale; EOT, end of treatment; LDV, ledipasvir; TD, targed detected; TND, target not detected; others, see Table 1 | |||||||
Male 1; 48 | 1 | GZR/EBR, 12 weeks | Treatment‑naïve | 6 070 000 | According to schedule | TND | – |
Male 2; 44 | 1 | OBV/PTV/r+DSV, 8 weeks | Treatment‑naïve | 1 530 000 | According to schedule | TND | – |
Male 3; 56 | 2 | ASV+DCV, 24 weeks | Treatment‑naïve | 1 590 000 | According to schedule | TD | – |
Male 4; 59 | 4, CP‑A | OBV/PTV/r+DSV+RBV, 12 weeks | Nonresponder (pegIFN+RBV, TVR+pegIFN+RBV) | 580 000 | According to schedule | TD | Nonresponse to previous therapy, liver cirrhosis |
Male 5; 59 | 4, CP‑A | LDV/SOF+RBV, 12 weeks | Relapser (TVR+pegIFN+RBV, OBV/PTV/r+DSV+RBV) | 1 650 000 | According to schedule | TND | Relapse after previous therapy, liver cirrhosis |
Male 6; 54 | 4, CP‑B | LDV/SOF+RBV, 12 weeks | Treatment‑naïve | 251 000 | According to schedule | TND | Decompensated liver cirrhosis |
Male 7; 31 | 1 | GLE/PIB, 8 weeks | Treatment‑naïve | 528 400 | modified | TD | No adherence (irregular use of the drug due to alcohol abuse) |
Male 8; 48 | 4, CP‑B | VEL/SOF+RBV, 12 weeks | Treatment‑naïve | 314 000 | According to schedule | TND | Decompensated liver cirrhosis |
Safety
The safety profile was comparable in both treatment groups. The majority of patients completed the therapy course according to the schedule. In 8 patients, the therapy with a genotype‑specific regimen was discontinued, and in 4 it was modified; a single patient treated with a pangenotypic regimen was nonadherent to treatment. Adverse events leading to treatment discontinuation occurred only in 2 cases in the genotype‑specific arm. At least a single adverse event was reported, more often in patients treated with genotype‑specific regimens, but the difference was not significant. The most frequent AEs were weakness / fatigue followed by anemia, which was more frequent in the genotype‑specific arm and was associated with RBV usage. Six deaths, 3 during treatment and 3 in the follow‑up period, were reported in the genotype‑specific population, not related to antiviral drugs. Out of 18 serious AEs, 14 occurred in patients treated with genotype‑specific regimens (Table 6).
Parameter | Genotype‑specific regimens (n = 556) | Pangenotypic regimens (n = 239) | P value | |
Data are presented as number (percentage).
a 2 × AEs, 3 × death, 3 × patient’s decision
b 3 × RBV dosing,1 nonadherence
c Nonadherence
d Encephalopathy, dysplastic nodules in the liver, hepatocellular carcinoma, acute hepatitis, ALT elevation, gastrointestinal bleeding, severe thrombocytopenia, ptosis of the left eyelid, lung cancer, 2 × cerebral stroke, liver impairment, Clostridium difficile infection, head injury
e Diarrhea, arterial hypertension, balance disorders, myocardial infarction with pulmonary embolism
f Acute hepatitis, vomiting
g Hepatocellular carcinoma, liver impairment, gastrointestinal bleeding, cardiac arrest, cerebral stroke
Abbreviations: AE, adverse event; others, see Table 1 | ||||
Treatment course | According to schedule | 544 (97.9) | 238 (99.6) | 0.16 |
Therapy discontinuation | 8 (1.4)a | 0 | ||
Therapy modification (RBV dosing) | 4 (0.7)b | 1 (0.4)c | ||
Patients with at least one AE | 79 (14.2) | 23 (9.6) | 0.08 | |
Serious adverse events | 14 (2.5)d | 4 (1.7)e | 0.46 | |
AEs leading to therapy discontinuation | 2 (0.4)f | 0 | 1 | |
Most common AEs (≥2%) | Weakness / fatigue | 22 (4) | 10 (4.2) | 0.88 |
Anemia | 14 (2.5) | 1 (0.4) | 0.048 | |
AEs of particular interest (cirrhotics) | Ascites | 6 (4.4); n = 136 | 1 (3); n = 32 | 1 |
Hepatic encephalopathy | 3 (2.2); n = 136 | 1 (3); n = 32 | 0.57 | |
Gastrointestinal bleeding | 1 (0.7); n = 136 | 0; n = 32 | 1 | |
Death | 6 (1.1)g | 0 | 0.19 | |
Discussion
To the best of our knowledge, this is the first study to directly compare efficacy and safety of genotype‑specific versus pangenotypic treatment options for HCV infection. All comparisons presented in the discussion are based on indirect comparisons of publications in which one or the other group of drugs was analyzed. As far as we are aware, the present research is the only study of this type comparing the effectiveness and safety of both generations of drugs within a single protocol carried out by the same researchers.
The current single‑center RWE study documented the very high effectiveness of 99% in both genotype‑specific and pangenotypic regimens used in patients with GT1b infection. Treatment options changing along with the updated recommendations, the reimbursed therapeutic program and the drug availability resulted in a consistently high SVR rate which confirms the results of other RWE analyses.8 The negative predictors of response were male sex and the history of a previous IFN‑free DAA therapy; worse efficacy on average was also observed in patients with liver cirrhosis, but the difference was not statistically significant.
Among all assessed regimens, the lowest efficacy of 94% was reported in patients assigned to the combination of ASV+DCV; however, the difference was not significant in the PP assessment. Notably, in our analysis, the number of patients treated with the aforementioned regimen was small, resulting in a reduction in SVR with only a single nonresponder, a previously untreated male patient with moderate liver fibrosis. Due to the ASV registration issue, the use of this regimen intended only for the treatment of GT1b‑infected patients was limited to Asian and a few European countries, including Poland, and the cure rate was even lower than in our analysis and did not exceed 90%.9
The most numerous group of patients was assigned to the OPrD±RBV option, which was historically the first genotype‑specific regimen available in Poland. The first available RWE results described Polish patients treated in the AMBER study, and 99% of patients infected with GT1b responded to treatment. Only 2 treatment failures were reported, both had liver cirrhosis and were null‑responders to a previous pegIFN+RBV therapy.10 The high cure rate of 95% to 100% with this DAA combination in GT1b‑infected patients regardless of liver fibrosis and the history of previous therapy was confirmed by numerous clinical trials, and these findings were supported by studies in routine medical practice.11-15 The effectiveness of 98% in GT1b‑infected patients was achieved by Backus et al16 in a large cohort of American patients treated for 12 weeks. However, interestingly, when patients treated for shorter periods were also included in the analysis, the SVR rates were lower, 88% to 95%, depending on RBV addition. Higher efficacy for a 12‑week regimen as compared with an 8‑week option in GT1b‑infected patients with nonadvanced liver fibrosis was also observed in 771 patients from the RWE EpiTer‑2 database.17 In contrast, Manuc et al18 documented the same response rate of 96% for 8- and 12‑week regimens in the RWE cohort of 1436 GT1b‑infected patients, and the only predictive factor for nonresponse was male sex, which supported our findings. In the current study, we reported 2 nonresponders to the OPrD option, and both were male. Liver cirrhosis and failure to respond to prior therapies (pegIFN+RBV and TVR+pegIFN+RBV) may have contributed to the treatment failure in a single patient treated for 12 weeks with RBV, but in another previously untreated male patient with minimal fibrosis who received an 8‑week regimen without RBV, no possible cause of failure could be identified.
Similarly, high effectiveness of 99% was documented by us in the second largest group of patients in the current study assigned to the LDV/SOF±RBV combination. Both male patients who did not respond to the RBV‑containing regimen had liver cirrhosis, with one of them having been previously treated with TVR+pegIFN+RBV and then with OPrD. The efficacy of the LDV/SOF option was evaluated in ION clinical trials reporting an SVR of 94% to 99% in patients infected with GT1b depending on the RBV addition and the therapy length.19,20 While in clinical trials the presence of compensated cirrhosis did not significantly reduce the effectiveness of the therapy, the patients with decompensated cirrhosis achieved a lower SVR rate.21,22 In contrast, the results from an RWE study conducted among American veterans and in a Spanish cohort did not confirm findings that the history of decompensated liver disease affects the efficacy.16,23 The high response rate of 96% was also documented among GT1b‑infected patients treated within the HARVEST study, and all 3 nonresponders were men with liver cirrhosis.24
Compared with the current study (93.4%), a lower response rate was achieved in patients analyzed in the HCV‑TARGET trial, and liver cirrhosis was a negative predictor of SVR, similarly to our results.25 Comparable findings regarding liver cirrhosis, but also the history of previous therapy, as factors associated with lower efficacy were obtained in a real‑world Trio study.26
The only patient not responding to another treatment regimen used in the current study, namely the GZR/EBR combination, was also male, but we did not identify any other negative predictors, for he had a liver stiffness value corresponding to minimal liver fibrosis, with no comorbidities, was treatment naïve with a high baseline viral load, and the therapy went according to plan with negative HCV RNA on completion of the treatment. But even including this one nonresponder, the GZR/EBR regimen was highly effective, with an SVR of 99% in the PP analysis. The pooled analysis of 8 clinical trials including GT1‑infected patients treated with GZR/EBR by Ahmed et al27 revealed a very high effectiveness of 98.4% in patients with GT1b infection, establishing liver cirrhosis, treatment experience, but also a high baseline viral load as negative predictors of response. Real‑world data on GZR/EBR mainly come from Asian countries where this therapeutic option is widely used, and documented an SVR rate between 96 and 99%.28,29 The largest real‑world analysis in GT1b‑infected patients coming from outside Asia by Puenpatom et al,30 reported a 97.5% SVR rate in 3614 individuals from the United States Veterans Affairs clinical setting regardless of cirrhosis status and the HCV treatment history. Similar results of high efficacy, irrespective of previous therapy and liver cirrhosis, were reported in 1440 Polish patients treated within the EpiTer‑2 study.31
We found no difference in the efficacy of genotype‑specific and pangenotypic regimens in GT1b‑infected patients. While in the case of patients infected with GT3, the introduction of pangenotypic combinations significantly improved the effectiveness, in the case of patients infected with GT1, especially GT1b, the main benefit was the simplification of treatment.
According to the label, the GLE/PIB regimen allows the treatment length to be shortened to 8 weeks in the majority of patients.32 The overwhelming majority of GT1b infected patients in our analysis were treated for 8 weeks (95%). All of the patients treated for 12 weeks and all but one treated for 8 weeks responded to the therapy. The male patient with minimal liver fibrosis not achieving an SVR due to nonadherence used drugs irregularly because of alcohol abuse, so in this case, no conclusions can be drawn about negative predictors. Our findings on the very high effectiveness of GLE/PIB regardless of the history of previous therapies and liver fibrosis status supported the results of numerous clinical trials.33-36 The excellent efficacy of 99% to 100% in GT1b‑infected patients, both noncirrhotic and cirrhotic, as well as treatment‑naïve and experienced, was also documented in published RWE studies.37-41 Importantly, this option can be administered in patients with renal impairment; 2 patients with kidney failure stage 4 and 5 treated within the current study responded to the therapy, which is consistent with available data.42
The advantage of the other pangenotypic regimen, the SOF/VEL option, is the possibility of its use in patients with decompensated cirrhosis. Among 4 decompensated patients treated with SOF/VEL+RBV for 12 weeks, a single treatment‑naïve male patient did not respond to the therapy, lowering the SVR rate to 99% in this treatment arm. Similarly to the current analysis, the lower effectiveness of this regimen was documented in a clinical trial, ASTRAL‑4, in patients with decompensated liver cirrhosis; 89% of patients infected with GT1b responded, whereas the efficacy in patients without and with compensated cirrhosis assessed in the ASTRAL‑1 trial achieved a very high level of 99%.43,44 These data are also supported by RWE studies demonstrating a response rate exceeding 98% in noncirrhotic patients and patients with compensated liver cirrhosis in the course of GT1b infection.45,46 In the real‑world HCV‑TARGET study that included the population of the aforementioned patients conducted by Verna et al,47 an SVR of 90.5% was recorded. However, no detailed information was provided on the response rate among GT1b‑infected patients, who constituted 16.4% of the entire study group, making comparison with our results impossible.47
It should be noted that despite the very high efficiency of DAA regimens, both genotype‑specific and pangenotypic, confirmed in the current analysis, more research is still underway on new drugs in the treatment of HCV infection with a different mechanism of action.48
Regardless of the regimen used, we observed a good safety profile, which is consistent with the observations from clinical trials and RWE studies on the DAA therapy.49 The serious AEs and deaths that occurred during the treatment and follow‑up period were associated with comorbidities and the baseline liver function status. Noteworthy, the good tolerability of DAAs allows their use in specific groups of patients with contraindications to IFN‑containing therapy.50
Limitations
As a retrospective analysis, the current study has several limitations, including the possible bias resulting from incomplete data, incorrectly performed assessments, underreporting of AEs, and the discretion of the physician. Due to the real‑world nature of the study, it may have lacked sufficient rigor to provide a solid basis for comparing treatment regimens. However, the main strength of our study is the large number of patients with a sufficient group size in different treatment regimens. Also, the very low rate of patients lost to follow‑up (1.1%), typical of clinical trials rather than RWE studies, should be highlighted.
Conclusions
We confirmed very high effectiveness and a good safety profile of both genotype‑specific and pangenotypic regimens used in patients with GT1b HCV infection. We did not find significant differences between these 2 generations of medications. Male sex and previous treatment with DAAs were identified as negative predictors for therapy effectiveness.
- World Health Organization. Global health sector strategy on viral hepatitis 2016‑2021. Geneva, Switzerland: World Health Organization, 2015. http://apps.who.int/iris/bitstream/10665/246177/1/WHO‑HIV‑2016.06‑eng.pdf?ua=1. Accessed June 30, 2021.
- Blach S, Zeuzem S, Manns M, et al. Global prevalence and genotype distribution of hepatitis C virus infection in 2015: a modelling study. Lancet Gastroenterol Hepatol. 2017; 2: 161‑176.
- Flisiak R, Pogorzelska J, Berak H, et al. Prevalence of HCV genotypes in Poland – the EpiTer study. Clin Exp Hepatol. 2016; 2: 144‑148. | Crossref
- Flisiak R, Pogorzelska J, Berak H, et al. Efficacy of HCV treatment in Poland at the turn of the interferon era – the EpiTer study. Clin Exp Hepatol. 2016; 2: 138‑143. | Crossref
- Janczewska E, Flisiak R, Zarebska‑Michaluk D, et al. Effect of peginterferon or ribavirin dosing on efficacy of therapy with telaprevir in treatment‑experienced patients with chronic hepatitis c and advanced liver fibrosis: a multicenter cohort study. Medicine (Baltimore). 2015; 94: 1‑8. | Crossref
SUPPLEMENTARY MATERIAL
ARTICLE INFORMATION