Burden of multimorbidity in a Polish cohort of ambulatory and hospitalized heart failure patients from 2 large European registry programs: prognostic implications
Key words: comorbidities, heart failure, mortality, prognosis, registry


 CC BY-NC-SA 4.0
Burden of multimorbidity in a Polish cohort of ambulatory and hospitalized heart failure patients from 2 large European registry programs: prognostic implications
Introduction: Individual comorbidities have been shown to adversely affect prognosis in heart failure (HF). However, our knowledge of multimorbidity in HF and understanding of its prognostic implications still remain incomplete.
Objectives: We aimed to analyze the prevalence of multimorbidity in Polish HF patients and to investigate the quantitative and qualitative impact of comorbidity burden on 12‑month outcomes in that population.
Patients and methods: We retrospectively analyzed data of 1765 Polish patients with ambulatory or acute (requiring hospitalization) HF from 2 multicenter observational European Society of Cardiology registries: the ESC‑HF Pilot Survey (2009–2010) and ESC‑HF‑LT Registry (2011–2013).
Results: Arterial hypertension and coronary artery disease were the most prevalent comorbidities, similarly to the entire European cohort. The great majority of HF patients had more than 1 predefined comorbidity and the most frequent number of comorbidities was 3. Importantly, in almost half of the patients, 4 or more comorbidities were reported. The best accuracy for predicting the adjusted 12‑month rate of all‑cause death was ensured by the model including only anemia and kidney dysfunction. The model including 4 comorbidities—anemia, kidney dysfunction, diabetes, and coronary artery disease—provided best accuracy for predicting 12‑month rate of composite all‑cause death or HF hospitalization.
Conclusions: Multimorbidity is highly prevalent in a real‑world cohort of Polish HF patients and the quantitative burden of comorbidities is related to increased mortality. In such patients, the clinical profile characterized by pathophysiological continuum of diabetes, kidney dysfunction, and anemia is particularly associated with unfavorable outcomes.
What's new?
Individual comorbidities analyzed separately have been shown to affect symptomatology and outcomes in heart failure (HF) patients. However, we still do not know enough about multimorbidity in HF and its prognostic implications. In this study, we retrospectively analyzed data of 1765 Polish patients with stable ambulatory or acute (requiring hospitalization) HF from 2 multicenter observational European registries. In the study group, arterial hypertension and coronary artery disease were the most prevalent comorbidities, similarly to the entire European cohort. The great majority of HF patients had at least 2 predefined comorbidities and the most frequent number of comorbidities was 3. Importantly, in almost half of the patients, 4 or more concomitant comorbidities were reported. Advanced statistical modeling revealed that the most important predictors of unfavorable outcome in this cohort were diabetes, kidney dysfunction, anemia, and coronary artery disease.
Introduction
The prevalence of heart failure (HF) is approximately 1% to 2% of the adult population in developed countries, which translates into millions of Europeans with this epidemic condition.1 In spite of the continuous progress in diagnostics and therapeutic procedures that has been observed over the past decades in this field, life expectancy in HF patients still remains markedly reduced.2 Beyond doubt, data coming from randomized clinical trials are crucial for the improvement of HF care and therapy. However, due to multiple complex inclusion and exclusion criteria (eg, patients with severe renal dysfunction are frequently excluded from drug trials), they do not entirely represent a real‑world HF population. Thus, the European Society of Cardiology (ESC) designed and conducted the Heart Failure Pilot Survey (ESC‑HF Pilot) and the subsequent Heart Failure Long‑Term Registry (ESC‑HF‑LT) to assess the epidemiology, clinical profile, routine diagnostic and therapeutic procedures as well as to improve the prognostication in a real‑world cohort of European HF patients.3,4
Numerous previous studies have analyzed epidemiological, sociodemographic, and economic impacts of HF and a consistent conclusion they deliver is that HF is frequently accompanied by several other comorbidities that not only can accelerate the development of the disease but also affect its clinical course.5,6 The interference of comorbidities starts at the very beginning, as they may impede the diagnosis of HF (eg, dyspnea can be the result of a pulmonary disease).7,8 Further, in diagnosed HF, concomitant diseases can exacerbate its symptomatology, worsen the quality of life, and contribute to increased hospitalization rates and mortality.9 Moreover, particular comorbidities may limit the applicability of key evidence‑based therapies for HF by generating contraindications to certain groups of drugs or constituting exclusion criteria in clinical trials, consequently restricting the access to emerging therapies.10,11 Finally, some concomitant disorders imply the use of additional drugs that can either directly worsen HF (eg, cardiotoxic chemotherapy) or interact with HF pharmacotherapy, lowering its effectiveness or aggravating side effects.8
There is evidence that even a single comorbidity can negatively affect outcomes in HF.12-16 However, knowledge of multimorbidity in HF as well as of the complex interplay among particular comorbidities in predicting the outcome in such patients is still incomplete.17 In the considerably aging Polish society, the number of patients with HF is growing; however, detailed data on prevalence of multimorbidity and its prognostic impacts in this population are still lacking.6
In this study we aimed to: 1) assess the prevalence of multimorbidity in Polish HF patients; 2) investigate the impact of multimorbidity on 12‑month prognosis in HF; and 3) establish which comorbidities are the most significant for such prognostication.
Patients and methods
Study group
We retrospectively analyzed data from 2 multicenter prospective observational survey programs of the ESC: ESC‑HF Pilot and ESC‑HF‑LT.3,4 The ESC‑HF Pilot was conducted from October 2009 to May 2010 in 136 European cardiology centers (29 centers from Poland), whereas the ESC‑HF‑LT was carried out from May 2011 to April 2013 in 211 European and / or Mediterranean cardiology centers (35 centers from Poland). The surveys enrolled patients who were older than 18 years of age, provided written informed consent, and met the diagnostic criteria for HF (outpatients with stable HF or inpatients hospitalized for acute HF). The diagnosis of HF was established according to the typical clinical signs and symptoms as well as biochemical findings (increased levels of N‑terminal pro–B‑type natriuretic peptide [≥125 pg/ml] or brain natriuretic peptide [≥35 pg/ml]) and, optionally, echocardiographic features of left ventricular dysfunction. National ethics committees approved the aforementioned registry programs in particular countries. The enrollment was conducted on 1 specific day of the week for 12 consecutive months by each of the participating centers.
The following analyses included Polish patients from the ESC‑HF Pilot18 and the ESC‑HF‑LT. Patients whose data on comorbidities were missing or who were lost to follow‑up were excluded.
Clinical data
An entry questionnaire, including a clinical and demographic profile, medical history, biochemical parameters, and current treatment, was completed for each patient with HF. For the purposes of the current study, we analyzed the following variables:
-
demographics: sex, age;
-
HF characteristics: etiology (ischemic vs nonischemic), New York Heart Association (NYHA) class, and hospitalization status at enrollment (outpatients seen at the clinic vs inpatients with acute HF);
-
comorbidities: anemia, atrial fibrillation, coronary artery disease (CAD), cancer, chronic obstructive pulmonary disease (COPD), depression, diabetes, hyper- or hypokalemia, arterial hypertension, kidney dysfunction, and previous stroke and / or transient ischemic attack.
Anemia was defined according to the World Health Organization criteria as hemoglobin levels of less than 12 g/dl in women and less than 13 g/dl in men.19 Kidney dysfunction was defined as an estimated glomerular filtration rate (eGFR) of less than 60 ml/min/1.73 m2.
During 12‑month follow‑up, data on all‑cause deaths and HF hospitalizations were collected. At 12 months, the follow‑up visit in the hospital or an outpatient clinic was conducted or, if not possible, a structured telephone interview was initiated to replace it. The study end points were: 1) all‑cause death and 2) composite of all‑cause death or hospitalization for HF.
Statistical analyses
Categorical variables (sex, HF etiology, NYHA class, and hospitalization status at enrollment) were expressed as numbers (percentages) and the intergroup differences were tested using the χ2 test. Continuous variables were expressed as a mean (SD), and the intergroup differences were tested using the analysis of variance (ANOVA). All analyzed comorbidities (anemia, atrial fibrillation, CAD, cancer, COPD, depression, diabetes, hyper- or hypokalemia, hypertension, kidney dysfunction, and stroke / transient ischemic attack) were presented as dichotomous variables and were expressed as the number (percentage) of patients. Based on the sum of comorbidities in each HF patient, the score statistic SCORE1 was developed. SCORE1 took the values from 0 to 6, where 1 denoted that a given patient had 1 comorbidity, 2 denoted 2 comorbidities and so on, and 6 denoted that a given patient had 6 or more comorbidities.
Univariable and multivariable Cox proportional hazard regression models were constructed to calculate the predictive value of particular comorbidities and the SCORE1 statistic for the all‑cause death and the composite of all‑cause death or HF hospitalization (both end points during the 12‑month follow‑up). Multivariable models were adjusted for age, sex, HF etiology, NYHA class, and hospitalization status at enrollment (inpatients vs outpatients = acute vs stable HF). For both univariable and multivariable models, hazard ratios with corresponding χ2 and P values were estimated for all variables incorporated into the model. The assumption of the proportional hazard was tested for each derived model.
Subsequently, score statistics SCORE2 and SCORE3 were created as the scores with the best accuracy for predicting 12‑month rate of all‑cause death (SCORE2) and 12‑month rate of all‑cause death or hospitalization for HF (SCORE3). The fraction of false negatives for a given end point (event) was considered the measure of accuracy (the lower the proportion of false negatives, the greater the accuracy). To test which comorbidities were the most significant in the score statistics, we performed the following cross‑validation leave‑1‑out procedure: 1) we trained the Cox proportional hazard regression model with comorbidity statistically significant in the previous Cox analyses adjusted for age, sex, primary etiology, NYHA class group, and hospitalization at enrollment; 2) we predicted hazard for each patient in the test data set; 3) we estimated (using receiver operating characteristic curves) the optimal cutoff point for hazard specifying whether a patient died or was hospitalized for HF; 4) we calculated the average of the optimal cutoff point over all the iterations of the cross‑validation procedure; and 5) we checked the proportion of false negatives for a given comorbidity and the optimal cutoff point. We repeated this procedure for different sets of comorbidities presented in the model. Then, we calculated the fraction of false‑negative events and compared it with the fraction of false‑negative events for the Cox proportional hazard model with and without original score statistics. The scores (SCORE2 and SCORE3) built from the comorbidities which had the lowest fraction of false negatives were chosen as the optimal score statistics for predicting all‑cause death (SCORE2) and the composite of all‑cause death or hospitalization for HF (SCORE3) during 12‑month follow‑up. Both SCORE2 and SCORE3 statistics were further included in univariable and multivariable Cox proportional hazard regression models. SCORE1, SCORE2, and SCORE3 statistics were included in the Cox models (and tested for significance) as a discrete (not continuous) variable. We analyzed the presence of up to 6, 2, and 4 comorbidities with the reference point equal to 0 comorbidities for SCORE1, SCORE2, and SCORE3, respectively.
All statistical analyses were performed using R software, version 3.5.1 (The R Foundation, Vienna, Austria). A P value of less than 0.05 was considered statistically significant.
Results
Study group
Out of more than 2000 patients enrolled in the ESC‑HF Pilot and the ESC‑HF‑LT in the Polish centers—after excluding those with missing data on comorbidities and / or 1‑year follow‑up—the final study group for the following analyses included 1765 patients. In comparison to the whole European HF population enrolled in the ESC‑HF Pilot and ESC‑HF‑LT registries, Polish patients from our subanalysis were older, more frequently inpatients, and more frequently had HF of nonischemic etiology, whereas sex distribution was similar.
Comorbidities in patients with heart failure
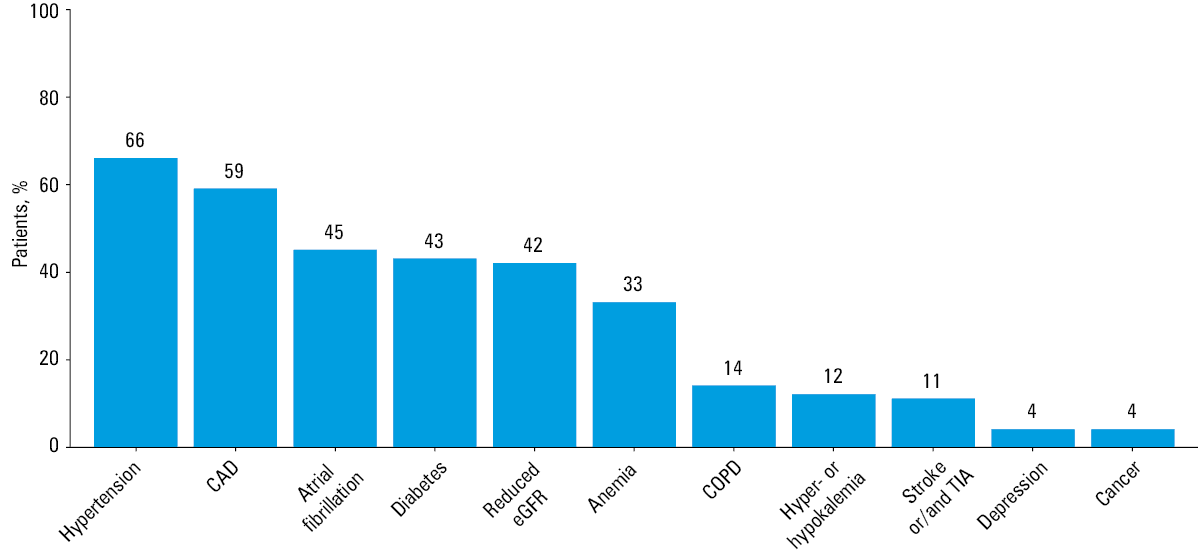
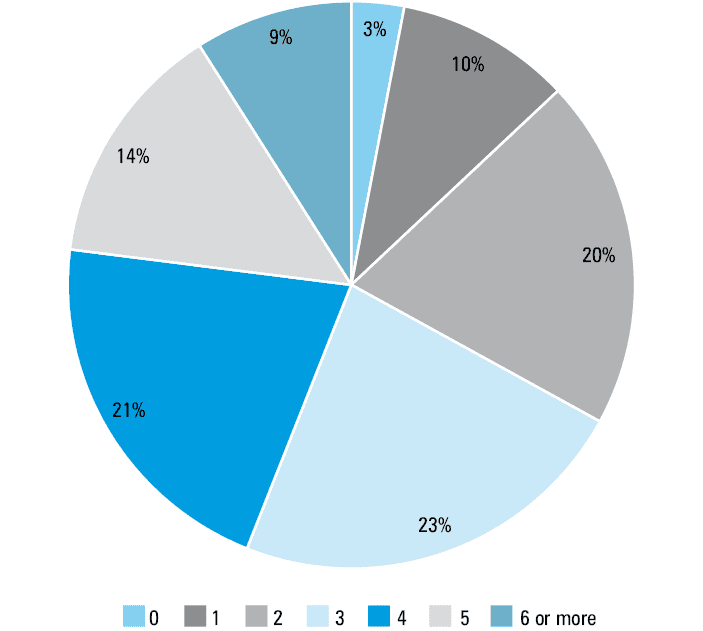
Baseline clinical characteristics of examined patients with HF according to derived prognostic scores based on the prevalence of particular predefined comorbidities are presented in Table 1. Arterial hypertension and CAD were the most prevalent comorbidities in the cohort of Polish HF patients (each one was present in over a half of the population). From one‑third to half of the study patients had atrial fibrillation, diabetes, kidney dysfunction, or anemia (Figure 1). The great majority of HF patients had more than a single predefined comorbidity (Figure 2) and the most frequent number of comorbidities was 3. In almost half of the patients, 4 or more coexisting comorbidities were found. “Isolated HF” (an unaccompanied diagnosis of HF) was 3‑fold less prevalent than a diagnosis of at least 6 comorbidities.
Variable | SCORE1a | SCORE2b | SCORE3c | All patients | |||||||||||||||
No. of comorbidities | ANOVA or χ2 P value | No. of comorbidities | ANOVA or χ2 P value | No. of comorbidities | ANOVA or χ2 P value | ||||||||||||||
0 | 1 | 2 | 3 | 4 | 5 | 6 | 0 | 1 | 2 | 0 | 1 | 2 | 3 | 4 | |||||
Data are presented as number (percentage) of patients unless otherwise stated.
a SCORE1 reflects the number of comorbidities among a predefined group (coronary artery disease, atrial fibrillation, arterial hypertension, previous stroke or / and transient ischemic attack, diabetes, kidney dysfunction, anemia, chronic obstructive pulmonary disease, depression, hyper- or hypokalemia, cancer), but category 6 includes subjects with ≥6 comorbidities.
b SCORE2 reflects the number of comorbidities out of preselected 2 (anemia, kidney dysfunction), derived as the score of the best accuracy for predicting 12‑month rate of all‑cause death.
c SCORE3 reflects the number of comorbidities out of preselected 4 (anemia, kidney dysfunction, diabetes, coronary artery disease), derived as the score of the best accuracy for predicting 12‑month rate of all‑cause death or hospitalization for heart failure.
Abbreviations: ANOVA, analysis of variance; HF, heart failure; No, number; NYHA, New York Heart Association | |||||||||||||||||||
Patients | 50 (3) | 172 (10) | 347 (20) | 406 (23) | 371 (21) | 252 (14) | 167 (9) | – | 777 (44) | 650 (37) | 338 (19) | – | 258 (15) | 480 (27) | 546 (31) | 370 (21) | 111 (6) | – | 1765 (100) |
Age, y, mean (SD) | 50 (13) | 57 (13) | 62 (13) | 68 (11) | 72 (11) | 75 (10) | 77 (8) | <0.001 | 62 (12) | 71 (12) | 77 (10) | <0.001 | 59 (14) | 64 (13) | 70 (12) | 74 (10) | 77 (8) | <0.001 | 68 (13) |
Male sex | 41 (82) | 126 (73) | 258 (74) | 280 (69) | 244 (66) | 147 (58) | 101 (60) | <0.001 | 601 (77) | 391 (60) | 205 (61) | <0.001 | 197 (76) | 336 (70) | 371 (68) | 225 (61) | 68 (61) | <0.001 | 1197 (68) |
Hospitalized patients | 27 (54) | 117 (68) | 240 (69) | 324 (80) | 301 (54) | 221 (88) | 142 (85) | <0.001 | 527 (68) | 535 (82) | 310 (92) | <0.001 | 162 (63) | 345 (72) | 440 (81) | 322 (87) | 103 (93) | <0.001 | 1372 (78) |
Ischemic etiology of HF | 4 (8) | 31 (18) | 122 (35) | 178 (44) | 163 (44) | 127 (50) | 87 (52) | <0.001 | 294 (38) | 272 (42) | 146 (43) | <0.001 | 8 (3) | 162 (34) | 264 (48) | 205 (55) | 73 (66) | 0.152 | 712 (40) |
NYHA class III–IV | 8 (16) | 45 (26) | 101 (29) | 120 (30) | 140 (38) | 79 (31) | 63 (38) | <0.001 | 200 (26) | 227 (35) | 129 (38) | <0.001 | 57 (22) | 140 (29) | 175 (32) | 144 (39) | 40 (36) | <0.001 | 556 (32) |
Abbreviations: CAD, coronary artery disease; COPD, chronic obstructive pulmonary disease; eGFR, estimated glomerular filtration rate; TIA, transient ischemic attack
Survival analyses
From all comorbidities, after the adjustment for age, sex, HF etiology, NYHA class, and baseline hospitalization (for acute HF), the significant prognostic factors for increased 12‑month all‑cause mortality were kidney dysfunction, anemia, and depression (Table 2). In univariable analyses, older age, inpatient status, more severe HF symptoms, atrial fibrillation, kidney dysfunction, anemia, COPD, and depression were related to increased 12‑month all‑cause mortality (Table 3). Older age, hospitalization at enrollment, NYHA class III to IV, CAD, diabetes, kidney dysfunction, and anemia were all related to increased 12‑month risk of all‑cause death or hospitalization for HF (Table 4). The adjusted 12‑month risk of all‑cause death or hospitalization for HF was greater in patients with CAD, diabetes, kidney dysfunction, and anemia (Table 3).
Comorbidity | Patients, n (%) | Model including 1 comorbidity for 12‑month risk of all‑cause death | Model including 1 comorbidity for 12‑month risk of all‑cause death or hospitalization due to HF | ||
HR (95% CI) | P value | HR (95% CI) | P value | ||
CAD | 1033 (59) | 1.35 (0.93–1.97) | 0.11 | 1.36 (1.06–1.73) | 0.01 |
Atrial fibrillation | 800 (45) | 1.24 (0.92–1.69) | 0.16 | 1.18 (0.97–1.43) | 0.10 |
Hypertension | 1158 (66) | 0.94 (0.67–1.32) | 0.74 | 0.85 (0.69–1.05) | 0.13 |
Stroke or / and TIA | 201 (11) | 0.76 (0.46–1.25) | 0.28 | 1.10 (0.82–1.46) | 0.53 |
Diabetes | 767 (43) | 1.13 (0.84–1.52) | 0.43 | 1.30 (1.08–1.56) | 0.006 |
Kidney dysfunction | 745 (42) | 1.78 (1.24–2.54) | 0.002 | 1.32 (1.06–1.65) | 0.01 |
Anemia | 581 (33) | 1.37 (1.01–1.86) | 0.04 | 1.33 (1.10–1.62) | 0.004 |
COPD | 252 (14) | 1.30 (0.89–1.89) | 0.18 | 1.13 (0.88–1.46) | 0.33 |
Depression | 72 (4) | 1.89 (1.09–3.28) | 0.02 | 1.21 (0.80–1.82) | 0.38 |
Hyper- or hypokalemia | 213 (12) | 1.08 (0.69–1.69) | 0.74 | 0.98 (0.73–1.33) | 0.91 |
Cancer | 62 (4) | 1.45 (0.74–2.85) | 0.28 | 1.00 (0.61–1.65) | 0.99 |
Variable | Units of risk factors | Univariable models | Multivariable model with SCORE1a | Multivariable model with SCORE2b | |||
HR (95% CI) | P value | HR (95% CI) | P value | HR (95% CI) | P value | ||
a SCORE1 reflects the number of comorbidities among a predefined group (coronary artery disease, atrial fibrillation, arterial hypertension, previous stroke or / and transient ischemic attack, diabetes, kidney dysfunction, anemia, chronic obstructive pulmonary disease, depression, hyper- or hypokalemia, cancer), but category 6 includes patients with ≥6 comorbidities.
b SCORE2 reflects the number of comorbidities out of preselected 2 (anemia, kidney dysfunction), derived as the score of the best accuracy for predicting 12‑month rate of all‑cause death.
| |||||||
Clinical variables | |||||||
Age | 1 year | 1.03 (1.02–1.05) | <0.001 | 1.02 (1.00–1.03) | 0.01 | 1.02 (1.00–1.03) | 0.007 |
Sex | Men vs women | 0.88 (0.67–1.16) | 0.37 | 1.24 (0.89–1.72) | 0.20 | 1.25 (0.90–1.74) | 0.18 |
Hospitalized patients | Yes vs no | 3.45 (2.13–5.59) | <0.001 | 2.26 (1.37–3.70) | 0.001 | 2.15 (1.30–3.53) | 0.002 |
Ischemic etiology of HF | Yes vs no | 0.92 (0.70–1.21) | 0.56 | 0.87 (0.64–1.18) | 0.37 | 0.95 (0.70–1.29) | 0.76 |
NYHA class | III–IV vs I–II | 1.99 (1.50–2.65) | <0.001 | 1.99 (1.48–2.67) | <0.001 | 1.91 (1.42–2.57) | <0.001 |
Comorbidities | |||||||
CAD | Yes vs no | 1.24 (0.94–1.63) | 0.13 | – | – | – | – |
Atrial fibrillation | Yes vs no | 1.42 (1.09–1.85) | 0.01 | – | – | – | – |
Arterial hypertension | Yes vs no | 1.20 (0.90–1.60) | 0.21 | – | – | – | – |
Previous stroke and / or TIA | Yes vs no | 0.82 (0.52–1.28) | 0.38 | – | – | – | – |
Diabetes | Yes vs no | 1.16 (0.89–1.51) | 0.27 | – | – | – | – |
Kidney dysfunction | Yes vs no | 2.51 (1.91–3.30) | <0.001 | – | – | – | – |
Anemia | Yes vs no | 2.10 (1.61–2.74) | <0.001 | – | – | – | – |
COPD | Yes vs no | 1.44 (1.03–2.01) | 0.03 | – | – | – | – |
Depression | Yes vs no | 2.21 (1.37–3.58) | <0.001 | – | – | – | – |
Hyper- or hypokalemia | Yes vs no | 1.42 (0.99–2.04) | 0.06 | – | – | – | – |
Cancer | Yes vs no | 1.73 (0.99–3.03) | 0.05 | – | – | – | – |
Scores | |||||||
SCORE1a | 1 vs 0 | 1.00 (0.21–4.80) | <0.001 | 0.81 (0.17–3.92) | 0.03 | – | – |
2 vs 0 | 2.05 (0.49–8.59) | 1.20 (0.28–5.16) | – | – | |||
3 vs 0 | 2.87 (0.70–11.82) | 1.33 (0.31–5.69) | – | – | |||
4 vs 0 | 3.81 (0.93–15.63) | 1.81 (0.42–7.71) | – | – | |||
5 vs 0 | 5.57 (1.36–22.90) | 2.50 (0.58–10.83) | – | – | |||
6 vs 0 | 5.90 (1.42–24.52) | 2.32 (0.52–10.25) | – | – | |||
SCORE2b | 1 vs 0 | 2.29 (1.63–3.23) | <0.001 | – | – | 1.66 (1.12–2.46) | 0.003 |
2 vs 0 | 3.91 (2.75–5.57) | – | – | 2.14 (1.37–3.34) | |||
P value of the multivariable model | – | – | – | – | <0.001 | – | <0.001 |
Variable | Units of risk factors | Univariable models | Multivariable model with SCORE1a | Multivariable model with SCORE3b | |||
HR (95% CI) | P value | HR (95% CI) | P value | HR (95% CI) | P value | ||
a SCORE1 reflects the number of comorbidities among a predefined group (coronary artery disease, atrial fibrillation, arterial hypertension, previous stroke or / and transient ischemic attack, diabetes, kidney dysfunction, anemia, chronic obstructive pulmonary disease, depression, hyper- or hypokalemia, cancer), but category 6 includes patients with ≥6 comorbidities.
b SCORE3 reflects the number of comorbidities out of preselected 4 (anemia, kidney dysfunction, diabetes, coronary artery disease), derived as the score of the best accuracy for predicting 12‑month rate of all‑cause death or hospitalization for heart failure.
| |||||||
Clinical variables | |||||||
Age | 1 year | 1.01 (1.00–1.02) | 0.007 | 1.00 (0.99–1.00) | 0.34 | 0.99 (0.99–1.00) | 0.19 |
Sex | Men vs women | 0.91 (0.75–1.10) | 0.33 | 0.96 (0.78–1.18) | 0.71 | 0.96 (0.78–1.18) | 0.70 |
Hospitalized patients | Yes vs no | 2.29 (1.77–2.96) | <0.001 | 2.05 (1.58–2.67) | <0.001 | 1.95 (1.50–2.54) | <0.001 |
Ischemic etiology of HF | Yes vs no | 1.12 (0.93–1.34) | 0.23 | 1.02 (0.84–1.24) | 0.87 | 0.92 (0.75–1.13) | 0.44 |
NYHA class | III–IV vs I–II | 1.88 (1.56–2.26) | <0.001 | 1.83 (1.52–2.21) | <0.001 | 1.81 (1.50–2.18) | <0.001 |
Comorbidities | |||||||
CAD | Yes vs no | 1.32 (1.10–1.59) | 0.003 | – | – | – | – |
Atrial fibrillation | Yes vs no | 1.18 (0.99–1.41) | 0.07 | – | – | – | – |
Hypertension | Yes vs no | 0.96 (0.80–1.16) | 0.67 | – | – | – | – |
Previous stroke or / and TIA | Yes vs no | 1.09 (0.83–1.42) | 0.57 | – | – | – | – |
Diabetes | Yes vs no | 1.35 (1.13–1.61) | 0.001 | – | – | – | – |
Kidney dysfunction | Yes vs no | 1.55 (1.29–1.85) | <0.001 | – | – | – | – |
Anemia | Yes vs no | 1.64 (1.37–1.97) | <0.001 | – | – | – | – |
COPD | Yes vs no | 1.17 (0.92–1.48) | 0.21 | – | – | – | – |
Depression | Yes vs no | 1.36 (0.92–2.00) | 0.12 | – | – | – | – |
Hyper- or hypokalemia | Yes vs no | 1.10 (0.84–1.45) | 0.49 | – | – | – | – |
Cancer | Yes vs no | 1.07 (0.68–1.69) | 0.77 | – | – | – | – |
Scores | |||||||
SCORE1a | 1 vs 0 | 0.81 (039–1.68) | <0.001 | 0.72 (0.35–1–48) | <0.001 | – | – |
2 vs 0 | 1.42 (0.74–2.73) | 1.20 (0.62–2.33) | – | – | |||
3 vs 0 | 1.46 (0.76–2.79) | 1.10 (0.56–2.16) | – | – | |||
4 vs 0 | 1.48 (0.77–2.85) | 1.12 (0.57–2.22) | – | – | |||
5 vs 0 | 2.14 (1.11–4.12) | 1.64 (0.82–3.29) | – | – | |||
6 vs 0 | 2.66 (1.36–5.16) | 1.89 (0.93–3.85) | – | – | |||
SCORE3b | 1 vs 0 | 1.52 (1.07–2.17) | <0.001 | – | – | 1.47 (1.02–2.12) | <0.001 |
2 vs 0 | 2.04 (1.46–2.86) | 1.83 (1.26–2.65) | |||||
3 vs 0 | 2.27 (1.60–3.22) | 1.96 (1.3–2.94) | |||||
4 vs 0 | 4.01 (2.67–6.00) | – | – | 3.59 (2.24–5.74) | |||
χ2 (P value) of the multivariable model | – | – | – | – | <0.001 | – | <0.001 |
SCORE models
The SCORE1 model, which reflected the comorbidity burden (the number of comorbidities in a single patient), was a significant prognostic factor for increased 12‑month risk of all‑cause death and composite of all‑cause death or hospitalization for HF (in both univariable and multivariable analyses). However, the best accuracy for predicting 12‑month rate of all‑cause death was ensured by the SCORE2 model, comprising only anemia and kidney dysfunction (SCORE2 indicates the number of comorbidities out of these 2), while the best accuracy for predicting 12‑month rate of composite all‑cause death or HF hospitalization was provided by the SCORE3 model, including the following 4 comorbidities: anemia, kidney dysfunction, diabetes, and CAD (SCORE3 indicated the number of comorbidities out of these 4).
For the end point of all‑cause death, the cross‑validation leave‑1‑out procedure allowed to reduce the fraction of false negatives from 38% in the model without any score variable, through 22% in the SCORE1 model, to 20% in the SCORE2 model which included only anemia and kidney dysfunction. For the composite of all‑cause death or hospitalization for HF, the cross‑validation procedure allowed to reduce the fraction of false negatives from 53% in the model without the score variable, through 47% in the SCORE1 model, to 23% in the SCORE3 model including anemia, kidney dysfunction, diabetes, and CAD.
Discussion
In the current study, we systematically analyzed the prevalence and distribution of different comorbidities in a Polish cohort of HF patients, and we highlighted the issue of multimorbidity in this population. Our results confirm previous reports that arterial hypertension, CAD, and atrial fibrillation are the most prevalent cardiovascular comorbidities complicating HF, whereas the most prevalent noncardiovascular comorbidities were diabetes, kidney dysfunction, and anemia, which is consistent with other cohorts of patients with this primary diagnosis.5,12,17,18,20-22 Additionally, in the developed prognostic models, we demonstrated that out of the broad spectrum of concomitant conditions, selected entities are associated with particularly worse outcomes in patients with HF.
Multimorbidity in elderly patients indisputably results in diverse diagnostic and therapeutic problems, and the complexity of optimal care increases with the number of concomitant chronic diseases in a single patient.23 According to our analyses, as much as two‑thirds of Polish patients with HF have 3 or more comorbidities. Comparing with other studies, the occurrence of multimorbidity was less common among patients with chronic HF from the ESC‑HF Pilot, but more prevalent in 3 large American studies presenting such data.9,21,24 Of note, there is an evident bidirectional relationship between HF and concomitant clinical entities: an exacerbation of comorbidities can result in HF, and on the other hand, HF can accelerate / aggravate several other conditions in a multifaceted way.5 The prevalence of different comorbidities has been previously demonstrated to be significantly higher in HF patients compared with age‑matched non‑HF individuals, which may be explained by several mechanisms. Firstly, arterial hypertension and CAD are major causes of HF in developed countries which results in obviously higher prevalence of these conditions in those with HF as compared with the non‑HF population. Secondly, HF is accompanied by neurohormonal activation and affects neural and hormonal balance within the body, which can lead to a dysfunction of other peripheral organs.24 Moreover, standard HF pharmacotherapies may negatively affect the functioning of other organs—for example, combined renin‑angiotensin‑aldosterone blockade may decrease renal function in some patients.12 Our study brings together multiple comorbidities in a broad spectrum of patients with HF. We have demonstrated that most patients have at least one comorbidity, and the number of comorbidities increases with the severity of HF. Among noncardiac comorbidities, diabetes, kidney dysfunction and anemia, which are, in fact, a pathogenetic continuum, had the highest prevalence among the study patients.
Although the number of comorbidities correlates with worse prognosis (quantitative effect), poor outcome in Polish HF patients is also qualitatively related to the type of concomitant disorders. The model with the best accuracy for predicting increased 12‑month rate of all‑cause death included only 2 comorbidities: anemia and kidney dysfunction. The complex interplay between these 2 conditions in the so‑called cardio‑renal‑anemia‑iron deficiency axis needs to be acknowledged.25 Moreover, these clinical entities are related to the accumulation of other factors which are also relevant predictors of unfavorable outcomes in HF (eg, malnutrition, frailty, and greater overall noncardiovascular comorbidity burden).24,26 On the other hand, some authors consider anemia in this clinical setting rather as an expression of other medical problems than an individual clinical entity.27,28 Similarly, kidney dysfunction is associated with a higher burden of causative comorbidities, especially diabetes and arterial hypertension, which are the leading factors promoting the decline in renal sufficiency in the elderly.13 It is worth noting that renal dysfunction also upregulates the renin‑angiotensin‑aldosterone system, worsening left ventricular hypertrophy, and myocyte contractility, and finally, resulting in the progression of HF. Additionally, in patients with renal insufficiency, there are excessive circulating proinflammatory mediators, hampered erythropoiesis within the bone marrow, and consequent progression of anemia.29,30 In the current study, the model with the best accuracy for predicting 12‑month rate of all‑cause death or hospitalization for HF included, except for anemia and kidney failure, diabetes, and CAD. Our data once again highlight diabetes as one of the leading disorders aggravating the natural history of HF, in the course of which HF hospitalization is an important adverse event (and beyond doubt, also a crucial therapeutic target). Indeed, numerous epidemiological studies have demonstrated evident relationships between disturbed glucose metabolism and either greater prevalence of HF or worse outcomes in the course of the disease.31-33 It is also worth noting that diabetic kidney disease is the leading form of renal insufficiency in developed countries.34
Different stages of the pathophysiological cardiorenal continuum (from abnormal glucose metabolism to an overt HF with frequent rehospitalizations) are becoming an emerging target of modern HF pharmacotherapy with sodium‑glucose cotransporter 2 (SGLT2) inhibitors.35 Still not completely understood, beneficial cardiovascular and renal effects of SGLT2 inhibitors (evidently outweighing improved glucose metabolism) have been demonstrated in large clinical trials involving different groups of patients either with major risk factors for or with already established cardiovascular disease.36-38 SGLT2 inhibitors not only improve “hard” clinical outcomes in diagnosed renal and cardiac insufficiency irrespective of concomitant diabetes, but more importantly, there is evidence that they can prevent both end‑stage chronic kidney dysfunction and HF.39-41
Conclusions
We demonstrated that multimorbidity is highly prevalent in a real‑world cohort of Polish HF patients and the quantitative burden of comorbidities is related to increased mortality. In such patients, the clinical profile involving pathophysiological continuum of diabetes, kidney dysfunction, and anemia was particularly related to unfavorable outcomes.
- Mosterd A, Hoes AW. Clinical epidemiology of heart failure. Heart. 2007; 93: 1137‑1146. | Crossref
- Dharmarajan K, Rich MW. Epidemiology, pathophysiology, and prognosis of heart failure in older adults. Heart Fail Clin. 2017; 13: 417‑426. | Crossref
- Maggioni AP, Dahlström U, Filippatos G, et al. EURObservational research program: the Heart Failure Pilot Survey (ESC‑HF Pilot). Eur J Heart Fail. 2010; 12: 1076‑1084. | Crossref
- Crespo‑Leiro MG, Anker SD, Maggioni AP, et al. European Society of Cardiology Heart Failure Long‑Term Registry (ESC‑HF‑LT): 1‑year follow‑up outcomes and differences across regions. Eur J Heart Fail. 2016; 18: 613‑625. | Crossref
- Krum H, Gilbert RE. Demographics and concomitant disorders in heart failure. Lancet. 2003; 362: 147‑158. | Crossref
ARTICLE INFORMATION