Fibrin clot properties in coronary artery disease: new determinants and prognostic markers
Key words: acute coronary syndrome, clot formation, coronary artery disease, fibrin clot, fibrinolysis


 CC BY-NC-SA 4.0
Fibrin clot properties in coronary artery disease: new determinants and prognostic markers
Despite improved diagnosis and treatment options, coronary artery disease (CAD) is still the leading cause of mortality and morbidity worldwide. Established risk factors such as smoking, hypercholesterolemia, and hypertension only partly explain the pathophysiology of CAD. Besides the well‑known role of platelets in atherosclerosis and arterial thrombus formation, reduced endogenous fibrinolytic activity may play a key role in CAD formation and progression. Thus, biomarkers of fibrinolysis may be future CAD risk markers. In this review, we provide an overview of regulators of fibrinolysis and the main factors of importance to fibrin clot formation including coagulation factor XIII, thrombin, and fibrinogen. We summarize markers of altered fibrinolysis and current laboratory methods applied in clinical practice and research. We present today’s evidence on fibrin clot properties in patients with stable CAD or acute coronary syndrome compared with healthy individuals and the significance of altered fibrinolysis as a risk for coronary thrombotic disease. In conclusion, we found evidence that altered fibrin clot properties and impaired fibrinolysis appear to contribute significantly to the thromboembolic risk in CAD patients. Therefore, more research is crucial in order to clarify whether modulation of the fibrinolytic system may pave the way for improved treatment of CAD.
Introduction
Cardiovascular disease is still the leading cause of mortality globally.1 Among cardiovascular diseases, coronary artery disease (CAD) is the largest subgroup, and CAD is the single most common cause of death in Europe.2 Stable CAD is mainly caused by atherosclerosis and is in itself usually nonfatal. However, atherosclerotic plaque rupture may cause a potentially life‑threatening coronary thrombosis. The acute coronary syndrome (ACS) comprises acute myocardial infarction (AMI) and unstable angina.
Traditional cardiovascular risk factors include smoking, diabetes mellitus, hypercholesterolemia, obesity, and hypertension.3 Therefore, CAD management involves lifestyle modification, pharmacological treatment, and in acute cases, endovascular intervention in coronary artery thrombosis. Mortality due to CAD is slowly decreasing owing to improved medical and interventional therapy, especially in the Western world.2 However, despite improved prevention and treatment options, many patients with CAD still experience progression of their disease to ACS, and patients with AMI have a high rate of recurrent cardiovascular events. Therefore, further exploration in the pathology of CAD is essential. It is well known that platelets play a key role in arterial thrombus formation, but a growing amount of evidence indicates that an altered fibrin structure and decreased endogenous fibrinolytic activity are also important contributors in the pathology of CAD. Thus, markers of altered fibrinolysis may hold the potential for being new biomarkers of CAD risk. In this review, we summarize the mechanisms behind fibrin clot formation and fibrinolysis, provide an overview of available laboratory methods to assess fibrin clot properties and lysis, and review the current literature on markers of altered fibrin clot properties and fibrinolysis in CAD patients.
Clot formation and fibrinolysis
A blood clot consists of fibrin fibers, platelets, and blood cells. Clot formation is conceived when an adequate amount of thrombin has been generated during the coagulation process with subsequent conversion of fibrinogen to fibrin and thereafter formation of double‑stranded protofibrils. Thrombin also activates factor XIII (FXIII).4 In the presence of calcium, activated FXIII crosslinks fibrin, inducing formation of covalent bindings between fibrin subunits and stabilizing the clot. Furthermore, FXIII is an important determinant of fibrin clot structure and susceptibility to lysis. It promotes fibrin clot compaction and elasticity, facilitates binding of antifibrinolytic proteins within the clot and may promote erythrocyte retention in the clot which also renders the clot less permeable.5 Finally, the clot is stabilized after incorporation of α2-plasmin inhibitor.6 Subsequently, the protofibrils aggregate further into fibrin fibers generating a network capable of trapping blood components and forming a mature clot.4 The fibrinolytic system works in harmony with the coagulation system balancing the clot formation and breakdown in a continuous physiological process. Thus, fibrinolysis is initiated already during fibrin clot formation. A schematic overview of the fibrin formation and fibrinolysis process is shown in Figure 1.
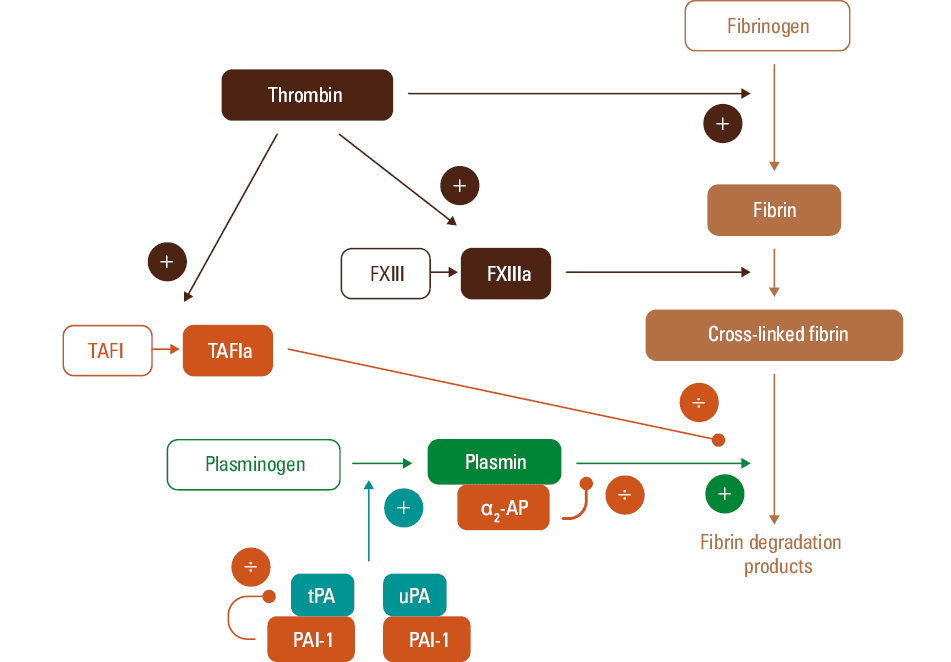
Abbreviations: α2-AP, α2 antiplasmin; FXIII, factor XIII; PAI‑1, plasminogen activator inhibitor 1; TAFI, thrombin‑activatable fibrinolysis inhibitor; tPA, tissue‑type plasminogen activator; uPA, urokinase plasminogen activator
Fibrinolysis of the blood clot is strictly regulated by several activators and inhibitors. The conversion of plasminogen to the active serine protease plasmin starts following activation by tissue‑type and urokinase plasminogen activator (tPA and uPA, respectively), with tPA being the most significant.7 Both plasminogen and the plasminogen activators bind to the fibrin surface,8 and fibrin binding increases the affinity of tPA for plasminogen and thus conversion to plasmin up to 1000‑fold.7 This ensures that plasmin activity is localized mainly to the fibrin clot under normal circumstances. Inhibition of the fibrinolytic activity is carried out by the 3 inhibitory proteins: plasminogen activator inhibitor (PAI)-1, thrombin‑activatable fibrinolysis inhibitor (TAFI), and α2-plasmin inhibitor. PAI‑1 is a serine protease inhibitor and is the major inhibitor of tPA and uPA. It is a single‑chain glycoprotein primarily stored in platelets and also present in the endothelium. PAI‑1 binds most of the circulating tPA and thereby hampers the activation of plasminogen to plasmin. TAFI is a propeptide that suppresses fibrinolysis when activated to TAFIa. TAFIa restricts the binding of tPA to the fibrin clot and thereby prevents the activation of plasminogen to plasmin, and consequently fibrinolysis is down‑regulated.8 Finally, α2-plasmin inhibitor, (previously known as α2-antiplasmin), also a serine protease inhibitor, together with TAFI and PAI‑1, are one of the primary inhibitors of plasmin.9 α2-Plasmin inhibitor regulates fibrinolysis by plasmin binding, thereby forming the inactive plasmin‑antiplasmin (PAP) complex.6 This prevents plasmin adsorption on the fibrin clot and subsequent clot breakdown.
Fibrin clot properties
The efficacy of the fibrin degradation depends not only on the regulator proteins of fibrinolysis mentioned above but also on fibrin clot structure, which is defined by the characteristics of the fibrin fibers. The properties of the fibrin fiber network determine its mechanical stability and resistance to endogenous fibrinolysis. Fiber diameter determines the density and pore size in the fibrin network and consequently the susceptibility to fibrinolysis. If the concentration of thrombin is low when the clot is formed, the fibrin clot consists of thick and loosely woven fibrin fibers, which are highly susceptible to fibrinolysis.10 In contrast, if the thrombin concentration is high, the clot is composed by thinner fibers leading to denser fibrin clots with smaller pores.10 These thin and dense fibers are relatively resistant to fibrinolysis as this fibrin structure hampers the diffusion of plasminogen and tPA.4,11,12 The level of fibrinogen also impacts fibrin clot properties; higher fibrinogen levels result in more compact clots,13 thereby compromising fibrinolysis. Moreover, qualitative alterations of fibrinogen, such as glycation, phosphorylation, or oxidation can lead to changes in clot structure14 and thereby also possibly lead to impaired fibrinolysis.
Genetic determinants of fibrin clot properties have naturally been sought as a means of risk stratification and to identify possible treatment targets. Focus points have been the FXIII Val34Leu and PAI‑1 4G/4G polymorphisms which have both been linked to CAD risk in large meta‑analyses.15,16 However, the association between these genetic variants and CAD is modest in size and is dependent on other factors, mainly fibrinogen, and the potential mechanisms through which these polymorphisms may influence fibrin clot structure are also not clear.17 Thus, their role as prognosticators in CAD are not promising. Hereditary fibrinogen disorders (termed dysfibrinogenemias) have also been associated with increased thrombosis risk, as reviewed by Undas and Casini.18 These disorders cover a range of mutations in the fibrinogen chain genes or promoter regions, some of which lead to qualitative changes in the fibrinogen molecule that impact fibrin clot structure. However, these conditions are rare and thus of limited value in population‑based risk stratification and treatment of CAD.
Fibrin clot properties and coronary artery disease risk factors
As previously mentioned, denser fibrin networks are less susceptible to lysis, thus promoting a prothrombotic state.11,12 Interestingly, studies have shown that patients with atherosclerosis and subsequent risk of arterial thrombosis carry denser fibrin networks than the general population.4 Moreover, fibrin is accumulated within atherosclerotic plaques and is thereby also involved in CAD progression.19 Well‑established CAD risk factors such as hypertension, high body mass index, smoking, and diabetes also have been suggested to be associated with prothrombotic clot properties in both otherwise healthy individuals and in patients with CAD.20 However, the association with hypercholesterolemia and fibrin clot properties are more puzzling as increased levels of high‑density lipoprotein cholesterol, leading to hypercholesterolemia, have been demonstrated to be associated with improved fibrin clot permeability and lysis and thereby may hold a potentially beneficial effect on the otherwise prothrombotic state.21
Biomarkers of fibrinolysis
Fibrinolysis can be investigated by a wide range of laboratory analyses, as summarized in Table 1. The clot structure and fibrin clot properties can be further characterized by scanning electron microscopy or laser scanning confocal microscopy, by which fiber diameter, fiber length, fiber density and size of the pores in the mesh can be described.22 However, this is exclusively done for research.
Laboratory test | Methods | Comments |
Abbreviations: ↑, increase; ↓, decrease; ECLT, Euglobulin Clot Lysis Time; ELISA, enzyme‑linked immunosorbent assay; PAP, plasmin-α2-antiplasmin; PCR, polymerase chain reaction; others, see Figure 1 | ||
D‑dimer89 |
|
|
Fibrinolysis activators | ||
Plasminogen |
|
|
tPA |
|
|
Fibrinolysis inhibitors | ||
PAI‑1 |
|
|
PAI‑1 genotype90 | PCR |
|
α2-plasmin inhibitor (previously α2-antiplasmin)91 |
| ↓ α2-plasmin inhibitor: inherited deficiency, liver cirrhosis, premature infants |
PAP complex | Antigen: ELISA |
|
TAFI | Antigen: ELISA | ↓ TAFI: deficiency or functional abnormality (leads to bleeding) |
Global or dynamic assays | ||
Clot formation and lysis assay24 | Turbidimetry | Provides detailed dynamic information on fibrinolytic activity including a measure of fibrin network density; time from full clot formation to a 50% lysis of the clot and area under the curve, which reflects the balance between clot formation and lysis. |
Tromboelastometry / -graphy | Viscoelasticity |
|
Clot permeability29,55,92 | A pressure‑driven system employing fibrin clot gels | Assesses fibrin clot porosity including the size of pores between fibrin fibers |
ECLT31 | Visual assessment of fibrinolysis |
|
Global Thrombosis Test32 | Shear‑induced clot formation and subsequent lysis | Point‑of‑care screening test measuring clot formation and clot lysis in nonanticoagulated whole blood |
The measurement of D‑dimer is by far the most widely used test for fibrinolysis in daily clinical practice. The most available D‑dimer assays are immunoassays which are prone to interference from heterophilic antibodies to varying degrees. An important limitation of these tests is that the D‑dimer level is influenced both by the amount of fibrin formed and the fibrin breakdown rate. Thus, it does not reflect hypofibrinolysis and a high D‑dimer level is not specific for hyperfibrinolysis as several conditions lead to an increase in D‑dimer levels (Table 1).
Fibrinolysis activator and inhibitors
Both activators and inhibitors of fibrinolysis can be measured as individual circulating proteins in plasma, most commonly using enzyme‑linked immunosorbent assays (ELISA). Many assays are commercially available and can be performed without the need for specialized equipment. The drawback of measuring single markers is that only one component of the fibrinolysis is explored, and the analyses lack cellular components which are important for fibrinolysis.23 These analyses are still mainly used for research, and available commercial assays may employ different normal ranges and differ with regards to antigen or activity that is actually measured. Currently, measuring circulating fibrinolysis regulators does not have a clear clinical relevance and thus does not form the basis for therapeutic decision making or prognostic information in daily clinical practice. Ultimately, these tests are mainly useful when a single factor deficiency is present.23
Global or dynamic analysis of fibrin clot properties and fibrinolysis
The dynamic process of fibrin clot formation and fibrin degradation can be evaluated in plasma employing a turbidimetric assay. In this assay, the coagulation is activated by thrombin or recombinant tissue factor, phospholipids, and calcium.24 Furthermore, tPA is added to induce lysis of the clot. Using turbidimetry, absorbance is registered continuously during 1 to 2 hours and a clot formation and lysis curve is formed. From this curve, information is obtained on the time to initial fibrin formation, peak fibrin concentration, and time from peak until 50% of the clot is lysed, and finally the net fibrin formation is reflected by the area under the curve.24
Rotational thromboelastometry / -graphy (ROTEM / TEG) provides a global and dynamic analysis of hemostasis. ROTEM / TEG employ the viscoelastic properties of whole blood. After addition of reagents, coagulation is initiated during relative movement of the test cuvette and an impeded pin. As a clot is formed in the test cuvette, the resistance increases and the dynamic clot development, clot strength, and lysis of the clot are displayed graphically. The method was introduced already in 194825 and was standardized around 15 years later, making it possible to implement in daily clinical practice.26 However, the tests were primarily developed for investigation of bleeding patients,27 and the tests are not sensitive to mild hyperfibrinolysis.23 Also, it is uncertain whether the tests can reveal hypofibrinolysis due to lack of sensitivity.28 If the tests are modified by addition of tPA, they may be more suitable for detection of hypofibrinolysis.23
The clot permeability test reflects the degree to which the blood is able to flow through the fibrin clot. The test is performed to assess the fibrin clot porosity including the size of pores between fibrin fibers. Clot formation is initiated after addition of calcium and thrombin and the material is flowing through gels employing a pressure‑driven system.29 A permeation coefficient (Ks) is obtained indicating the pore size of the fibrin network. Thus, permeability of the fibrin clot reflects how tightly packed the fibrin clot is.30
The euglobulin clot lysis test reflects the overall fibrinolytic activity in plasma.31 The blood sample is obtained in chilled tubes and placed on ice. After centrifugation, the collected plasma is diluted with acetic acid and the sample is incubated on ice. Thereafter, a precipitate is formed, named the euglobulin fraction, which contains plasminogen, tPA, and fibrinogen. Thus, α2-antiplasmin, PAI‑1, and TAFI are not included in the euglobulin fraction. The supernatant of the sample is discarded and the precipitate is dissolved in buffer and clotted with thrombin. The time to clot lysis is finally determined by visual inspection. The euglobulin clot lysis test was previously used as a screening test, but the usefulness is limited due to low reproducibility and because the test is only sensitive for part of the fibrinolysis.23 Today, the euglobulin test is replaced by more specific functional and immunological assays.
The Global Thrombosis Test is a point‑of‑care test that employs nonanticoagulated whole blood.32 It measures shear‑induced clot formation (time required to form an occlusive thrombus) and subsequent lysis (time required to lyse the thrombus). This is only a screening test, and individuals demonstrating abnormal test results have to be further investigated with laboratory tests reflecting fibrinolysis in more detail.
The prospect of implementing fibrinolysis assays in clinical practice
Development and standardization of analyses for investigation of fibrinolysis have progressed much slower that standardization of other tests of the coagulation system, and routine high‑throughput tests of fibrinolysis are still lacking.33
Standardization of the antigen assays as a measurement of PAI‑1 and t‑PA is poor and it is not possible to directly compare absolute values across studies using different methods.34 This limitation strongly compromises the aggregation of knowledge on the clinical significance of altered fibrinolysis in the onset and progression of disease.
When it comes to the dynamic assays, the ROTEM / TEG assays are widely implemented in clinical practice and fairly standardized across laboratories, since they are validated and commercially available. However, these analyses only have limited sensitivity and capability of performing detailed analyses of fibrin clot properties. Keeping these limitations in mind, ROTEM / TEG assays can reveal severe hyperfibrinolysis, but protocols for the application of these tests for investigation of hyperfibrinolysis in acute clinical care are still lacking.34
The dynamic clot formation and lysis assays are poorly standardized across laboratories, which use their individual research protocols.35 While employing these assays, the most valuable parameters are 50% clot lysis time or zymogen activation rates. In order to standardize calculation of these parameters, the International Society on Thrombosis and Hemostasis / Scientific and Standardization Committee (Subcommittee on Fibrinolysis) has published freely available applications to meet the need for transparency when calculating these most central parameters.36
From a clinical point of view, the dynamic fibrin clot formation and lysis analyses are the most promising methods. Despite the difficulties and lack of standardization of these analyses, research on the fibrinolysis system is progressing and will most probably lead to a future with more complete models and better diagnostic methods for analysis of fibrin clot properties.
Fibrin clot properties and fibrinolysis in patients with coronary artery disease
In the second part of the article, we systematically review the literature on markers of fibrin clot properties and fibrinolysis in CAD and their association to clinical outcomes in these patients.
A literature search was performed in PubMed on July 2, 2021 using the following search string: (((((((((((((((((((((“Fibrinolysis”[MeSH]) OR (“Fibrin”[MeSH])) OR (“Fibrin Clot Lysis Time”[MeSH])) OR (“Plasminogen Activator Inhibitor 1”[MeSH])) OR (“Plasminogen Activator Inhibitor 2”[MeSH])) OR (“Carboxypeptidase B2”[MeSH])) OR (“Factor XIII”[MeSH])) OR (“Factor XIIIa”[MeSH])) OR (fibrinolysis)) OR (hypofibrinolysis)) OR (“clot structure”)) OR (“clot permeability”)) OR (“clot lysis assay”)) OR (plasminogen activator inhibitor‑1)) OR (plasminogen activator inhibitor‑2)) OR (PAI‑1)) OR (PAI‑2)) OR (“thrombin‑activatable fibrinolysis inhibitor”)) OR (TAFI)) OR (“Carboxypeptidase B2”)) OR (“factor xiii”)) AND (((((((((((((“Coronary Artery Disease”[MeSH]) OR (“Coronary Occlusion”[MeSH])) OR (“Coronary Stenosis”[MeSH])) OR (“Coronary Thrombosis”[MeSH])) OR (“Acute Coronary Syndrome”[MeSH])) OR (“Angina, Unstable”[MeSH:NoExp])) OR (“Myocardial Infarction”[MeSH])) OR (“coronary artery disease”)) OR (“coronary occlusion”)) OR (“coronary thrombosis”)) OR (“acute coronary syndrome”)) OR (“unstable angina”)) OR (“myocardial infarction”)).
We included studies 1) investigating at least one marker of fibrin clot properties in blood samples from patients with CAD, 2) including at least 15 patients, and 3) either comparing CAD patients with non‑CAD patients / healthy controls or investigating the association between fibrin clot properties and CAD severity or unfavorable outcome in CAD patients, for example, reinfarction, no‑reflow, or mortality. Stable CAD was defined as asymptomatic CAD verified with coronary angiography or stable angina pectoris (AP). Acute coronary syndrome was defined as unstable AP or AMI. We focused on dynamic plasma‑based assays and markers of clot properties (eg, fibrin diameter, clot permeability), since single circulating markers as tPA and PAI‑1 provide less detailed information on clot properties, as discussed above.
Fibrin clot properties in patients with acute coronary syndrome compared with those with stable coronary artery disease or healthy controls
The pathophysiology, diagnosis, and prognostic markers of ACS are probably some of the most researched fields within medicine. In line with this, interest for the role of fibrinolysis in myocardial infarction emerged already in the 1950s.37 Both clot structure, clot permeability, and clot lysis time have been investigated. An overview of relevant literature is provided in Table 2.
Abbreviations: ←→ no difference; ACS, acute coronary syndrome (MI or unstable AP); AP, angina pectoris, CAD, coronary artery disease; MI, myocardial infarction; others, see Table 1 | |
Clot permeability | ↓ in previous MI vs healthy controls54,56 and ACS vs stable AP55 |
Clot structure | ↓ fiber diameter,53,57 ↓ fiber length,53 ↑ no. of fibers,53 ↓ porosity53 in MI vs healthy controls |
Clot stiffness | ↑ in ACS vs healthy controls53 |
Euglobulin clot lysis assays (↑ lysis time and ↓ % lysis indicate decreased lysis susceptibility) |
|
Plasma clot formation and lysis assays (↑ lysis time and ↓ % lysis indicate decreased lysis susceptibility) |
|
Older studies most commonly employed the euglobulin lysis time38-49 or % lysis of either native clots or on fibrin plates.45,48,50-52 The majority of these studies found impaired fibrinolysis in AMI or ACS patients when compared with healthy controls indicated by prolonged lysis time38-44 or % lysis.50 The difference in fibrin clot properties when comparing ACS and stable CAD is less evident, as some studies found similar lysis times between these groups.45-49,51,52 It should be noted that some of these studies were small. Nonetheless, these studies formed an important foundation for research employing other methods. Subsequent studies found that patients with previous or ongoing ACS had fibrin clots which were stiffer,53 less permeable,54-56 and consisted of thinner, shorter, and more numerous fibrin fibers53,57 than healthy controls. In accordance with these findings, patients with MI and ACS were consistently found to have increased net fibrin formation58 and impaired fibrinolysis when compared with healthy controls as indicated by prolonged clot lysis times55,58-60 or decreased % lysis61,62 using plasma‑based turbidimetric fibrin clot formation and lysis assays. Studies by Bryk et al63 and Siegerink et al64 also found longer lysis times in patients with previous MI compared with healthy controls; however, these findings were not replicated in other studies.54,65
Fibrin clot properties and lysis in stable coronary artery disease
Studies investigating fibrin clot properties in stable CAD are summarized in Table 3. Though fewer studies were identified on this subject, the available evidence indicates that patients with stable CAD, like ACS patients, also have altered fibrin clot properties and less susceptibility to lysis. Studies by the group of Undas et al66-68 found lower clot permeability and longer lysis times in stable CAD patients than in healthy controls. This was supported by similar results in both stable CAD versus healthy controls69-71 and in renal and cardiac transplant patients with CAD who had longer lysis times72 and lower % lysis73 than their peers with no CAD.
a Plasma + tPA added to standardized fibrin Tablet, fibrin D‑dimer generation measured.
| |
Clot permeability | ↓ in CAD vs healthy controls66-68 |
Euglobulin clot lysis assays (↑ lysis time and ↓ % lysis indicate decreased lysis susceptibility) |
|
Plasma clot formation and lysis assays (↑ lysis time and ↓ % lysis indicate decreased lysis susceptibility) |
|
Global fibrinolytic capacitya | ↓ in CAD vs healthy controls97 |
Fibrin clot properties and lysis and unfavorable outcome in patients with existing coronary artery disease
As it emerged that fibrin clot properties and susceptibility to lysis are altered in patients with stable CAD or ACS, the next question follows naturally: how do fibrin clot properties relate to outcomes in CAD patients? Relevant studies are summarized in Table 4. Studies from the 1980s and 1990s found that longer euglobulin lysis times were associated with increased cardiovascular mortality and higher restenosis rate after angioplasty in patients with stable AP74,75 as well as higher risk of reinfarction after previous MI.76 Studies on clot structure and permeability showed that decreased clot permeability and thinner fibrin fibers were associated with increased risk of MI in stable CAD,22 no‑reflow after MI,77 and cardiovascular mortality.78 Two recent large prospective studies investigated plasma clot formation and lysis in patients with stable CAD79 and ACS.80 In a substudy to the PLATO study including more than 4000 ACS patients followed for 1 year, Sumaya et al80 reported an adjusted hazard ratio (HR) for cardiovascular death of 1.36 (95% CI, 1.17–1.59) for each 50% increase in lysis time. Neergaard‑Petersen et al79 followed 786 CAD patients for a median of 3 years and reported an adjusted HR of 2.4 (95% CI, 1.2–4.8) for a composite end point of cardiovascular death, MI, or stroke with net fibrin formation in the highest quartile, but did not find an association between their end point and lysis time. Finally, using the Global Thrombosis Test, a recent study by Farag et al81 included 436 patients with ST‑segment elevation MI with follow‑up of 1 year and reported an adjusted HR of 9.1 (95% CI, 5.29–15.75) for cardiovascular death, MI, or stroke with baseline lysis times longer than 2500 seconds. To conclude, tighter clot structure, decreased permeability, and susceptibility to lysis appear to be present in stable and unstable CAD and to predict unfavorable outcome in patients with CAD.
Clot permeability | Outcomes associated with ↓ clot permeability: CV mortality in hemodialysis patients, follow‑up 3 years;78 no‑reflow after MI77 |
Clot structure | MI during ASA treatment associated with ↓ fiber diameter in stable CAD, median follow‑up 3 years22 |
Euglobulin clot lysis assays (↑ lysis time and ↓ % lysis indicate decreased lysis susceptibility) |
|
Plasma clot formation and lysis assays (↑ lysis time and ↓ % lysis indicate decreased lysis susceptibility) |
|
Global Thrombosis Test | CV mortality, MI or stroke associated with ↑ lysis time in ACS100 or STEMI,81 follow‑up 1 year |
Pharmacological treatment of coronary artery disease: potential for modulating fibrin clot properties
As current evidence supports the importance of altered fibrin clot properties in CAD development and unfavorable outcome, this opens the question of possible interventions targeted against the fibrinolytic system. Both existing and new treatment modalities may be of interest in this respect.
Statins and acetylsalicylic acid (ASA) remain cornerstones in treatment and prevention of CAD. Statins work through lowering circulating low‑density lipoprotein–bound cholesterol, reducing atherosclerotic plaque formation, while ASA inhibits platelet cyclooxygenase‑1 and subsequent thromboxane A2 formation, leading to decreased platelet aggregation and thrombus formation on the surface of the atherosclerotic plaque. Besides these well‑described mechanisms, ASA and statins may also exert beneficial effects through other pathways, including fibrin clot modulation. Addition of ASA caused decreased clot rigidity and higher susceptibility to lysis in a purified fibrinogen model.82 Likewise, healthy volunteers formed fibrin clots with larger fiber diameter and pore size after 1 week from ASA ingestion, even with low‑dose ASA.82,83 The mechanism behind these findings may be an increased acetylation of fibrinogen in the presence of ASA which influences fibrin cross‑linking.84 Statin treatment has also been shown to modulate fibrin clot properties. Patients who received simvastatin had increased clot permeability after treatment independently of the effect on plasma low‑density lipoprotein.85 Recently, a post hoc study to a randomized study in patients with previous venous thromboembolism (n = 255) measured clot lysis time before and after 28 days of rosuvastatin treatment86 and found that clot lysis time was decreased at day 28 in the rosuvastatin group but not in the control group. Finally, low‑dose rivaroxaban, a direct FXa inhibitor, has recently been approved for ACS prevention in high‑risk CAD patients in combination with ASA. The effect of rivaroxaban on fibrin clot properties has been investigated both in vitro and in vivo. Varin et al87 found that addition of rivaroxaban to plasma samples in vitro induced increased fibrin diameter, pore size, permeability, and susceptibility to lysis. Similarly, Janion‑Sadowska et al88 found that fibrin clot permeability increased and lysis time decreased after rivaroxaban intake in patients with previous venous thromboembolism. These effects of rivaroxaban are thought to be due to decreased thrombin formation which will both influence clot structure directly and lead to less TAFI activation. To summarize, existing CAD therapy, both well tested and newer, may well hold potential to not only modulate known risk factors such as hypercholesterolemia and increased platelet activity, but also influence fibrin clot structure. Prospective studies investigating whether fibrin clot properties can predict benefit or failure of these therapies for CAD are awaited. Regarding future treatment modalities, therapies targeting TAFI or PAI‑1 are being developed, as recently reviewed by Kietsiriroje et al,4 but have not been tested in CAD and are not yet approved for human use.
Conclusion
This comprehensive review of the literature illustrates that altered fibrin clot properties and fibrinolysis capacity are prevalent in both stable and unstable CAD and probably contribute to poor prognosis in patients with CAD. Several laboratory methods to assess clot properties and fibrinolysis exist, but the majority of these are still mainly used in research and are not yet implemented in routine care. The dynamic clot formation and lysis assays hold promise as future diagnostic tools, however, further standardization of these assays is strongly needed, as well as efforts to establish them in the routine laboratory setting. Moreover, further research is warranted before treatment options for modulation of the fibrinolytic system can be considered in CAD patients.
- Cortesi PA, Fornari C, Madotto F, et al. Trends in cardiovascular diseases burden and vascular risk factors in Italy: the Global Burden of Disease study 1990‑2017. Eur J Prev Cardiol. 2021; 28: 385‑396. | Crossref
- Nowbar AN, Gitto M, Howard JP, et al. Mortality from ischemic heart disease. Circ Cardiovasc Qual Outcomes. 2019; 12: e005375. | Crossref
- Canto JG, Kiefe CI, Rogers WJ, et al. Number of coronary heart disease risk factors and mortality in patients with first myocardial infarction. JAMA. 2011; 306: 2120‑2127. | Crossref
- Kietsiriroje N, Ariëns RAS, Ajjan RA. Fibrinolysis in acute and chronic cardiovascular disease. Semin Thromb Hemost. 2021; 47: 490‑505. | Crossref
- Memtsas VP, Arachchillage DRJ, Gorog DA. Role, laboratory assessment and clinical relevance of fibrin, factor XIII and endogenous fibrinolysis in arterial and venous thrombosis. Int J Mol Sci. 2021; 22: 1472. | Crossref
ARTICLE INFORMATION