Mid-regional pro-adrenomedullin and lactate dehydrogenase as predictors of left ventricular remodeling in patients with myocardial infarction treated with percutaneous coronary intervention
Key words: biomarkers, lactate dehydrogenase, left ventricular remodeling, mid-regional pro-adrenomedullin, myocardial infarction


 CC BY-NC-SA 4.0
Mid-regional pro-adrenomedullin and lactate dehydrogenase as predictors of left ventricular remodeling in patients with myocardial infarction treated with percutaneous coronary intervention
Introduction: The main impact of myocardial infarction (MI) is shifting from acute mortality to adverse remodeling, chronic left ventricular (LV) dysfunction, and heart failure.
Objectives: The aim of this study was to assess relationships between levels of circulating biomarkers and the function of LV after MI.
Patients and methods: This was a prospective study of 80 patients with MI treated with percutaneous coronary intervention. Novel biomarkers including mid‑regional pro‑adrenomedullin (MR‑proADM), Notch‑1, syndecan‑4, myeloperoxidase, S‑100 protein, soluble ST‑2, as well as markers of inflammatory response and tissue injury: galectin‑3, C‑reactive protein (CRP), lactate dehydrogenase (LDH), and interleukin‑6 (IL‑6) were assessed in the acute phase of MI. Echocardiography was performed at baseline and 6 months.
Results: Adverse remodeling, defined as more than 20% increase in LV end‑diastolic volume, occurred in 26% of patients. Reverse remodeling (>10% reduction in LV end‑systolic volume) was observed in 52% of patients. In the univariable analysis, higher levels of MR‑proADM and LDH were predictors of adverse remodeling and higher levels of MR‑proADM, LDH, CRP, and IL‑6 were negative predictors of reverse remodeling. In the multivariable model, LDH remained an independent predictor of adverse remodeling (odds ratio [OR], 3.13; 95% CI, 1.42–8.18; P = 0.003) and a negative predictor of reverse remodeling (OR, 0.37; 95% CI, 0.17–0.8; P = 0.005).
Conclusions: LDH and MR‑proADM seem to be promising biomarkers of adverse remodeling. On the other hand, higher levels of these biomarkers were associated with reduced chance of occurrence of favorable reverse remodeling in MI patients. However, further studies on larger groups of patients are necessary to confirm these data.
What's new?
The key finding of our analysis is that lactate dehydrogenase (LDH) and mid‑regional pro‑adrenomedullin (MR‑proADM) seem to be promising potential biomarkers of left ventricular (LV) function after myocardial infarction (MI). Higher levels of both biomarkers measured in the acute phase of MI were predictors of adverse LV remodeling after 6 months from MI, a negative process defined as an increase in end‑diastolic volume of LV, which could lead to chronic heart failure. On the other hand, higher levels of both biomarkers were associated with reduced chance of occurrence of a favorable phenomenon referred to as “reverse remodeling,” which is associated with a reduced LV volume and better prognosis. Identification of patients at a high risk of adverse LV remodeling is becoming an important issue as acute mortality after MI has been steadily decreasing and the main impact of ischemia is shifting to chronic LV dysfunction.
Introduction
Myocardial infarction (MI) is a complex syndrome that, despite being associated with decreasing acute mortality, remains a significant public health problem due to its high morbidity and long‑term mortality.1,2 The main impact of MI is shifting towards adverse remodeling, a process of alteration of left ventricular (LV) geometry and function, which could eventually lead to clinically apparent heart failure.1,3-7 On the other hand, due to early revascularization and pharmacotherapy, some patients after MI recover from initial LV dysfunction.8-10 Thus, there is an increasing need to identify new tools for risk stratification and outcome prediction in patients after MI. In this application, biomarker testing is an attractive idea since it is noninvasive, not operator dependable, and widely available.11 In the present study, we aimed to assess novel and promising biomarkers including mid‑regional pro‑adrenomedullin (MR‑proADM), Notch‑1, syndecan‑4, myeloperoxidase, S‑100 protein, soluble ST‑2 (sST‑2), as well as general biomarkers of inflammatory response and tissue injury: galectin‑3, C‑reactive protein (CRP), lactate dehydrogenase (LDH), and interleukin (IL)-6 in relation to LV function in patients after MI.
Patients and methods
Study population and design
Our study is a prospective registry focused on LV function assessment in patients with MI treated with percutaneous coronary intervention (PCI). All procedures involving study participants were performed according to the principles published in the Declaration of Helsinki and its amendments. The study was approved by the local ethics committee at the Jagiellonian University Medical College (decision no: 1072.6120.130.2017). Patients provided written informed consent to participate in the study. The inclusion criteria for entering the study were as follows: ST‑segment elevation MI (STEMI) or non‑STEMI (NSTEMI), treatment with primary PCI, immediate invasive treatment strategy with primary PCI performed within 2 hours from hospital admission in NSTEMI patients, and culprit lesion located in a major coronary artery. Exclusion criteria comprised prior history of MI, baseline LV ejection fraction (LVEF) below 25%, and cardiogenic shock on admission (Killip class IV).12 Demographic data, baseline clinical characteristics, pharmacotherapy, angiography images, and PCI details were analyzed. Angiography images were assessed by an independent investigator. The epicardial coronary flow before and after PCI was assessed using the Thrombolysis In Myocardial Infarction (TIMI) scale.13 Serial 12‑lead electrocardiogram recordings were performed on admission, during hospital stay, and at discharge according to local protocol.14 Patients received standard of care pharmacotherapy.14,15 Serum samples were collected for biomarker analyses. We assessed the levels of MR‑proADM, Notch‑1, syndecan‑4, myeloperoxidase, S‑100 protein, sST‑2 as well as biomarkers of inflammatory response and tissue injury: galectin‑3, CRP, LDH and IL‑6. Patients underwent echocardiography examinations on day 2 or 3 of hospitalization and after 6 months of follow‑up. The main objectives of echocardiography were to assess the occurrence of adverse remodeling, defined as more than 20% increase in LV end‑diastolic volume, and the improvement of LV geometry, defined as more than 10% reduction of LV end‑systolic volume, further referred to as “reverse remodeling.”8-11,16,17
Blood sampling protocol and biomarkers analysis
Peripheral venous blood for biomarker analysis was collected between day 2 and 3 of hospitalization, using Sarstedt S‑Monovette tubes (Sarstedt, Nümbrecht, Germany). Plasma was separated from whole blood by centrifugation at 3000 rpm for 15 minutes, then it was aliquoted and frozen at −80 °C for further analysis. The MAGPIX fluorescent‑based detection system (Luminex Corp, Austin, Texas, United States) and the luminex assays (Merck Millipore, Burlington, Massachusetts, United States) were used to measure the levels of galectin‑3, MR‑proADM, Notch‑1, myeloperoxidase, sST2, and syndecan‑4. The electrochemiluminescence immunoassay method was used to measure the levels of IL‑6 and S‑100 protein (Cobas 6000 system, Roche AG, Basel, Switzerland). The spectrophotometric method according to the International Federation of Clinical Chemistry was used to measure levels of LDH (Cobas Pro system, Roche AG). The latex particle–enhanced immunoturbidimetric method was used to measure CRP levels (Cobas Pro system).
Echocardiography imaging
Transthoracic echocardiography was performed on day 2 or 3 of hospitalization and after 6 months with the Vivid E9 ultrasound machine using 2- and 3‑dimensional scans (General Electric, Boston, Massachusetts, United States). Baseline and follow‑up examinations were performed by a single echocardiographist. Images were analyzed by an independent investigator using EchoPac Clinical Workstation System (General Electric). The LV volume and LVEF were calculated using the 3‑dimensional triplane Simpson’s method.18 The LV volumes were indexed for body surface using the DuBois formula.19 The wall motion score index was calculated by assigning a value of 1 to 4 to each of the 16 segments of LV as follows: normokinetic segment = 1; hypokinetic segment = 2; akinetic segment = 3; dyskinetic segment = 4.20
Statistical analysis
Quantitative variables were described using mean and SD (for normal distribution of data) or median with interquartile range (for nonnormal distribution of data). Normality was assessed by the Shapiro–Wilk test. Baseline vs follow‑up comparison of continuous variables was performed using the paired t test or the Wilcoxon signed rank test if differences between baseline and follow‑up were not normally distributed. The Welch test was used for comparing groups with unequal variances. The homogeneity of variances was tested by the Levene test. Categorical variables were presented as percentages. The χ2 or Fisher exact test was used for comparing categorical data, as appropriate. Logistic regression analysis was performed to identify predictors of adverse and reverse remodeling. Variables including demographic data, clinical characteristics, angiographic parameters, and biomarker levels were considered when calculating simple models. The final multiple models were constructed using the stepwise combined (forward / backward) technique with minimization of the Bayesian Information Criterion as a target, taking into account all variables with a P value of less than 0.2 in the simple model or those of clinical importance. The results are presented as odds ratios with associated 95% CIs as well as receiver operating characteristic (ROC) curves with areas under the curve. The best cutoff point was selected as the point on the ROC curve with the lowest distance to the top‑left corner of the plot. The level of statistical significance was set at a P value of less than 0.05. All statistical analyses were performed using R, version 4.1.1 (R Foundation for Statistical Computing, Vienna, Austria) with “rms” package, version 6.2‑0 and JMP 15.2 (SAS Institute Inc, Cary, North Carolina, United States).
Results
Clinical characteristics and echocardiographic parameters
A total of 80 consecutive patients with acute MI were included in the study. The study group characteristics are shown in Table 1. Most patients were male, and the most common clinical presentation was STEMI. Culprit lesion was most commonly located in the left anterior descending artery (LAD). TIMI grade 3 flow after PCI was achieved in nearly 90% of patients. Dual antiplatelet therapy with aspirin and ticagrelor was applied in most patients. Cardiovascular risk factors, other angiographic details, and pharmacotherapy at discharge are presented in Table 1. Echocardiographic parameters measured at baseline and follow‑up are shown in Supplementary material, Figure S1. During follow‑up, we observed a significant increase in LVEF with corresponding changes in the wall motion score index and a significant decrease in LV end‑systolic volume index. In addition, a decrease in LV end‑diastolic volume index was observed; however, without reaching statistical significance.
Clinical characteristics | ||
Data are presented as percentage of patients unless otherwise indicated.
Abbreviations: ACEI, angiotensin‑converting enzyme inhibitor; ARB, angiotensin receptor blocker; BMI, body mass index; BSA, body surface area; LAD, left anterior descending artery; MRA, mineralocorticoid receptor antagonist; NSTEMI, non–ST‑segment elevation myocardial infarction; PCI, percutaneous coronary intervention; STEMI, ST‑segment elevation myocardial infarction; TIMI, Thrombolysis in Myocardial Infarction score | ||
Age, y, mean (SD) | 63 (11) | |
Male gender | 65 | |
STEMI | 72 | |
NSTEMI | 28 | |
Arterial hypertension | 65 | |
Diabetes mellitus | 21 | |
Hypercholesterolemia | 52 | |
Smoking | 46 | |
BMI, kg/m2, mean (SD) | 27.4 (3.8) | |
BSA, m2, mean (SD) | 1.9 (0.2) | |
Angiography details and PCI results | ||
LAD culprit lesion | 51 | |
Multivessel disease | 35 | |
TIMI flow before PCI | 0 | 52 |
1 | 8 | |
2 | 25 | |
3 | 15 | |
TIMI 3 flow after PCI | 89 | |
Slow flow / no reflow | 8 | |
Distal embolization | 6 | |
Persistent ST‑segment elevation at discharge | 33 | |
Glycoprotein IIb / IIIa inhibitor | 37 | |
Aspiration thrombectomy during PCI | 38 | |
Complete revascularization at discharge | 94 | |
Treatment at discharge | ||
Acetylsalicylic acid | 100 | |
Ticagrelor | 71 | |
Clopidogrel | 29 | |
β-Blocker | 100 | |
ACEI/ARB | 87 | |
MRA | 33 | |
Loop diuretic | 33 | |
Statin | 100 | |
Adverse remodeling analysis
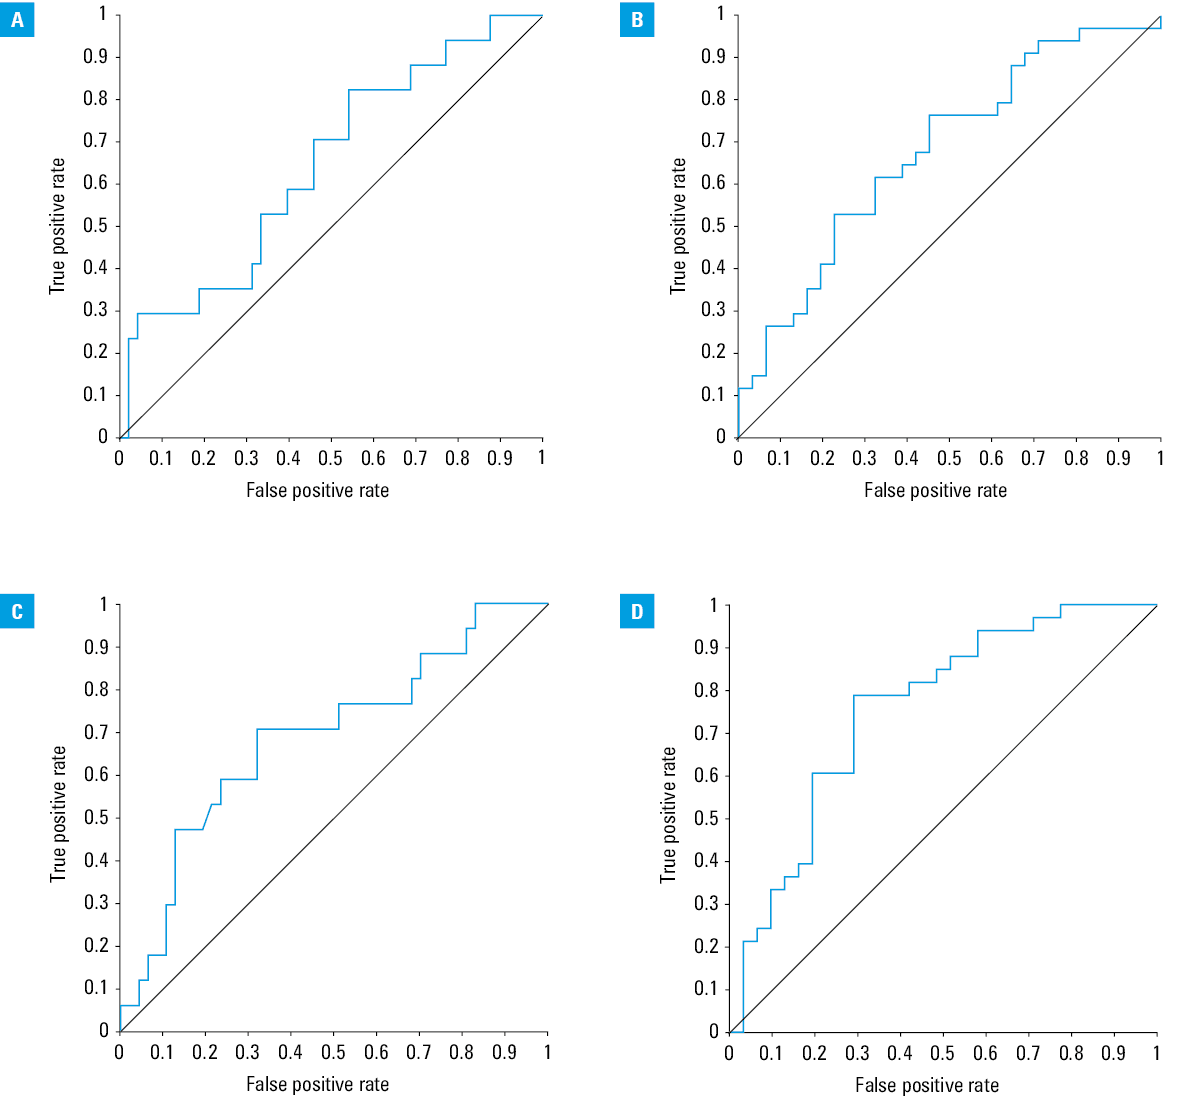
In the present study, adverse remodeling occurred in 26% of patients. Individuals who developed adverse remodeling more commonly had diabetes mellitus, distal embolization on angiography during PCI, persistent ST‑segment elevation at discharge, and higher levels of MR‑proADM and LDH (Table 2). In the univariable regression analysis, prevalence of diabetes mellitus, persistent ST‑segment elevation at discharge, distal embolization during PCI, as well as higher levels of MR‑proADM and LDH were significant predictors of adverse remodeling (Table 3). In the multivariable regression analysis, diabetes mellitus, distal embolization, and higher LDH level remained independent predictors of adverse remodeling (Table 3). Since the level of MR‑proADM was higher in patients with adverse remodeling and it was a significant predictor in the univariable regression analysis, we constructed a second model with MR‑proADM forced in the stepwise selection process (Table 3). In this analysis, MR‑proADM, platelet count, and LAD culprit lesion were significant predictors of adverse remodeling. In Figure 1, we present the ROC analysis with cutoff values for MR‑proADM and LDH for predicting adverse remodeling.
Clinical characteristics | Adverse remodeling (+) (n = 21) | Adverse remodeling (–) (n = 59) | P value | |
Data are presented as percentage of patients unless otherwise indicated.
Abbreviations: GFR, glomerular filtration rate; IQR, interquartile range; MR‑proADM, mid‑regional pro‑adrenomedullin; NT‑proBNP, N‑terminal pro–B‑type natriuretic peptide; sST2, soluble suppression of tumorigenicity 2; others, see Table 1 | ||||
Age, y, mean (SD) | 61 (10) | 64 (11) | 0.4 | |
Male gender | 65 | 65 | – | |
STEMI | 76 | 71 | 0.65 | |
NSTEMI | 24 | 29 | 0.65 | |
Arterial hypertension | 65 | 65 | – | |
Diabetes mellitus | 41 | 15 | 0.02 | |
Hypercholesterolemia | 65 | 48 | 0.23 | |
Smoking | 53 | 44 | 0.51 | |
BMI, kg/m2, mean (SD) | 28.3 (3) | 27.1 (4) | 0.25 | |
Baseline GFR, ml/min/1.73 m2, median (IQR) | 76 (65–90) | 90 (78–90) | 0.08 | |
BSA, m2, mean (SD) | 1.93 (0.18) | 1.9 (0.2) | 0.56 | |
Angiography details and PCI results | ||||
LAD culprit lesion | 65 | 46 | 0.18 | |
Multivessel disease | 43 | 33 | 0.53 | |
TIMI flow before PCI | 0 | 59 | 50 | 0.85 |
1 | 6 | 8 | ||
2 | 17.5 | 27 | ||
3 | 17.5 | 15 | ||
TIMI 0 flow before PCI | 59 | 50 | 0.36 | |
TIMI 3 flow after PCI | 82 | 92 | 0.29 | |
Slow flow / no reflow | 18 | 4 | 0.09 | |
Distal embolization | 18 | 2 | 0.02 | |
Persistent ST‑segment elevation at discharge | 56 | 24 | 0.02 | |
Glycoprotein IIb / IIIa inhibitor | 53 | 31 | 0.11 | |
Aspiration thrombectomy during PCI | 53 | 33 | 0.15 | |
Complete revascularization at discharge | 93 | 94 | >0.99 | |
Biomarker levels | ||||
MR‑proADM, ng/ml, median (IQR) | 3.96 (3.6–5.9) | 3.68 (3.31–4.26) | 0.04 | |
Notch‑1, ng/ml, mean (SD) | 5.09 (1.98) | 4.99 (2.19) | 0.86 | |
Syndecan‑4, ng/ml, median (IQR) | 4.57 (4.09–5.18) | 4.45 (2.96–5.2) | 0.37 | |
Myeloperoxidase, ng/ml, median (IQR) | 147.14 (74.6–206.3) | 91.04 (55.5–184) | 0.14 | |
S100, µg/l, median (IQR) | 0.02 (0.01–0.04) | 0.03 (0.02–0.04) | 0.53 | |
C‑reactive protein, mg/l, median (IQR) | 28 (18.3–73.9) | 13 (7.6–46.1) | 0.05 | |
Lactate dehydrogenase, U/l, median (IQR) | 566 (307–884.5) | 358 (254–540) | 0.02 | |
Interleukin‑6, pg/ml, median (IQR) | 2.52 (1.50–19.62) | 3.2 (1.5–18.4) | 0.78 | |
sST2, ng/ml, median (IQR) | 5.81 (4.2–13.6) | 6.38 (4.2–10.4) | 0.92 | |
Galectin‑3, ng/ml, median (IQR) | 6.62 (4.5–7.8) | 6.17 (3.86–9.41) | 0.88 | |
NT‑proBNP, pg/ml, median (IQR) | 34.3 (34.3–34.3) | 34.4 (34.3–46.3) | 0.28 | |
Treatment at discharge | ||||
Acetylsalicylic acid | 100 | 100 | – | |
Ticagrelor | 79 | 69 | 0.74 | |
Clopidogrel | 21 | 31 | 0.74 | |
β-Blocker | 100 | 100 | – | |
ACEI/ARB | 93 | 86 | 0.67 | |
MRA | 29 | 35 | 0.76 | |
Loop diuretic | 43 | 31 | 0.52 | |
Statin | 100 | 100 | – | |
Parameter | OR | 95% CI | P value |
a Model with MR‑proADM forced during the stepwise selection process, adjusted for NT‑proBNP
| |||
Univariable regression | |||
Diabetes mellitus | 4.1 | 1.16–14.8 | 0.03 |
Distal embolization | 10.07 | 1.18–212.7 | 0.03 |
Persistent ST‑segment elevation after PCI | 3.97 | 1.2–13.7 | 0.02 |
MR‑proADM, per 1 ng/ml | 1.6 | 1.02–2.7 | 0.04 |
LDH, per 100 U/l | 1.22 | 1.04–1.46 | 0.02 |
NT‑proBNP, per 1 pg/ml | 0.99 | 0.97–1.0 | 0.08 |
Baseline GFR, per 1 ml/min/1.73 m2 | 0.96 | 0.91–1.0 | 0.04 |
Multivariable model | |||
Diabetes mellitus | 6.8 | 1.57–34.6 | 0.01 |
Distal embolization | 14.2 | 1.28–387 | 0.03 |
LDH, per 1 U/l | 3.13 | 1.42–8.18 | 0.003 |
Multivariable forced modela | |||
LAD culprit | 5.5 | 1.08–38.6 | 0.04 |
MR‑proADM, per 1 ng/ml | 3.4 | 1.58–9.2 | 0.001 |
Platelet count, per 1 × 10³/µl | 1.03 | 1.01–1.06 | <0.001 |
Abbreviations: AUC, area under the curve; others, see Table 2
Reverse remodeling analysis
Reverse remodeling was observed in 52% of patients. Individuals with reverse remodeling less often presented with baseline TIMI grade 0 flow, less frequently needed aspirational thrombectomy during PCI, and had lower levels of MR‑proADM, CRP, LDH, and IL‑6 (Table 4). In the univariable regression analysis, no need for aspirational thrombectomy was a significant predictor of reverse remodeling. On the contrary, higher levels of MR‑proADM, IL‑6, CRP, and LDH lowered the odds for reverse remodeling (Table 5). In the multivariable regression analysis, only LDH remained a significant predictor (Table 5). Similar to the adverse remodeling analysis, we constructed a second model with MR‑proADM forced during the stepwise selection process (Table 5). In this analysis, hypercholesterolemia and higher levels of MR‑proADM and IL‑6 were significant negative predictors of reverse remodeling. In Figure 1, we present the ROC analysis with cutoff values for MR‑proADM and LDH for predicting reverse remodeling.
Clinical characteristics | Reverse remodeling (+) (n = 42) | Reverse remodeling (–) (n = 38) | P value | |
Data are presented as percentage of patients unless otherwise indicated.
| ||||
Age, y, mean (SD) | 63 (10) | 63 (11) | 0.75 | |
Male gender | 71 | 58 | 0.29 | |
STEMI | 71 | 74 | 0.75 | |
NSTEMI | 29 | 26 | 0.75 | |
Arterial hypertension | 62 | 68 | 0.61 | |
Diabetes mellitus | 18 | 26 | 0.42 | |
Hypercholesterolemia | 44 | 61 | 0.17 | |
Smoking | 47 | 45 | 0.88 | |
BMI, kg/m2, mean (SD) | 27.3 (4.1) | 27.4 (3.6) | 0.90 | |
BSA, m2, mean (SD) | 1.93 (0.2) | 1.87 (0.2) | 0.26 | |
Baseline GFR, ml/min/1.73 m2, median (IQR) | 90 (75–90) | 89 (69–90) | 0.53 | |
Angiography details and PCI results | ||||
LAD culprit lesion | 47 | 55 | 0.53 | |
Multivessel disease | 27 | 43 | 0.2 | |
TIMI flow before PCI | 0 | 38 | 68 | 0.1 |
1 | 12 | 3 | ||
2 | 29 | 19 | ||
3 | 21 | 10 | ||
TIMI 0 flow before PCI | 38 | 68 | 0.02 | |
TIMI 3 flow after PCI | 91 | 87 | 0.6 | |
Slow flow / no reflow | 3 | 13 | 0.13 | |
Distal embolization | 2.9 | 9.7 | 0.26 | |
Persistent ST‑segment elevation at discharge | 27 | 39 | 0.32 | |
Glycoprotein IIb / IIIa inhibitor | 26.5 | 48.4 | 0.07 | |
Aspiration thrombectomy during PCI | 26.5 | 51.6 | 0.04 | |
Complete revascularization at discharge | 94 | 93 | >0.99 | |
Biomarker levels | ||||
MR‑proADM, ng/ml, median (IQR) | 3.57 (3.23–4.0) | 3.98 (3.60–5.35) | 0.01 | |
Notch‑1, ng/ml, mean (SD) | 5.02 (2.15) | 5.01 (2.12) | 0.98 | |
Syndecan‑4, ng/ml, median (IQR) | 4.54 (3.27–5.19) | 4.25 (3.64–5.13) | 0.94 | |
Myeloperoxidase, ng/ml, median (IQR) | 80.91 (56–140.2) | 147.14 (67–214) | 0.09 | |
S100, µg/l, median (IQR) | 0.03 (0.02–0.03) | 0.03 (0.02–0.05) | 0.83 | |
C‑reactive protein, mg/l, median (IQR) | 10.5 (6.72–25.5) | 33 (16.9–95.3) | <0.001 | |
Lactate dehydrogenase, U/l, median (IQR) | 294 (225.5–414.5) | 545 (342–920) | <0.001 | |
Interleukin‑6, pg/ml, median (IQR) | 1.5 (1.5–6.6) | 9.01 (1.5–34) | 0.004 | |
sST2, ng/ml, median (IQR) | 7.3 (4.16–11.02) | 5.81 (4.16–9.84) | 0.67 | |
Galectin‑3, ng/ml, median (IQR) | 6.19 (4.83–10.25) | 6.34 (3.86–7.83) | 0.35 | |
NT‑proBNP, pg/ml, median (IQR) | 34.3 (34.3–34.3) | 34.3 (34.3–50.3) | 0.58 | |
Treatment at discharge | ||||
Acetylsalicylic acid | 100 | 100 | – | |
Ticagrelor | 82 | 60 | 0.09 | |
Clopidogrel | 18 | 40 | 0.09 | |
β-Blocker | 100 | 100 | – | |
ACEI/ARB | 85 | 90 | 0.71 | |
MRA | 33 | 33 | 1 | |
Loop diuretic | 27 | 40 | 0.3 | |
Statin | 100 | 100 | – | |
Parameter | OR | 95% CI | P value |
a Model with MR‑proADM forced during the stepwise selection process, adjusted for NT‑proBNP
| |||
Univariable regression | |||
No need for aspiration thrombectomy during PCI | 2.96 | 1.07–8.6 | 0.04 |
MR‑proADM, per 1 ng/ml | 0.55 | 0.31–0.89 | 0.01 |
C‑reactive protein, per 10 mg/l | 0.86 | 0.74–0.97 | 0.009 |
Interleukin‑6, per 10 pg/ml | 0.63 | 0.39–0.88 | 0.003 |
LDH, per 100 U/l | 0.67 | 0.50–0.83 | <0.001 |
NT‑proBNP, per 1 pg/ml | 1.001 | 1.0–1.006 | 0.69 |
Baseline GFR, per 1 ml/min/1.73 m2 | 1.02 | 0.98–1.06 | 0.34 |
Hypercholesterolemia | 0.5 | 0.18–1.33 | 0.16 |
Multivariable model | |||
Interleukin‑6, per 1 pg/ml | 0.79 | 0.58–1.09 | 0.14 |
LDH, per 1 U/l | 0.37 | 0.17–0.8 | 0.005 |
Multivariable forced modela | |||
Hypercholesterolemia | 0.31 | 0.09–0.95 | 0.04 |
MR‑proADM, per 1 ng/ml | 0.6 | 0.34–0.98 | 0.04 |
Interleukin‑6, per 1 pg/ml | 0.95 | 0.91–0.99 | 0.009 |
Discussion
The most important findings of the presented analysis are as follows: (i) most patients after acute MI presented an increase of LVEF and improvement of LV volumes during follow‑up; (ii) LDH and MR‑proADM seem to be promising potential biomarkers of adverse remodeling and negative markers of reverse remodeling; (iii) established clinical predictors of adverse remodeling such as distal embolization on angiography and lack of ST‑segment resolution, reflecting suboptimal reperfusion, were statistically significant in our analysis.
Adverse LV remodeling after MI is one of the main causes of heart failure, which is a global health problem and is considered to be a leading cause of cardiovascular mortality. Remodeling is a group of molecular, cellular, and interstitial changes that manifest as alterations in size, mass, geometry, and function of the LV.21 Clinical diagnosis is based on the detection of morphological changes of LV, mainly dilation of LV cavity. Despite different cutoff values for adverse remodeling, findings of dilated LV cavity and reduced LVEF are associated with worse long‑term prognosis. In the present study, we chose a cutoff value of a 20% increase in LV end‑diastolic volume, as it appears to be the most common definition in other reports. Remodeling is a time‑dependent process, which could continue up to 6 to 12 months after MI. A frequent time‑point for remodeling assessment is 6 months and such was chosen in our study.22
On the other hand, some patients after MI present restoration of LV geometry and recovery from initial LV dysfunction. A similar process was described in patients with chronic heart failure undergoing resynchronization therapy and was associated with favorable outcomes.8,10 In that setting, this phenomenon was called reverse remodeling. In patients after acute MI, reverse remodeling has been relatively poorly investigated. However, most recent therapies including early revascularization and pharmacotherapy targeted at neuro‑hormonal pathways aim at preventing adverse remodeling and promoting reverse remodeling and improvement of LV function after MI. Reverse remodeling is considered to be triggered by early myocardial revascularization, conditioned by preserved microvascular flow and is associated with improved long‑term outcome.8-10 In the AMICI (Acute Myocardial Infarction Contrast Imaging) trial10 and a study by Morishita et al,23 reverse remodeling was assessed after 6 months from MI, like in our analysis.
In our study, adverse remodeling occurred in 26% and reverse remodeling was observed in 52% of patients, which is consistent with previous reports.10,24 In a study by Bolognese et al,16 adverse remodeling was observed in 30% of patients after MI. In the AMICI trial, reverse remodeling occurred in 39% of patients.10 Grabka et al8 reported the occurrence of reverse remodeling in 37% of patients after MI. In our analysis, most patients presented an improvement of LVEF and reduction of LV volumes. Possible explanations are as follows: (i) all patients underwent primary PCI and there was a high rate of complete revascularization at discharge; (ii) there was a high rate of prescribed pharmacotherapy with a cardioprotective effect (all patients were discharged with a β-blocker and 87%, with an angiotensin‑converting enzyme inhibitor / angiotensin receptor blocker); (iii) individuals with initial severe dysfunction of LVEF were excluded from the analysis. Biomarker testing in relation to the prognosis of post‑MI changes of LV geometry and function is a promising idea. Ideal markers should be easily detectable from blood and allow to improve clinical decisions. Based on the presented results, MR‑proADM and LDH seem to be promising potential biomarkers of post‑MI adverse LV remodeling and negative markers of reverse remodeling.
Lactate dehydrogenase is an enzyme that transfers hydride between molecules. It is expressed extensively in blood cells and cardiomyocytes and is released during tissue damage and inflammatory reactions. Formerly, it was used for the diagnosis of MI.25 In previous reports, higher LDH levels were associated with larger infarct size.26 There is relatively little data about the relationship between LDH concentration and post‑MI adverse remodeling. In experimental rat models, a high LDH level was reported as an indicator of microvascular injury in reperfused STEMI.27-29 Lactate dehydrogenase was proposed by Reinstadler et al24 as an element of combined biomarker testing for predicting adverse remodeling. The high LDH level in the acute phase of MI possibly reflects larger infarct size and therefore might be predictive of adverse remodeling occurrence. In previous reports, initial infarct size was associated with adverse LV remodeling.30
Adrenomedullin is a peptide secreted in various tissues including the heart, endothelial cells, vascular smooth muscle cells, and fibroblasts.31,32 The adrenomedullin gene is upregulated in cardiomyocytes during pressure and volume overload and ventricular stretching. Adrenomedullin has a hypotensive effect, stimulates diuresis and vasodilatation. Because of the instability and short plasma half‑life of adrenomedullin, its use in clinical practice is limited. MR‑proADM is a stable prohormone fragment, whose concentrations reflect those of adrenomedullin. Previous reports showed an increased level of MR‑proADM in patients with MI and acute heart failure. Results of the DANAMI‑3 (Danish Study of Optimal Acute Treatment of Patients With STEMI) trial33 showed that MR‑proADM could be a predictor of short and long‑term mortality and readmission for heart failure after MI. In the BACH (Biomarkers in Acute Heart Failure) trial,34 MR‑proADM presented a useful diagnostic value for acute heart failure in patients with dyspnea.
In our study, we found associations between IL‑6 and CRP levels and LV function. In previous reports, increased IL‑6 levels were associated with adverse remodeling and heart failure.35,36 Expression of proinflammatory cytokines such as IL‑6 is enhanced in the myocardium after reperfusion. C‑reactive protein is an acute phase protein of hepatic origin, whose level increases during MI partly as a response to stimulation by IL‑6, which is released from the infarct zone. Elevated CRP concentrations were associated with adverse clinical outcomes after MI, larger infarct size, and microvascular obstruction.37,38 On the other hand, lower CRP levels were observed in patients responding to resynchronization therapy in the setting of chronic heart failure.39
Study limitations
Our study has several limitations. First of all, the sample size was relatively small; therefore, presented results can only be used for hypothesis generation. The ROC analysis showed that the predictive value of MR‑proADM and LDH, the most promising biomarkers from our analysis, is relatively moderate and it should be evaluated in larger studies. Secondly, we excluded patients with previous MI, cardiogenic shock on admission, and with baseline LVEF lower than 25%; thus, the results do not apply to this group of excluded patients. The study population was not completely homogenous. Both STEMI and NSTEMI patients were included, which could lead to a bias in presented results. However, the aim of our study was to assess remodeling in a real‑life situation, not only in highly selected STEMI patients. As the prevalence of NSTEMI is increasing, we think that it is important to include this group of patients in remodeling analyses. What is more, in our analysis, NSTEMI patients were high‑risk individuals who underwent immediate invasive treatment strategy, which makes the management of ischemia in these 2 groups of patients similar. Also, we included patients with culprit lesions located in the main coronary arteries. Therefore, patients with smaller MI, potentially interfering with obtained results, were excluded. We used a single time‑point for biomarker assessment instead of multiple measurements. Finally, we used echocardiography but not cardiac magnetic resonance (CMR) for LV assessment. CMR is considered as a gold standard for LV volume measurements.40 Compared with echocardiography, CMR has reduced operator variability and with late gadolinium enhancement has the ability to distinguish between reversible and irreversible myocardial injury. Despite this, echocardiography is the most widely accessible method, especially in an acute setting, and is recommended in all patients with MI to evaluate the global and regional function of LV.15 LV function assessment by echocardiography is used not only in clinical practice but also in clinical trials, including those analyzing myocardial remodeling. The use of 3‑dimensional acquisition and analysis may improve data quality.
Conclusions
Lactate dehydrogenase and MR‑proADM seem to be promising biomarkers of adverse LV remodeling. On the other hand, higher levels of these biomarkers were associated with lower odds for favorable reverse remodeling in patients with MI. However, further studies on larger groups of patients are necessary to provide more information in this regard.
- Rosamond W, Flegal K, Friday G, et al; American Heart Association Statistics Committee and Stroke Statistics Subcommittee. Heart disease and stroke statistics – 2007 update: a report from the American Heart Association Statistics Committee and Stroke Statistics Subcommittee. Circulation. 2007; 115: e69‑e171. | Crossref
- McManus DD, Gore J, Yarzebski J, et al. Recent trends in the incidence, treatment, and outcomes of patients with STEMI and NSTEMI. Am J Med. 2011; 124: 40‑47. | Crossref
- Jernberg T, Johanson P, Held C, et al. Association between adoption of evidence‑based treatment and survival for patients with ST‑elevation myocardial infarction. JAMA. 2011; 305: 1677‑1684. | Crossref
- Sygitowicz G, Maciejak‑Jastrzębska A, Sitkiewicz D. MicroRNAs in the development of left ventricular remodeling and postmyocardial infarction heart failure. Pol Arch Intern Med. 2020; 130: 59‑65. | Crossref
- Kelly DJ, Gershlick T, Witzenbichler B, et al. Incidence and predictors of heart failure following percutaneous coronary intervention in ST‑segment elevation myocardial infarction: the HORIZONS‑AMI trial. Am Heart J. 2011; 162: 663‑670. | Crossref
SUPPLEMENTARY MATERIAL
ARTICLE INFORMATION