Exploring the relationship between trans fatty acids and body fat distribution
Key words: fat distribution, fat metabolism, inflammation, trans fatty acid


 CC BY-NC-SA 4.0
Exploring the relationship between trans fatty acids and body fat distribution
Introduction: The importance of fat distribution is well established. Nevertheless, the mechanism by which fat is distributed throughout the trunk and limbs remains unclear.
Objectives: The aim of this study was to uncover the relationship between 4 trans fatty acids (TFAs) and body fat distribution in the trunk and limbs.
Patients and methods: The study examined 1467 participants registered in the National Health and Nutrition Examination Survey database between 1999 and 2000. A cross‑sectional analysis was conducted to evaluate the relationship between TFA and body fat distribution over the trunk and limbs.
Results: In the unadjusted model for men, trunk fat percentage was significantly associated with trans 9‑hexadecenoic acid (β = 0.250; 95% CI, 0.187–0.313; P <0.01), trans 11‑octadecenoic acid (β = 0.927; 95% CI, 0.499–1.356; P <0.01), trans 9‑octadecenoic acid (β = 1.028; 95% CI, 0.654–1.402; P <0.01), and trans 9, trans 12‑octadienoic acid (β = 0.078; 95% CI, 0.054–0.103; P <0.01). No significant association was found between limb fat percentage and TFA.
Conclusions: Our study demonstrated that increased TFA concentration was associated with fat deposition predominantly in the trunk rather than in the limbs. Further research is needed to investigate the role of TFA in different body fat distributions.
What's new?
Our research aimed at identifying the relationship between body fat distribution and trans fatty acids (TFAs) in a large sample of racially mixed adult population. The study documented an increased accumulation of TFAs over the trunk in participants 65 years old and older, whereas no association of significance was found over the limbs.
Introduction
Trans fatty acids (TFAs) are unsaturated fatty acids with at least 1 unsaturated nonconjugated double bond in trans configuration.1 The level of TFAs in the human body is solely dependent on the individual’s dietary intake, as humans do not synthesize TFAs.2 TFAs are found naturally in meat and dairy products, but most TFAs in modern diets are derived from industrially produced, partially hydrogenated vegetable oils.3 The ingestion of TFAs exerts detrimental effects on the human body. TFAs are a major risk factor for the development of cognitive disorders such as dementia.4-6 Additionally, the consumption of TFAs is associated with an increased risk of cardiovascular disease, systemic inflammation, endothelial dysfunction, insulin resistance, diabetes, and adiposity.7,8 These findings indicate that the ingestion and distribution of TFAs could have morbid consequences.
Adipose tissue is distributed throughout the body and into regions such as the trunk and limbs.9 Several studies demonstrated that TFA distribution over the abdominal10,11 or liver region increases the risk of cardiovascular disease and cardiometabolic risk.12 In addition, a significant association between body fat distribution and adiposity‑induced cardiovascular events was reported.13 Studies confirm that detrimental health events are largely due to the proinflammatory effect of the adipose tissue.14,15 The inflammatory effect originates from the pathological remodeling triggered by immune cells in obese individuals with chronic excessive energy storage in the adipose tissue.16 Thus, the relationship between the distribution of TFAs and health problems cannot be overlooked.
Fat in the limb is believed to behave differently. A report17 claimed no significant association between inflammation and limb fat, whereas trunk fat is positively associated with the inflammation marker high‑sensitivity C‑reactive protein. Moreover, limb fat is associated with lower blood pressure18 and lower atherogenic risk.19 Taken together, limb fat causes noticeably less damage than trunk fat. To the best of our knowledge, no study has examined the association between limb fat percentage and TFA. Hence, the present study aimed at conducting a cross‑sectional analysis of an adult sample in the United States to investigate the association between body fat distribution and 4 TFAs.
Patients and Methods
Ethics statement
The data in our study were obtained from the National Health and Nutrition Examination Survey (NHANES), a cross‑sectional survey of an adult sample that collects demographic, clinical, behavioral, dietary, social, and laboratory data about the health and nutritional status of noninstitutionalized individuals in the United States. The NHANES has been freely accessible since 1999. All data can be accessed and downloaded from the US Centers for Disease Control and Prevention (CDC) website. The NHANES study protocol was approved by the National Center for Health Statistics (NCHS) Institutional Review Board. All informed consents were obtained from the eligible participants before initiating data collection and conducting NHANES health examinations.20
Study sample
The data for the present study were obtained for the years 1999 and 2000. The dataset consisted of interviews that collected specific demographic variables such as sex, age, race / ethnicity, education, marital status, country of birth, pregnancy status, total family, and household income. Physical examinations were conducted at the Mobile Examination Center (MEC). We included 1852 participants who had household records and were at least 18 years old. After excluding participants with missing data and inadequate interview responses, 1467 eligible individuals (744 men, 723 women) were included in the study, as shown in Table 1. The survey was conducted by the NCHS of the CDC using a stratified, multistage, clustered probability sample design. Further details on the survey could be accessed on the NHANES website.20
Characteristics of study participants | Men (n = 744) | Women (n = 723) | Total (n = 1467) | P value |
Data are presented as mean (standard deviation) or number (percentage).
Abbreviations: ALT, alanine aminotransferase | ||||
Age at screening, y | 50.94 (18.31) | 51.03 (17.87) | 50.98 (18.09) | 0.19 |
Trans 9‑hexadecenoic acid, μmol/l | 7.30 (3.99) | 7.38 (3.26) | 7.34 (3.65) | <0.01 |
Trans 11‑octadecenoic acid, μmol/l | 42.42 (26.43) | 41.44 (21.87) | 41.94 (24.29) | <0.01 |
Trans 9‑octadecenoic acid, μmol/l | 36.31 (23.00) | 38.40 (20.50) | 37.34 (21.82) | 0.01 |
Trans 9, trans 12‑octadienoic acid, μmol/l | 2.88 (1.50) | 3.11 (1.58) | 2.99 (1.54) | 0.34 |
Total body fat, % | 27.47 (6.40) | 39.77 (6.42) | 35.53 (8.88) | 0.82 |
Total trunk fat, % | 15.38 (4.31) | 19.94 (4.41) | 17.63 (4.92) | 0.83 |
Total limb fat, % | 12.09 (2.66) | 19.83 (3.38) | 15.90 (4.92) | <0.01 |
ALT, U/l | 31.72 (32.91) | 23.13 (33.11) | 27.49 (33.28) | <0.01 |
Glucose, mg/dl | 101.33 (31.20) | 99.23 (35.99) | 100.30 (33.65) | 0.11 |
Creatinine, mg/dl | 0.86 (0.47) | 0.63 (0.46) | 0.75 (0.48) | 0.16 |
Race / ethnicity | 209 (28.1) | 199 (27.5) | 408 (27.8) | 0.25 |
Congestive heart failure | 22 (3.0) | 17 (2.4) | 39 (2.7) | 0.59 |
Coronary heart disease | 33 (4.4) | 17 (2.4) | 50 (3.4) | 0.11 |
Angina | 33 (4.4) | 19 (2.6) | 52 (3.5) | <0.01 |
Heart attack | 38 (5.1) | 15 (2.1) | 53 (3.6) | <0.01 |
Stroke | 21 (2.8) | 18 (2.5) | 39 (2.7) | 0.56 |
Emphysema | 15 (2.0) | 14 (1.9) | 29 (2.0) | 0.37 |
Cancer or malignancy | 63 (8.5) | 61 (8.4) | 124 (8.5) | 0.61 |
Smoking | 450 (60.5) | 288 (39.8) | 738 (50.3) | <0.01 |
Peripheral artery disease | 406 (54.6) | 397 (54.9) | 803 (54.7) | 0.89 |
Measurement of body fat percentage
Total body fat and regional body fat, such as trunk fat and limb fat, were measured using dual‑energy X‑ray absorptiometry (DXA). DXA has been widely used in NHANES as an effective tool to estimate the prevalence of obesity and to study the association between body composition and health conditions. The scan was conducted using the Hologic QDR‑4500A fan‑beam densitometer (Hologic, Inc., Bedford, Massachusetts, United States) and Hologic software version 8.26:a3 by trained professionals. The densitometer scanned the participants with an X‑ray of extremely low radiation exposure of less than 10 µSv. DXA acquired 2 low‑dose X‑ray images at different average energy to distinguish bone from soft tissue and soft tissue fat when bone was not present. Thus, DXA is capable of measuring specific regional fat and lean mass.21 Detailed information on DXA examination is included in the NHANES data documentation.22
The participants were asked to remove jewelry or other metallic objects that could interfere with DXA examination. They were placed in a supine position on an exam Table with their feet in a neutral position and hands prone by their sides. Pregnant women were ineligible. Participants who were excluded from the examination for reasons other than age and pregnancy were classified as eligible nonrespondents.
The study categorized neck, chest, abdominal, and pelvic areas as the trunk region, with the upper boundary of the chin and the lower boundary of the inferior brim of the pelvis. For the arms, a line from the glenohumeral joint to the axilla was drawn to separate the arms from the trunk. The legs included everything below the inferior border of the trunk.
Measurement of trans fatty acids
The measurement of TFAs in this study included trans 9‑hexadecenoic acid, trans 11‑octadecenoic acid, trans 9‑octadecenoic acid, and trans‑9, trans 12‑octadienoic acid. Total content of the selected TFAs was measured in the plasma. The results were provided in concentrations measured on empty stomachs. The TFAs were analyzed via chromatographic retention time and specific mass‑to‑charge ratio of ions. The retention times were compared with those of known standards. Quantitation of TFAs was initiated with a standard solution with stable isotope‑labeled fatty acids as internal standards.
Measurement of covariates
Several confounding factors need to be explained to enhance inference on the observational data. A confounder was tied to both the exposure and the outcome, even though the confounder was not in the causal path between the exposure and outcome. Demographic data such as race / ethnicity, sex, and age were acquired from self‑reported data. Smoking was assessed by asking the question, “Have you ever smoked cigarettes?” Participants’ medical history included a diagnosis of congestive heart failure (CHF), coronary heart disease (CHD), angina, heart attack, stroke, emphysema, peripheral artery disease (PAD), and cancer. Laboratory data such as alanine aminotransferase (ALT), serum glucose, and creatinine were analyzed in our study. Participants’ specimens were collected by medical technologists and professional phlebotomists at the MEC. The analyses of serum ALT and creatinine were performed with a Hitachi Model 704 multichannel analyzer (Boehringer Mannheim Diagnostics, Indianapolis, Indiana, United States). Specific details on the measurement could be attained from the NHANES documentation.22
Statistical analysis
All statistical analyses were performed using SPSS software (Version 18.0 for Windows, SPSS, Inc., Chicago, Illinois, United States). The χ2 test and Wilcoxon rank‑sum test were applied to categorical variables and continuous variables, respectively. Continuous data are indicated by their means and SDs. Categorical data were recorded by their frequency counts and percentages. We interpreted the association between TFA and different body fat distributions, including trunk and limbs, using multivariable linear regression models designed with progressive degrees of modification. Covariate adjustments were investigated using the following extended model linear regressions: Model 1 was unadjusted, Model 2 = Model 1 + age, sex, and race / ethnicity, Model 3 = Model 2 + ALT, glucose, and creatinine, Model 4 = Model 3 + medical history of CHF, CHD, angina, heart attack, stroke, emphysema, cancer, current smoking status, and PAD.
Results
Study sample characteristics
The demographic data of 1467 patients were categorized by sex, as listed in Table 1. Women had higher serum trans 9‑hexadecenoic acid and trans-9‑octadecenoic acid concentrations, whereas men showed higher serum trans 11‑octadecenoic acid concentrations. Higher total body fat, trunk fat, and limb fat were observed in women, but only limb fat distribution showed statistical significance.
Association between total body fat percentage and trans fatty acids
The association between total body fat percentage and TFAs can be found in Table 2. Significant positive associations with TFAs were observed in the unadjusted model for men. In the unadjusted model, our results revealed significant associations between total body fat percentage and TFAs. The significance persisted after adjustments in covariates. In the female group, both trans 9‑hexadecenoic acid and trans 9, trans 12‑octadienoic acid demonstrated significant relationships in both the unadjusted model and the fully adjusted model.
Adjusted covariatesa | Trans 9‑hexadecenoic acid | P value | Trans 11‑octadecenoic acid | P value | Trans 9‑octadecenoic acid | P value | Trans 9, trans 12‑octadienoic acid | P value |
a Model 1 = unadjusted; Model 2 = Model 1 + age, sex, race / ethnicity; Model 3 = Model 2 + alanine aminotransferase, glucose, creatinine; Model 4 = Model 3 + congestive heart failure, coronary heart disease, angina, heart attack, stroke, emphysema, cancer or malignancy, smoking, peripheral artery disease
b β was interpreted as change of total fat percentage for every unit increase in trans fatty acids. | ||||||||
Men, βb (95% CI) | ||||||||
Model 1 | 0.146 (0.103–0.189) | <0.01 | 0.504 (0.214–0.794) | <0.01 | 0.549 (0.295–0.802) | <0.01 | 0.042 (0.025–0.058) | <0.01 |
Model 2 | 0.118 (0.071–0.164) | <0.01 | 0.467 (0.155–0.779) | <0.01 | 0.468 (0.196–0.740) | <0.01 | 0.044 (0.026–0.062) | <0.01 |
Model 3 | 0.104 (0.059–0.148) | <0.01 | 0.340 (0.042–0.638) | 0.02 | 0.343 (0.084–0.601) | <0.01 | 0.038 (0.021–0.056) | <0.01 |
Model 4 | 0.106 (0.061–0.151) | <0.01 | 0.355 (0.056–0.655) | 0.02 | 0.361 (0.101–0.621) | <0.01 | 0.040 (0.022–0.058) | <0.01 |
Women, βb (95% CI) | ||||||||
Model 1 | 0.075 (0.038–0.112) | <0.01 | 0.208 (–0.041 to 0.457) | 0.10 | 0.365 (0.128–0.602) | <0.01 | 0.034 (0.016–0.052) | <0.01 |
Model 2 | 0.059 (0.022–0.097) | <0.01 | 0.129 (–0.126 to 0.383) | 0.32 | 0.277 (0.035–0.518) | 0.02 | 0.024 (0.006–0.043) | <0.01 |
Model 3 | 0.052 (0.014–0.089) | <0.01 | 0.089 (–0.166 to 0.343) | 0.49 | 0.226 (–0.016 to 0.468) | 0.06 | 0.022 (0.004–0.041) | 0.01 |
Model 4 | 0.050 (0.012–0.087) | 0.01 | 0.088 (–0.170 to 0.345) | 0.50 | 0.228 (–0.017 to 0.474) | 0.06 | 0.023 (0.005–0.041) | 0.01 |
Association between trunk fat percentage and trans fatty acids
The relationship between trunk fat percentage and TFAs is showed in Table 3. In the unadjusted model for men, trunk fat percentage was significantly associated with trans 9‑hexadecenoic acid, trans 11‑octadecenoic acid, trans 9‑octadecenoic acid, and trans 9, trans 12‑octadienoic acid. This significant association was maintained even after additional covariate adjustments in Model 2, Model 3, and Model 4. The relationships were also clearly visible in the female group for trans 9‑hexadecenoic acid, trans 11‑octadecenoic acid, trans 9‑octadecenoic acid, and trans 9, trans 12‑octadienoic acid.
Adjusted covariatesa | Trans 9‑hexadecenoic acid | P value | Trans 11‑octadecenoic acid | P value | Trans 9‑octadecenoic acid | P value | Trans 9, trans 12‑octadienoic acid | P value |
a Model 1 = unadjusted; Model 2 = Model 1 + age, sex, race / ethnicity; Model 3 = Model 2 + alanine aminotransferase, glucose, creatinine; Model 4 = Model 3 + congestive heart failure, coronary heart disease, angina, heart attack, stroke, emphysema, cancer or malignancy, smoking, peripheral artery disease
b β was interpreted as change of total trunk percentage for every unit increase in trans fatty acids. | ||||||||
Men, βb (95% CI) | ||||||||
Model 1 | 0.250 (0.187–0.313) | <0.01 | 0.927 (0.499–1.356) | <0.01 | 1.028 (0.654–1.402) | <0.01 | 0.078 (0.054–0.103) | <0.01 |
Model 2 | 0.213 (0.143–0.284) | <0.01 | 0.932 (0.452–1.411) | <0.01 | 0.955 (0.536–1.374) | <0.01 | 0.088 (0.061–0.116) | <0.01 |
Model 3 | 0.181 (0.112–0.250) | <0.01 | 0.640 (0.177–1.103) | <0.01 | 0.667 (0.265–1.069) | 0.01 | 0.076 (0.049–0.103) | <0.01 |
Model 4 | 0.184 (0.115–0.253) | <0.01 | 0.663 (0.199–1.127) | <0.01 | 0.694 (0.291–1.097) | 0.01 | 0.078 (0.051–0.105) | <0.01 |
Women, βb (95% CI) | ||||||||
Model 1 | 0.146 (0.093–0.199) | <0.01 | 0.590 (0.229–0.952) | <0.01 | 0.868 (0.526–1.209) | <0.01 | 0.084 (0.058–0.109) | <0.01 |
Model 2 | 0.119 (0.062–0.177) | <0.01 | 0.441 (0.049–0.833) | 0.02 | 0.722 (0.353–1.090) | <0.01 | 0.069 (0.041–0.097) | <0.01 |
Model 3 | 0.096 (0.037–0.154) | 0.01 | 0.311 (–0.087 to 0.709) | 0.12 | 0.601 (0.225–0.977) | <0.01 | 0.064 (0.036–0.092) | <0.01 |
Model 4 | 0.095 (0.037–0.154) | 0.01 | 0.309 (–0.093 to 0.712) | 0.13 | 0.606 (0.225–0.986) | <0.01 | 0.064 (0.036–0.093) | <0.01 |
Association between limb fat percentage and trans fatty acids
The association between limb fat percentage and TFAs is shown in Table 4. In the results for both men and women, only trans 9‑hexadecenoic acid in the male group displayed statistical significance in the fully adjusted model. The remaining TFAs observed in the male group and all TFAs in the female group manifested insignificant associations in all the models.
Adjusted covariatesa | Trans 9‑hexadecenoic acid | P value | Trans 11‑octadecenoic acid | P value | Trans 9‑octadecenoic acid | P value | Trans 9, trans 12‑octadienoic acid | P value |
a Model 1 = unadjusted; Model 2 = Model 1 + age, sex, race / ethnicity; Model 3 = Model 2 + alanine aminotransferase, glucose, creatinine; Model 4 = Model 3 + congestive heart failure, coronary heart disease, angina, heart attack, stroke, emphysema, cancer or malignancy, smoking, peripheral artery disease
b β was interpreted as change of limb fat percentage for every unit increase in trans fatty acids. | ||||||||
Men, βb (95% CI) | ||||||||
Model 1 | 0.189 (0.083–0.295) | <0.01 | 0.483 (–0.221 to 1.186) | 0.17 | 0.480 (–0.137 to 1.097) | 0.12 | 0.035 (–0.006 to 0.076) | 0.09 |
Model 2 | 0.147 (0.041–0.254) | <0.01 | 0.399 (–0.319 to 1.117) | 0.27 | 0.365 (–0.262 to 0.992) | 0.25 | 0.037 (–0.005 to 0.078) | 0.08 |
Model 3 | 0.151 (0.049–0.253) | <0.01 | 0.395 (–0.285 to 1.075) | 0.25 | 0.355 (–0.233 to 0.944) | 0.23 | 0.037 (–0.003 to 0.078) | 0.06 |
Model 4 | 0.156 (0.052–0.259) | <0.01 | 0.420 (–0.267 to 1.106) | 0.23 | 0.385 (–0.210 to 0.981) | 0.20 | 0.041 (0.000–0.081) | 0.05 |
Women, βb (95% CI) | ||||||||
Model 1 | 0.022 (–0.049 to 0.092) | 0.54 | –0.248 (–0.722 to 0.225) | 0.3 | –0.160 (–0.614 to 0.294) | 0.49 | –0.020 (–0.054 to 0.014) | 0.25 |
Model 2 | 0.033 (–0.038 to 0.103) | 0.36 | –0.194 (–0.669 to 0.281) | 0.42 | –0.099 (–0.552 to 0.354) | 0.66 | –0.015 (–0.049 to 0.019) | 0.38 |
Model 3 | 0.044 (–0.025 to 0.114) | 0.21 | –0.131 (–0.604 to 0.342) | 0.58 | –0.071 (–0.522 to 0.380) | 0.75 | –0.012 (–0.046 to 0.021) | 0.47 |
Model 4 | 0.037 (–0.034 to 0.107) | 0.30 | –0.135 (–0.615 to 0.346) | 0.58 | –0.076 (–0.536 to 0.383) | 0.74 | –0.012 (–0.046 to 0.023) | 0.51 |
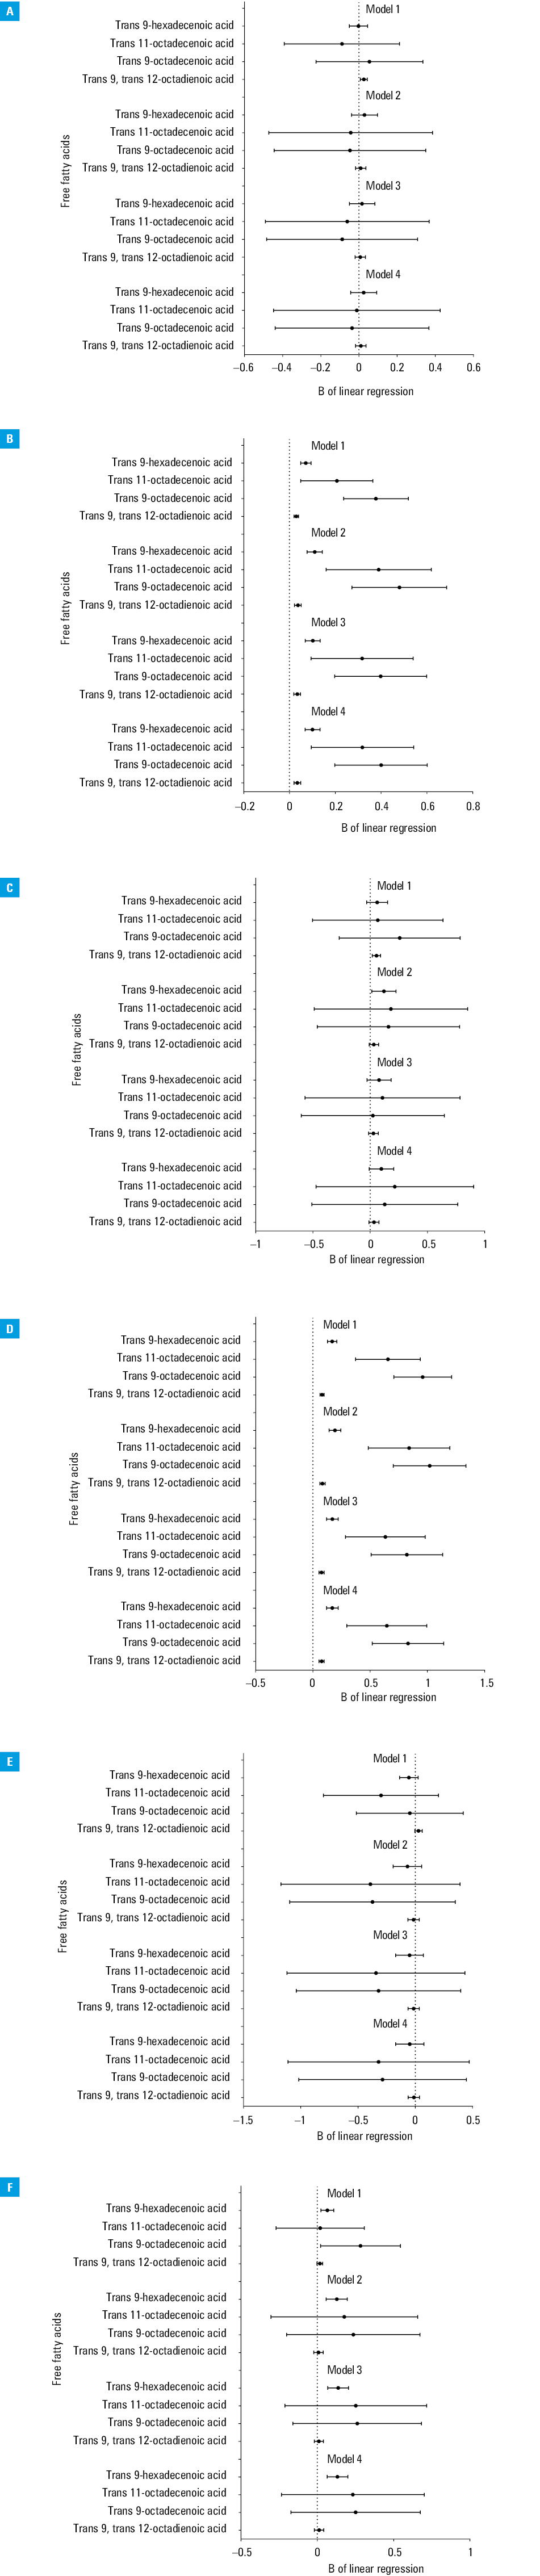
Age‑based association between body fat percentage and trans fatty acids
The age‑based association between different fat distributions and TFAs is demonstrated in Figure 1. Significant positive associations between trunk fat percentage and TFAs in participants 65 years old and older (P <0.01) are shown in Figure 1D. Figure 1C shows no significant associations between trunk fat percentage and TFAs for participants under 65 years. A comparison of the 2 plots suggested that TFA was significantly associated with trunk fat percentage in participants aged 65 and older.
Discussion
A significant association was discovered between total body fat percentage and TFAs in the sample of the adult population from the United States. In our study, trunk fat percentage represented a significant positive association with TFAs regardless of sex, while the relationship between limb fat percentage and TFAs showed no significance.
The present study discovered a significant association between trunk fat percentage and TFAs. Many studies have already discussed adverse health effects of such a relationship. For example, several reports suggested that trunk obesity might be conducive to colonic diverticulosis.23,24 Another study illustrated a significant association between plasma TFAs and nonalcoholic fatty liver disease.25 A cohort study by Zhu et al26 pointed out that saturated fatty acids, monosaturated fatty acids, and polyunsaturated fatty acids did not correlate with a risk of cardiovascular disease. In contrast, TFA intake was associated with a greater risk of cardiovascular disease in a dose‑dependent manner.26,27
As shown in Figure 1D, our results revealed a positive association between trunk fat percentage and TFAs for individuals aged 65 and older. A higher total fatty acid concentration was associated with increased frailty and mortality in both middle‑aged and older adults.28,29 Previous studies indicated that an increase in fat mass or body mass index could exponentially escalate the risk of impaired physical performance in older adults.30,31 Along with alcohol consumption, elderly individuals could experience a linear increase in circulating fatty acids in their systems.32 A recent study by Kwaśniewska et al33 described a very low prevalence of healthy lifestyle in the adult population and argued the necessity to promote nutritional health and weight management. Taken together, TFAs may pose a severe risk of morbidity in older individuals.
While previous studies supported the association between trunk fat percentage and TFAs, little is known about fat distribution in the limbs.12 A few studies have already confirmed the association between TFAs and inflammatory markers.34,35 Research data have emphasized the “obesity paradox,” in which overweight individuals could experience a lower mortality rate than normal weight people, as a higher leg fat to total fat ratio might have beneficial effects on cardiovascular risk.36,37 Particularly in overweight women, thigh fat might beneficially alter the lipoprotein concentration, as it has a significant inverse relationship with the lipoprotein.38 Another study claimed that the distribution of fat other than TFA was important in elderly women due to an insignificant association between limb fat and atherosclerosis.39 Moreover, a decrease in limb fat was associated with aging, which could result from a decline in adipogenesis.40 Overall, these studies suggested the potentially beneficial quality of limb fat. In our study, an insignificant association between limb fat percentage and TFAs was discovered. Although there are other studies consistent with our findings, more research is required to confirm our claim.
Our study has several advantages. Different racial / ethnical groups were shown to have varying body composition proportions.41 We analyzed a large and racially diverse sample of the adult population and took into account the racial and ethnical differences. Moreover, the current study analyzed the plasma TFA instead of dietary intake of TFA, as it seems that ingested fats are not related to plasma fatty acids.42 A study by Zhang et al43 found that plasma TFA was significantly associated with metabolic syndromes in which the associated risk factors include obesity. In our study, direct inference on the association between plasma TFA and body fat distribution was performed.
The study also has some notable limitations. First, it had a cross‑sectional design that prevented drawing causal relationships between total body fat percentage and TFAs. A long‑term observation period should be considered in future studies. Second, we only investigated the measurements of TFAs. In obese individuals, adipose tissue can secrete many more proinflammatory cytokines, such as leptin, interferon gamma, tumor necrosis factor alpha, interleukin (IL)-17, IL‑6, IL‑22, and senescence‑associated secretory phenotype.44-46 The effects of other proinflammatory products cannot be neglected. Another limitation was the ambiguous interpretation of the trunk, which could very much represent visceral or subcutaneous fat, waist circumference, hips, or a combination of the regions. Finally, the information regarding the patients’ medical history was based solely on self‑reported responses to questionnaires, which could create the effect of recall bias.
Conclusion
Our study concluded that trunk fat accumulation was associated with increased TFA concentration, while no significant association was observed for limb fat. As the mechanism by which trunk fat induces comorbidities remains unclear, prospective studies are encouraged to investigate the potential effects of TFAs in different body fat distributions.
Article information
Contribution statement CCK and WLC contributed to the design of the study, were responsible for the management and retrieval of data, contributed to initial data analysis and interpretation, and drafted the initial manuscript. CCK, ZYY, and WLC decided upon the data collection methods. CCK, ZYY, and WLC were also responsible for the data analysis decisions. WLC conceptualized and designed the study, supervised all aspects of the study, critically reviewed and revised the manuscript, and approved the final manuscript as submitted. All authors read and approved the final manuscript.
Conflict of interest None declared
Open access This is an Open Access article distributed under the terms of the Creative Commons Attribution‑NonCommercial‑ShareAlike 4.0 International License (CC BY‑NC‑SA 4.0), allowing third parties to copy and redistribute the material in any medium or format and to remix, transform, and build upon the material, provided the original work is properly cited, distributed under the same license, and used for noncommercial purposes only. For commercial use, please contact the journal office at pamw@mp.pl.
How to cite Kao C‑C, Yang Z‑Y, Chen W‑L. Exploring the relationship between trans fatty acids and body fat distribution. Pol Arch Intern Med. 2022; 132: 16174. doi:10.20452/pamw.16174
- Mazidi M, Vatanparast H. Serum trans‑fatty acids level are positively associated with lower food security among American adults. Nutr Diabetes. 2018; 8: 17. | Crossref
- Mazidi M, Gao HK, Shivappa N, et al. The relationship of plasma trans fatty acids with dietary inflammatory index among US adults. Lipids Health Dis. 2017; 16: 147. | Crossref
- Otite FO, Jacobson MF, Dahmubed A, et al. Trends in trans fatty acids reformulations of US supermarket and brand‑name foods from 2007 through 2011. Prev Chronic Dis. 2013; 10: E85. | Crossref
- Laitinen MH, Ngandu T, Rovio S, et al. Fat intake at midlife and risk of dementia and Alzheimer’s disease: a population‑based study. Dement Geriatr Cogn Disord. 2006; 22: 99‑107. | Crossref
- Morris MC, Evans DA, Bienias JL, et al. Dietary fats and the risk of incident Alzheimer disease. Arch Neurol. 2003; 60: 194‑200. | Crossref