Continuous positive airway pressure treatment reduces ventricular arrhythmias in obstructive sleep apnea patients with nocturnal dominance of arrhythmias and severe desaturations
Key words: continuous positive airway pressure, nocturnal arrhythmias, obstructive sleep apnea, premature ventricular contractions, ventricular arrhythmia


 CC BY-NC-SA 4.0
Continuous positive airway pressure treatment reduces ventricular arrhythmias in obstructive sleep apnea patients with nocturnal dominance of arrhythmias and severe desaturations
Introduction: Continuous positive airway pressure (CPAP) treatment is considered effective in reducing ventricular arrhythmias (VAs) in patients with obstructive sleep apnea (OSA).
Objectives: We aimed to assess the influence of this treatment and to identify determinants of antiarrhythmic response.
Patients and methods: We included patients with OSA and VAs (corresponding to grades 2–5 in the Lown classification), who underwent CPAP treatment and controls, who refused CPAP therapy. Holter electrocardiographic monitoring was performed at baseline and after 3 months of follow‑up.
Results: The study consisted of 46 patients in the CPAP group and 30 controls. We observed a significant reduction in premature ventricular contractions (PVCs) and nonsustained ventricular tachycardia events (P = 0.007 and P = 0.03, respectively) in the CPAP group after 3 months, and no difference in controls. The effect of PVC reduction was significant in the patients with nocturnal dominance of PVCs (P = 0.002) and with desaturations equal to or below 80% (P = 0.001). PVC reduction rate (PVC at follow‑up / PVC at baseline) correlated inversely with night / day PVC ratio at baseline (R = –0.36; P = 0.02) and the lowest saturation (R = 0.32; P = 0.03) in the CPAP group. After adjustment for clinical data, night / day PVC ratio was an independent predictor of PVC reduction rate (unstandardized coefficient B = –0.19; 95% CI, –0.37 to –0.01; P <0.05). Its value equal to or greater than 1.16 predicted good antiarrhythmic treatment response with sensitivity and specificity of 83% and 70%, respectively.
Conclusions: CPAP treatment decreases VAs in OSA patients, especially those with severe desaturations and nocturnal domination of PVCs. Night / day PVC ratio might be a useful clinical parameter predicting reduction of PVCs in these patients.
What's new?
Increasing number of patients with obstructive sleep apnea (OSA) requires better understanding of this condition and its connection with other diseases. The question remains whether OSA‑targeted therapy affects other conditions. We aimed to evaluate if continuous positive airway pressure (CPAP) treatment in OSA patients with coexisting ventricular arrhythmias (VAs) shows antiarrhythmic effect, and if there are any factors influencing the magnitude of VA mitigation. We found that CPAP treatment reduced the number of premature ventricular contractions (PVCs) and the number of nonsustained ventricular tachycardia events. Severity of desaturations at night and nocturnal dominance of PVCs correlated with greater reduction of PVCs after 3 months of CPAP therapy. Night / day PVC ratio equal to or above 1.16 predicted a 25% or greater reduction in the number of PVCs. Our study indicated the patients with VAs and OSA who may benefit most from CPAP antiarrhythmic therapy.
Introduction
The prevalence of sleep disordered breathing (SDB) is common in the general population. According to recent studies, the prevalence of mild SDB is estimated at 84% among men and 61% among women, while moderate to severe degree of SDB may be observed in 50% men and 24% women in the general population of adults.1 The most common form of SDB is obstructive sleep apnea (OSA), which involves a complete or partial airflow blockage in the presence of breathing effort.2-4 According to recent studies, OSA affects about 12% of adults, while in the patients with heart failure (HF) the prevalence may reach 29%–40% and is associated with poor prognosis.5,6 Most frequently used diagnostic methods are polysomnography (PSG) and Home Sleep Apnea Test (HSAT), and the diagnosis of OSA is based on apnea‑hypopnea index (AHI), that is, the number of apneas and hypopneas per hour of sleep.7 Ventricular arrhythmias (VAs) are much more frequent in OSA patients (up to two‑thirds), than in the general population (up to 12%).8-10 Also, a higher recurrence rate of VAs after a successful catheter ablation was observed among the patients with OSA than in individuals without this disorder.11 In OSA patients, repeated episodes of airflow blockage during sleep lead to apneas or hypopneas that result in intermittent hypoxia and hypercapnia. These alterations are associated with oxidative stress, negative intrathoracic pressure, sympathetic nervous system activation, specific heart rate changes and impaired heart rate variability (HRV), which are described as important mechanisms leading to increased risk of arrhythmias in OSA patients.12-17
There is little information on the effect of continuous positive airway pressure (CPAP) treatment on reducing VAs, and those studies have different limitations, for example, related to selected groups of patients (eg, patients with HF), considering VAs together with other cardiac arrhythmias, different exclusion criteria (eg, patients with serious cardiopulmonary diseases included into studies), only nocturnal Holter electrocardiogram (ECG) performed, different CPAP usage requirements or no control group.18-22
Therefore, our study aimed to assess the impact of CPAP treatment on VAs in patients without major comorbidities, and to identify the subgroups of patients that can benefit most from CPAP therapy.
Patients and methods
Patients
We included patients admitted to the Department of Diagnostic Medicine, the John Paul II Hospital in Kraków, between 2014 and 2018, with the presumptive diagnosis of SDB and confirmed OSA during further examinations. From these patients, we selected those with coexisting VAs defined as premature ventricular contractions (PVCs), nonsustained ventricular tachycardias (NSVT), and ventricular tachycardias (VT), who were qualified for CPAP therapy based on the guidelines of the American Academy of Sleep Medicine, which indicate CPAP treatment as a standard treatment in moderate and severe OSA, and an optional approach in mild cases, especially when an improvement in sleepiness or quality of life is taken into consideration or as an additional therapy for hypertension.23
Inclusion and exclusion criteria
We included patients with VAs corresponding to grade 2 or higher in the Lown classification. Detailed inclusion criteria for the CPAP group were: at least 75% of nights with at least 4 hours per night of the CPAP usage, AHI below 5/h after 3 months for patients with baseline AHI below 50/h, and AHI below 10/h for those with baseline AHI at least 50/h. Excluion criteria were: decompensated HF, HF with New York Heart Association class III or higher or left ventricular ejection fraction (LVEF) equal to or below 30%, coronary artery disease (CAD) with Canadian Cardiovascular Society class III or higher, history of myocardial infarction (MI) with LVEF up to 50%, cardiomyopathy, placed cardiovascular implantable electronic device, diagnosed storage disease, active malignant neoplastic disease, severe acute disease during follow‑up (eg, pneumonia or major surgery), Lyme disease, drug and alcohol addiction, consumption of 3 or more coffees per day or 2 or more energy drinks per week, smoking 10 or more cigarettes per day, severe chronic obstructive pulmonary disease (COPD) or other comorbidities that may cause cardiac arrhythmias (eg, hypo- / hyperthyroidism, uncontrolled asthma with frequent exacerbations). We also excluded patients with modifications in cardiological pharmacotherapy 1 month before the baseline and during follow‑up. We enrolled as controls the patients who refused the CPAP therapy despite clinical indications.
The study was approved by the local Ethics Committee (76/KBL/OIL/2016) and informed consent from each patient was obtained.
Pretest assessment
To evaluate a pretest probability of moderate and severe OSA, we used the STOP‑BANG questionnaire, which includes snoring, tiredness, observed apneas, high blood pressure, body mass index (BMI), age, neck circumference, and sex, together with the Epworth Sleepiness Scale and presence or absence of other OSA symptoms.24 Obesity was defined as BMI equal to or above 30 kg/m2.25,26
Sleep exams
All patients underwent full PSG type I device (Alice 6LDx, Philips, Andover, Massachusetts, United States) or portable monitor device type III (Embletta MPR PG, Natus, Middleton, Wisconsin, United States) sleep study, also known as polygraphy (PG), based on the pretest probability of moderate to severe OSA and other clinical indications, following the American Academy of Sleep Medicine guidelines.27 Type I device exam always has to be taken in a laboratory and be supervised, while type III device exams may be performed in outpatient conditions. All our exams, also those with a type III device, were performed at a hospital. In both, PSG and PG (type I and type III device), we measured abdominal and thoracic effort, oronasal airflow, snoring, body position, activity, pulse oxygen saturation (SpO2), and pulse. In PSG (type I device) electroencephalography, chin and leg electromyography, electrooculography, and ECG were additionally performed. Obstructive apnea was defined as a total blockage of airflow for at least 10 seconds in the presence of respiratory effort, while hypopnea was defined as an event of airflow reduction by at least 30% lasting for at least 10 seconds, with an accompanying desaturation 3% or higher or arousal.2,7,28 OSA diagnosis was made when AHI was 5/h or greater with associated symptoms (eg, excessive daytime sleepiness, witnessed apneas, loud snoring, unrefreshing sleep, awakening with a choking sensation) or regardless of the symptoms when AHI was 15/h or greater.23 Additionally, we counted apnea index (AI) and hypopnea index (HI), which indicate the number of apneas or hypopneas occurring per hour of sleep, respectively.
CPAP treatment was prescribed based on clinical criteria and titration was performed. The follow‑up period was set for 3 months.
Holter electrocardiography monitoring
All patients included in the study had a Holter ECG monitoring at baseline and at the end of the follow‑up. The number of PVCs and the presence of NSVT or VT events were noted. Additionally, we divided PVCs into nocturnal cardiac arrhythmias (8.00 pm to 8.00 am) and daytime arrhythmias (8.00 am to 8.00 pm). This was followed by extracting the subgroups of patients with nocturnal PVCs dominance defined as night / day PVC ratio above 1, and patients with severe desaturations (minimal SpO2 ≤80%). We also calculated PVC reduction rate, defined as PVCs after 3 months / PVCs at baseline, and set a cutoff threshold of PVC reduction rate for good antiarrhythmic CPAP treatment response to 0.75 (≥25% reduction in the number of PVCs during 24‑hour Holter ECG monitoring).
Statistical analysis
Continuous variables with normal distribution were expressed as mean (SD), while those with non‑normal distribution as median with interquartile range (IQR). Categorical variables were expressed as absolute numbers and percentages. Data distribution and equality of variances were tested with the Shapiro–Wilk and Levene tests, respectively. The characteristics of the groups were compared using the t test, the Mann–Whitney, the χ2 (with the Yates correction, if needed) or the Fisher exact tests, depending on the type of variable, its distribution, and equality of variances. To evaluate the effect of CPAP treatment, the Wilcoxon signed‑rank and the McNemar tests were performed. Correlations between continuous variables were evaluated by the Pearson correlation or the Spearman rank test. Univariable and multivariable linear regression analyses were performed to assess predictors of PVC reduction rate. Variables were included in the multivariable model if P values were below 0.1 in univariable comparisons and did not show a strong correlation (r or R ≥0.7) with any other independent variable in the model. Another model was created to test the predictive ability of night / day PVC ratio in terms of PVC reduction rate after adjustment for clinical data. We present the results of the linear regression as unstandardized and standardized regression coefficients. The receiver operating characteristic (ROC) curve was drawn and analyzed, and the area under the curve (AUC) was assessed to evaluate the value of night / day PVC ratio as a predictor of good antiarrhythmic CPAP treatment response. A P value below 0.05 was considered significant. The data were analyzed with Statistica (version 13, TIBCO Software Inc., Palo Alto, California, United States).
Results
Patients
The study group included 76 patients with OSA (49 [64.5%] men, mean [SD] age, 60 [8.9] years), 46 of whom used CPAP (study group), and 30 who refused this therapy (control group). The study scheme is presented in Figure 1. The groups did not differ in terms of anthropometric data, comorbidities, or medications used. However, the patients in the CPAP group were younger than those in the control group (Table 1). The groups were also similar in terms of sleep study parameters, including AHI, AI, HI, and mean and lowest SpO2 at baseline. There was also no difference between the groups in terms of VAs (Table 2). Mean BMI for both groups was over 30, with 25 patients (54.3%) in the CPAP group and 18 patients (60%) in the control group being obese. Only 10 patients (21.7%) in the CPAP group and 4 (13.3%) in the control group had BMI below 25.
Parameter | CPAP group (n = 46) | Control group (n = 30) | P value |
Abbreviations: ACEI, angiotensin‑converting enzyme inhibitor; ARB, angiotensin II receptor blocker; BMI, body mass index; CAD, coronary artery disease; CCB, calcium channel blocker; COPD, chronic obstructive pulmonary disease; WHR, waist‑hip ratio; others, see Figure 1 | |||
Age, y, mean (SD) | 58.3 (8.4) | 62.7 (9.2) | 0.04 |
Male sex, n (%) | 31 (67.4) | 18 (60) | 0.51 |
Anthropometric data, mean (SD) | |||
Height, m | 1.69 (0.08) | 1.72 (0.08) | 0.14 |
Weight, kg | 86.2 (15.6) | 91.8 (16.5) | 0.14 |
BMI, kg/m2 | 30.2 (4.4) | 31.1 (5.0) | 0.40 |
Waist, m | 0.89 (0.17) | 0.95 (0.18) | 0.12 |
WHR | 0.98 (0.1) | 0.96 (0.1) | 0.50 |
Cardiovascular disease risk factors and comorbidities, n (%) | |||
Obesity | 25 (54.3) | 18 (60.0) | 0.63 |
Abdominal obesity | 30 (65.2) | 19 (63.3) | 0.88 |
Hypertension | 36 (78.2) | 20 (66.6) | 0.26 |
Heart failure | 9 (19.5) | 2 (6.7) | 0.22 |
CAD | 14 (30.4) | 8 (26.7) | 0.72 |
Previous myocardial infarction | 9 (19.5) | 5 (16.7) | 0.75 |
COPD or asthma | 6 (13.0) | 5 (16.7) | 0.92 |
Diabetes mellitus | 10 (21.7) | 5 (16.7) | 0.59 |
Hyperlipidemia | 23 (50.0) | 20 (66.7) | 0.15 |
Smoking | 19 (41.3) | 14 (46.7) | 0.64 |
Medications, n (%) | |||
β-Blockers | 31 (67.4) | 20 (66.7) | 0.95 |
Acetylsalicylic acid | 16 (34.8) | 8 (26.7) | 0.46 |
Statin | 22 (47.8) | 18 (60.0) | 0.30 |
ACEI | 20 (43.5) | 13 (43.3) | 0.99 |
ARB | 11 (23.9) | 5 (16.7) | 0.45 |
CCB | 18 (39.1) | 7 (23.3) | 0.15 |
Spironolactone | 5 (10.8) | 0 (0.0) | 0.16 |
Amiodarone | 3 (6.5) | 2 (6.7) | 0.65 |
Diuretics | 18 (39.1) | 14 (46.7) | 0.51 |
Parameter | CPAP group (n = 46) | Control group (n = 30) | P value |
Data are shown as median (interquartile range) unless indicated otherwise.
Abbreviations: NSVT, nonsustained ventricular tachycardia; PVCs, premature ventricular contractions; SpO2, pulse oxygen saturation; others, see Figure 1 | |||
Sleep study parameters | |||
Apnea‑hypopnea index, n/hour | 36.2 (27.2–65.0) | 35.2 (26.9–41.2) | 0.34 |
Apnea index, n/hour | 19.5 (12.7–28.6) | 18.6 (15.0–23.5) | 0.80 |
Hypopnea index, n/hour | 16.6 (12.0–23.4) | 15.6 (10.6–17.7) | 0.20 |
Mean SpO2, % | 90.0 (88.0–92.0) | 90.0 (88.0–91.0) | 0.84 |
Lowest SpO2, % | 80.0 (76.0–82.0) | 80.5 (74.0–85.0) | 0.35 |
Severe desaturations (minimal SpO2 ≤80%), n (%) | 26 (56.5) | 15 (50.0) | 0.64 |
Ventricular arrhythmias | |||
PVC number | 1359 (886–2758) | 1349 (933–2322) | 0.97 |
NSVT events, n (%) | 9 (19.5) | 3 (10.0) | 0.42 |
Night / day PVC ratio | 1.14 (0.89–1.22) | 1.13 (0.93–1.22) | 0.72 |
Nocturnal dominance of PVCs, n (%) | 29 (63.0) | 18 (60.0) | 0.79 |
Associations in the whole group of patients
In the whole group of patients, AHI correlated inversely with mean SpO2 (R = –0.53; P <0.001) and lowest SpO2 (R = –0.48; P <0.001). In the univariable regression analysis, both mean SpO2 and lowest SpO2 predicted AHI (standardized coefficient β = –0.59; unstandardized coefficient B = –3.61; 95% CI, –4.75 to –2.48; R2 = 0.35; P <0.001 and β = –0.51; B = –1.55; 95% CI, –2.16 to –0.94; R2 = 0.26; P <0.001, respectively). In the multivariable regression analysis (when both mean SpO2 and lowest SpO2 were included into the model), only mean SpO2 remained a significant predictor of AHI (β = –0.54; B = –3.26; 95% CI, –5.21 to –1.31; R2 = 0.36; P = 0.001) also after additional adjustment for age, sex, weight, BMI, HF, CAD, previous MI, and COPD (β = –0.53; B = –3.25; 95% CI, –5.35 to –1.15; R2 = 0.39; P = 0.003). Mean SpO2 correlated inversely with hematocrit (HCT) level (R = –0.25; P = 0.03).
Antiarrhythmic effects of continuous positive airway pressure therapy
A significant reduction of PVC count (Table 3) and NSVT events (9 [19.5%] vs 3 [3.5%]; P = 0.03) in the CPAP group was observed at the end of the follow‑up, while there was no such difference in the controls. When PVCs were considered in the CPAP group, 21 patients (45.6%) showed PVC count reduced by 10% or more, 10 patients (21.7%) by 20% or more, and 3 patients (6.5%) by 40% or more. VT episodes (3 in total) at baseline were observed in 2 patients in the CPAP group, while there were no such arrhythmias in controls. After CPAP treatment, there was only 1 VT episode observed in the study patients.
Group of patients | All patients (n) | PVCs at baseline | PVCs after follow‑up | P value |
Data are shown as median (interquartile range) or number.
Abbreviations: see Figure 1 and Table 2 | ||||
CPAP group | 46 | 1359 (886–2758) | 1304 (799–2647) | 0.007 |
Control group | 30 | 1349 (933–2322) | 1319 (903–2422) | 0.53 |
Group of patients | Nocturnal dominance of PVCs (n) | PVCs at baseline | PVCs after follow‑up | P value |
CPAP group | Yes (29) | 1433 (886–4355) | 1222 (799–3703) | 0.002 |
No (17) | 1342 (887–1844) | 1376 (1132–2011) | 0.23 | |
Without outliers | No (15) | 1342 (760–2243) | 1332 (788–2011) | 0.02 |
Control group | Yes (18) | 1394 (933–2322) | 1316 (883–2422) | 0.71 |
No (12) | 1332 (936–2272) | 1232 (907–2394) | 0.39 | |
Group of patients | Desaturations ≤80% (n) | PVCs at baseline | PVCs after follow‑up | P value |
CPAP group | Yes (26) | 1477 (780–3680) | 1277 (785–3100) | 0.001 |
No (20) | 1342 (886–2647) | 1177 (867–2588) | 0.39 | |
Control group | Yes (15) | 1299 (907–1433) | 1210 (811–1325) | 0.08 |
No (15) | 1522 (1080–2327) | 1404 (1096–2444) | 0.91 | |
Patients with nocturnal dominance of premature ventricular contractions
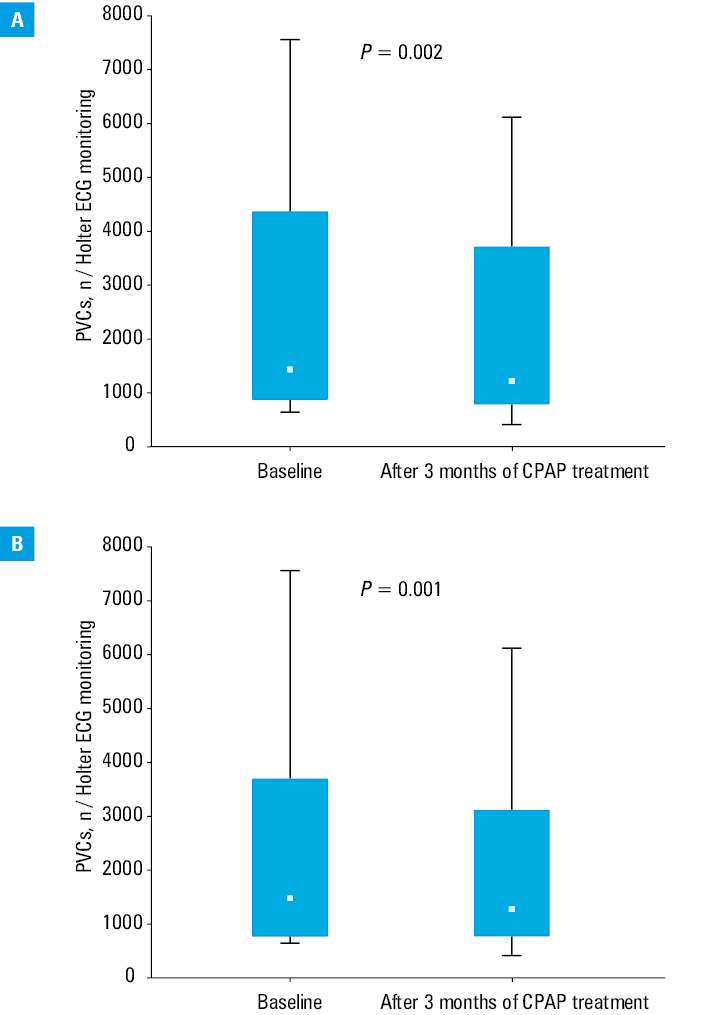
When the CPAP group was divided into nocturnal dominance (29 patients) and no nocturnal dominance (17 patients) of PVCs, only in the first group the reduction in the number of PVCs was significant (P = 0.002 and P = 0.23, respectively) (Table 3, Figure 2A). After analyzing the subgroup with no nocturnal dominance, we found 2 outliers (substantial increase in PVC count from 933/day to 1878/day and from 887/day to 2232/day). We considered them as a natural variation and due to the small size of the subgroup we suspected they could have influenced the result. In an additional analysis after excluding the outliers, the reduction in PVCs became significant also in this subgroup (Table 3). We did not observe any outliers in the other subgroup.
Abbreviations: see Figure 1
Patients with severe desaturations
A significant difference in PVC reduction rate in the CPAP group was noticed between the subgroups of patients with severe desaturations (≤80%) and those whose baseline minimal SpO2 was above 80% (0.876 vs. 0.979; P = 0.03). What is more, the reduction in PVC count was significant only among the patients treated with CPAP with severe desaturations at baseline (P = 0.001 vs P = 0.39) (Table 3, Figure 2B).
Correlations of premature ventricular contraction reduction rate with other parameters
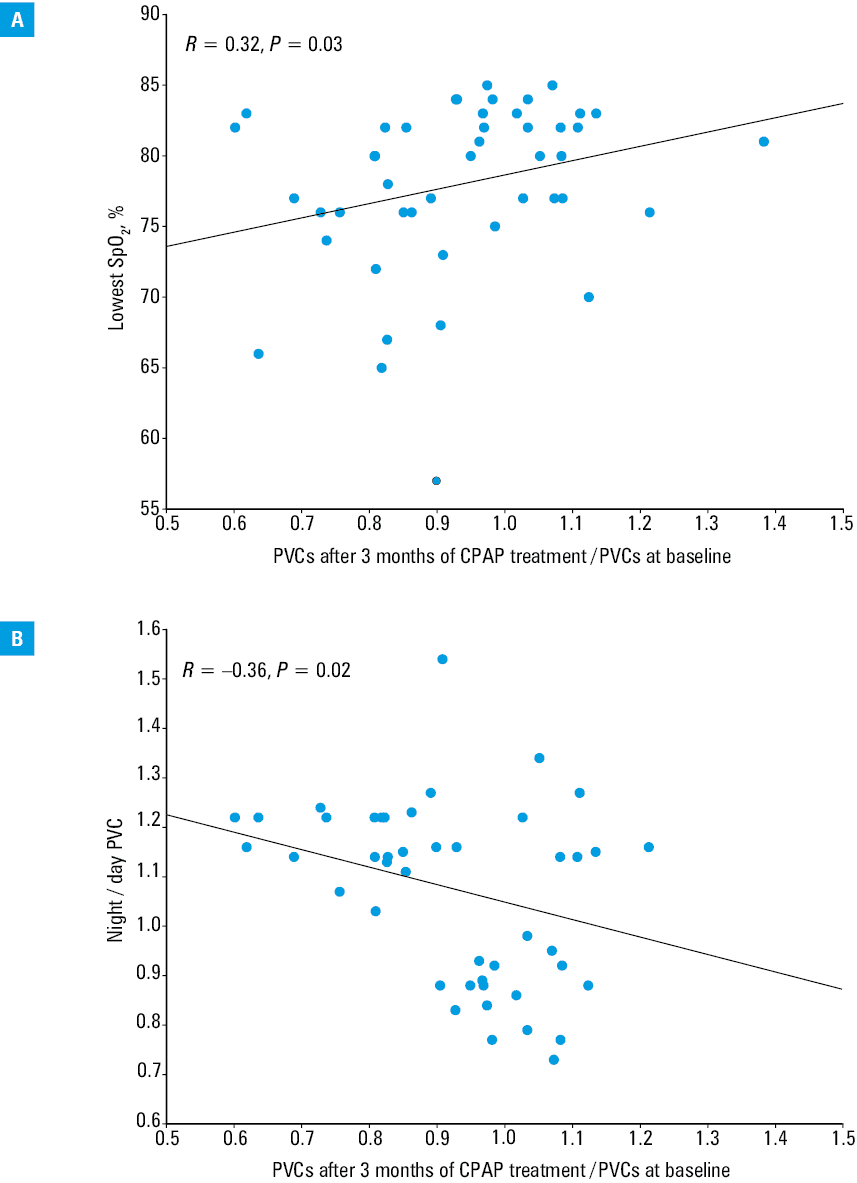
In the CPAP group, PVC reduction rate correlated with the lowest SpO2 (R = 0.32; P = 0.03) and correlated inversely with night / day PVC ratio at baseline (R = –0.36; P = 0.02) (Figure 3). There was a trend toward a correlation between PVC reduction rate and mean SpO2 (R = 0.26; P = 0.08), and inverse correlation between PVC reduction rate and HCT (R = –0.25; P = 0.09). We did not observe any correlation between PVC reduction rate and AHI (R = –0.21; P = 0.16), weight (R = –0.001; P = 0.99), BMI (R = 0.12; P = 0.42), age (r = 0.05; P = 0.72), height (r = –0.19; P = 0.21), waist circumference (R = 0.10; P = 0.51), waist‑hip ratio (r = 0.02; P = 0.88), and other blood parameters (data not shown).
Abbreviations: see Figure 1 and Table 2
Prediction of premature ventricular contraction reduction rate and good antiarrhythmic continuous positive airway pressure response
In linear regression analysis, only night / day PVC ratio (β = –0.34; B = –0.29; 95% CI, –0.55 to –0.03; R2 = 0.13; P = 0.03), but not the lowest SpO2 (β = 0.30; B = 0.007; 95% CI, –0.001 to 0.015; R2 = 0.09; P = 0.08) predicted PVC reduction rate. In the multiple regression analysis incorporating all parameters together and additionally adjusted for mean SpO2 and HCT, night / day PVC ratio was an independent predictor of PVC reduction rate (β = –0.26; B = –0.23; 95% CI, –0.45 to –0.01; R2 = 0.37; P = 0.047). Moreover, this relationship remained significant after adjustment for age, sex, BMI, hypertension, HF, CAD, and previous MI (β = –0.22; B = –0.19; 95% CI, –0.37 to –0.01; R2 = 0.28; P = 0.049) (Table 4).
a Model adjusted for mean SpO2, lowest SpO2, and hematocrit level
b Model additionally adjusted for age, sex, body mass index, hypertension, heart failure, coronary artery disease, and previous myocardial infarction
Abbreviations: see Table 2 | |||
PVC reduction rate (R2 =0.37, P = 0.002)a | Standardized coefficient β | Unstandardized coefficient B (95% CI) | P value |
Night / day PVC ratio | –0.26 | –0.23 (–0.45 to –0.01) | 0.047 |
PVC reduction rate (R2 = 0.26, P = 0.043)b | Standardized coefficient β | Unstandardized coefficient B (95% CI) | P value |
Night / day PVC ratio | –0.22 | –0.19 (–0.37 to –0.01) | 0.049 |
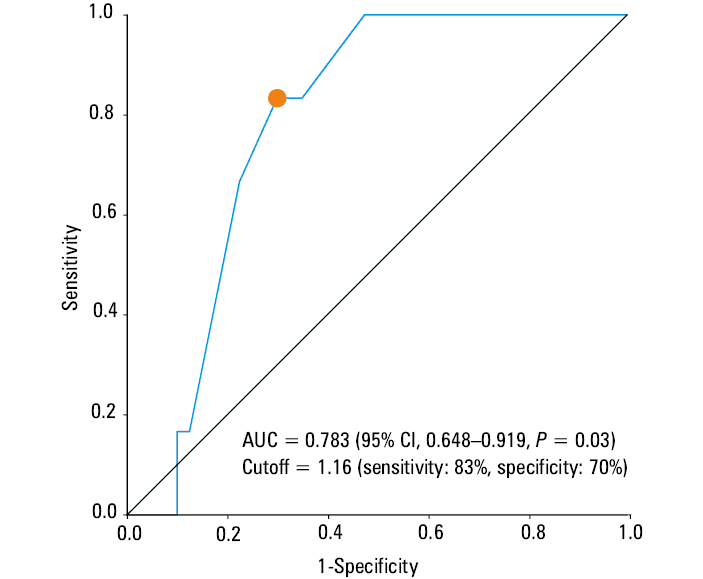
Based on the ROC curve analysis, the cutoff point of night / day PVC ratio for good antiarrhythmic CPAP treatment response was set at 1.16, with sensitivity and specificity of 83% and 70%, respectively. The calculated AUC was 0.783 (95% CI, 0.648–0.919; P = 0.03) (Figure 4).
Abbreviations: AUC, area under the curve
Discussion
Our study shows that appropriate CPAP treatment lowers the count of PVCs and reduces NSVT events. We found that higher reduction in PVC count with CPAP treatment is associated with more significant desaturations at baseline PSG/PG and with nocturnal dominance of PVCs, highlighting these groups of patients as those who may benefit most from the CPAP antiarrhythmic therapy.
Antiarrhythmic effects of continuous positive airway pressure therapy
Studies show that appropriate CPAP treatment leads to reduction of apnea and hypopnea, increases intrathoracic pressure, the lowest and mean SpO2, improves autonomic system activity, HRV, and decreases biomarkers of oxidative stress.20,21,29,30 These might be, at least in part, pathophysiological foundations of the associations observed in our study.
Our results on the reduction of PVCs after CPAP treatment are consistent with previous studies, which showed a positive impact of CPAP on VAs.20,21 In these studies, the follow‑up period was set for 3 months and no changes in pharmacotherapy were made (as in our study) but patients with any number of PVCs were enrolled (in our study only those with grades ≥2 in the Lown classification). The study by Wang et al20 was a controlled trial with 32 patients in the CPAP group (only the presence or absence of PVCs was noted) among whom 14 had PVCs at baseline, while 3 at the end of the follow‑up (P <0.05). There is no information about Holter ECG duration but the authors mentioned that it was performed simultaneously with PSG.20 In a second study (n = 93), by Varga et al,21 where after CPAP treatment PVC count was reduced by about half and NSVT events by about 10 times, the only listed exclusion criteria were severe cardiopulmonary disease and the presence of a cardiac pacemaker. No control group was enrolled. The median AHI at the end of the follow‑up was 12/h (IQR, 7.5–22), while we included only the patients with AHI equal to or lower than 5/h or equal to or lower than 10/h (depending on baseline AHI). Additionally, 6 or more hours / day of CPAP usage were required and Holter ECG lasted for only 7 hours (during the night).21
Although the general effect of CPAP on reducing PVCs is similar to our findings, these main discrepancies in methodology may be the reasons for differences in the magnitude of PVC reduction.
Patients with nocturnal dominance of premature ventricular contractions and severe desaturations
Our study indicates that patients with nocturnal dominance of PVCs benefit more from CPAP therapy than other patients, and night / day PVC ratio predicts the treatment response. Better treatment results correlated with greater domination of nocturnal PVCs and more severe desaturations. In fact, especially in the subgroups of patients with nocturnal dominance of PVCs and severe desaturations, the effect of CPAP treatment was significant. The frequency of VAs is significantly higher among OSA patients than in the healthy individuals,8 and in these patients sudden cardiac death (SCD) is more likely to occur during sleep.31 On the other hand, in patients without OSA and in the general population, SCD during sleep hours is much rarer.31 In addition, OSA is an independent risk factor for SCD, while VAs are known to be the main mechanism of SCD, and severe hypoxemia is a known risk factor for VAs.31,32 Association between hypoxia and prevalence of VAs and their severity was noticed in previous studies.33-35 In a paper by Gami et al,31 with over 10 000 participants, who underwent PSG at the Mayo Clinic Sleep Disorders Center, with a follow‑up lasting up to 15 years (average 5.3 years), multivariable regression analysis showed that the severity of desaturations (lowest SpO2) during PSG was an independent risk factor for SCD, and for the threshold of 78% (lowest SpO2) the hazard ratio for SCD was 1.81 (95% CI, 1.28–2.56; P = 0.0008). In our study, PVC reduction rate was significantly higher in the patients with the lowest SpO2 (≤80%) than in those with baseline lowest SpO2 above 80%, and only in the first group the reduction of PVCs was significant. All these data together show that appropriate CPAP treatment, by eliminating apneas and through eradicating severe desaturations, may lower the risk of VAs and SCD.
Clinical implications
Obesity is a known risk factor for OSA and studies show that 60%–90% of patients suffering from OSA are overweight.36 A majority of our patients were obese and we have been witnessing an obesity epidemic and gradually increasing BMI levels for decades.25,37 If this trend continues, we will notice a significant increase in the number of patients with OSA. This is why a better understanding of its relationship with other medical conditions, including VAs, is required.
Clinicians, especially cardiologists and internal medicine specialists, should consider performing OSA diagnostics in patients with VAs without underlying conditions, especially in those with nocturnal dominance of VAs and clinical features related to SDB. Based on our observations and the multiple regression analysis, a night / day PVC ratio of 1.16 or higher predicts good antiarrhythmic CPAP response in OSA patients. Additionally, in our study mean SpO2 correlated with and predicted AHI, which supports the use of overnight pulse oximetry as a screening tool for SDB if other tests are not available.
Limitations of the study
Due to the fact that patients, based on clinical indications, underwent PSG or PG, we did not extract the groups with mild, moderate, and severe OSA (there may have been differences in the AHI score). Secondly, our cohort was relatively low in the number of participants, therefore our observations, especially on VT episodes reduction require further studies in larger groups of patients. Despite a relatively low number of patients, we managed to show positive antiarrhythmic CPAP treatment response and determine the factors related to it.
Conclusions
CPAP treatment of OSA patients with VAs reduces the count of PVCs and NSVT events. The patients with severe desaturations (≤80%) and those with nocturnal domination of the VAs may benefit most from this therapy. Night / day PVC ratio was found to be a useful, independent predictor of antiarrhythmic CPAP treatment response.
- Heinzer R, Vat S, Marques‑Vidal P, et al. Prevalence of sleep‑disordered breathing in the general population: the HypnoLaus study. Lancet Respir Med. 2015; 3: 310‑318. | Crossref
- Abbasi A, Gupta SS, Sabharwal N, et al. A comprehensive review of obstructive sleep apnea. Sleep Sci. 2021; 14: 142‑154.
- Lin J, Suurna M. Sleep apnea and sleep‑disordered breathing. Otolaryngol Clin North Am. 2018; 51: 827‑833. | Crossref
- Foldvary‑Schaefer NR, Waters TE. Sleep‑disordered breathing. Continuum (Minneap Minn). 2017; 23: 1093‑1116. | Crossref
- Watson NF. Health care savings: the economic value of diagnostic and therapeutic care for obstructive sleep apnea. J Clin Sleep Med. 2016; 12: 1075‑1077. | Crossref
ARTICLE INFORMATION