Not the enemy: potential protective benefits of superficial subcutaneous adipose tissue
Key words: cardiovascular, mortality, skinfold thickness, subcutaneous adipose tissue


 CC BY-NC-SA 4.0
Not the enemy: potential protective benefits of superficial subcutaneous adipose tissue
Introduction: Subcutaneous adipose tissue (SAT) has been suggested to be a protective fat depot. Measurement of skinfold thickness (ST) is a simple means of superficial SAT (SSAT) assessment, but its correlation with mortality risk is controversial.
Objectives: We aimed to investigate the association between ST measured at 4 commonly assessed sites and the risk for all‑cause, cardiovascular (CV), and cancer mortality.
Patients and methods: A total of 10 261 eligible individuals aged 20 to 90 years who participated in the National Health and Nutrition Examination Survey III were included. Hazard ratios (HRs) for all‑cause, CV, and cancer mortality were examined for 4 sites of ST measurement: the triceps, subscapular and suprailiac regions, and the thigh. Receiver operating characteristic analysis was performed to determine the predictive ability of ST for mortality risk.
Results: All 4 STs were associated with a lower risk for mortality, with an HR below 1. Among the 4 sites, suprailiac ST had the greatest protective benefit in terms of all‑cause mortality (HR, 0.972; P <0.001) and CV mortality (HR, 0.562; P <0.001), and was the best predictive factor for all‑cause mortality (area under the curve = 0.576; P <0.001). In subgroup analyses, men and elderly patients (≥65 years old) manifested protective effects of SAT at more sites and with respect to more causes of mortality.
Conclusions: The inverse association between ST and mortality risk implies possible benefits of SSAT in terms of mortality risk reduction. This effect was especially notable for ST measured at the suprailiac region.
What's new?
An increase in skinfold thickness (ST) is associated with lower risk for all‑cause, cardiovascular, and cancer mortality. This effect is most notable for ST measured at the suprailiac region. As ST represents the layer of superficial subcutaneous adipose tissue (SSAT), the inverse association between ST and mortality risk implies the protective effect of SSAT.
Introduction
The detrimental impact of obesity on the risk for cardiovascular (CV) events and insulin resistance has been widely discussed.1,2 The most common definition of obesity involves the body mass index (BMI), which is calculated using a simple formula that only requires information on height and weight of a person. However, the accuracy of BMI has been questioned, as it does not distinguish between muscularity and fatness or reflect real body composition, for instance, bone density and body fat distribution. Various anthropometric indices have been proposed to enhance the estimation of body composition and fat distribution. Among them, measurements of visceral adipose tissue (VAT) and subcutaneous adipose tissue (SAT) are widely discussed.3-5 As several lines of evidence related to central obesity (a high percentage of VAT) support the association of central obesity with a higher risk for diseases and mortality,6 the role of VAT’s counterpart, SAT, has raised great interest. Previous studies suggested that SAT actually protects from cardiometabolic disorders such as diabetes,7 hypertriglyceridemia,8 and atherosclerosis.9 Basic science on mice offered more robust evidence of adverse results (reduced glucose tolerance and muscle insulin sensitivity) after removal of SAT10 but improved results after transplantation of SAT.11 On the other hand, recent large clinical trials unveiled the association between the reduction of adipose tissue and improved CV risk. Glucagon‑like peptide 1 (GLP‑1) receptor agonists and glucose‑dependent insulinotropic polypeptide and GLP‑1 dual receptor agonist have shown benefits in obesity therapies when used to treat diabetes12 and further contributed to CV risk reduction.13 A large 10‑year prospective study revealed long‑term CV risk reduction after bariatric surgery.14 This evidence supports the hypothesis that the volume of adipose tissue is one of the factors contributing to CV health.
While the protective effects of SAT have been documented in several studies, little attention has been paid to different sites of SAT deposition. In the present study, we performed a head‑to‑head comparison of 4 common sites of skinfold measurement used to assess SAT: the triceps, subscapular and suprailiac regions, and the thigh. Their association with and predictive ability toward all‑cause, CV, and cancer mortality risk were examined.
Patients and methods
Study population
The data used in the present study were derived from the National Health and Nutrition Examination Survey (NHANES) III, carried out between 1988 and 1994.15 NHANES is a nationally representative survey of noninstitutionalized residents of the United States (US). It is one of the major programs of the National Center for Health Statistics (NCHS) at the Centers for Disease Control and Prevention (CDC). The survey was started in 1971 and became a serial event since 1999. NHANES III, which was carried out prior to 1999, is not part of the “continuous NHANES.” It was conducted in 2 phases: phase 1 (1988–1991) and phase 2 (1991–1994). Informed consent was collected from all participants, and detailed information on interview and examination procedures is available on the CDC website. From among 33 232 participants who were initially enrolled, we excluded those with insufficient data on the 4 skinfold thicknesses (STs), incomplete demographic and clinical information (including age, sex, race, C‑reactive protein [CRP] and albumin levels, comorbidities, and smoking history), and those who took medications with possible side effects of peripheral edema causing inaccuracy in ST measurements. A total of 10 261 participants aged 20 to 90 years were eligible for further analysis.
Mortality files were obtained from the data linkage program at the NCHS, which was recently updated to link the National Health Interview Survey participants to the National Death Index on mortality status and cause of death through December 31, 2015.16 The follow‑up duration was calculated as the time from the date of NHANES examination (between 1988 and 1994, when NHANES III was conducted), until either the date of death or the end of the follow‑up period (December 31, 2015). Those with documented records were regarded as deceased participants, while those without such records were assumed alive. No study participant was lost to follow‑up. The mean (SD) follow‑up duration was 13.83 (3.46) years. The primary end point of this study was the life status of each participant at the end of 2015, which could be either death (presented as all‑cause mortality) or survival. The secondary end points evaluated 2 cause‑specific mortalities, namely, CV and cancer mortality, and the effect in different age (<65 vs ≥65 years old) and sex groups (male vs female). The cause of death was identified based on the classification codes according to the International Classification of Diseases, 10th Revision.17 CV mortality was defined using codes I00–I90, I11, I13, I20–I51, and I60–I69, and cancer mortality was defined using codes C00−C97. The number of end points for all‑cause, CV, and cancer mortality was 2160, 935, and 499, respectively.
Anthropometric measurements and body fat
The protocol of measuring ST was video‑recorded and is briefly described as follows: the examiners first made landmarks on bones or midpoints of well‑defined bones on the right side of the body. Before examination, the skinfold was lifted 2 cm above the landmark. The jaw of the Holtain skinfold caliper (Holtain Ltd, Cromwell, United Kingdom) was placed perpendicular to the length of the fold, and the results were read in millimeters. The attempts that did not produce reliable results were not recorded. Four sites of ST measurement were examined. The ST of the triceps was measured at the mid‑upper arm; the ST of the subscapular region was measured at the inferior angle of the right scapula; the ST of the suprailiac region was measured at the horizontal mark just above the uppermost lateral border of the ilium and the vertical mark on the mid‑axillary line; and the ST of the thigh was measured at the midline of the right thigh.
Covariates
The details of self‑reported demographic information and laboratory test results were as follows: race was classified into 4 categories: non‑Hispanic White, non‑Hispanic Black, Mexican American, and others. The formula for BMI calculation was weight (in kilograms) divided by the square of the height (in meters). Blood pressure was measured on 2 occasions, during an in‑house interview and at the mobile examination center (MEC). In both cases, the measurement was performed with the participant placed in a sitting position, after 5 minutes of rest, and the mean of 3 repeated measurements was recorded. Waist circumference was measured at the uppermost lateral border of the ilium using a tape measure. Protocols of the abovementioned anthropometric measurements are described elsewhere.18 The participants were considered to be smokers if they responded positively to the question “Have you smoked at least 20 cigarettes in your entire life?” Medical conditions, including congestive heart failure, stroke, diabetes mellitus, and cancer were considered present if a patient had been previously diagnosed with these diseases. Serum albumin level was measured using a Beckman Coulter UniCel DxC800 Synchron autoanalyzer (Beckman Coulter Inc., Brea, California, United States).19 The serum level of low‑density lipoprotein cholesterol (LDL‑C) was not directly measured but calculated using the Friedewald formula,20 which refers to the values of total cholesterol, triglycerides, and high‑density lipoprotein cholesterol. Serum total cholesterol measurements were standardized using the Abell–Kendall method on a Hitachi 717 Analyzer (Boehringer Mannheim Diagnostics, Indianapolis, Indiana, United States).19 Serum triglycerides were measured enzymatically after hydrolyzation to glycerol (Hitachi 704 Analyzer, Hitachi, Tokyo, Japan).19 Plasma CRP levels were measured using an automated Behring Nephelometer Analyzer System (Behring Diagnostics, Inc., Somerville, New Jersey, United States).19
Statistical analysis
The software used to analyze the data in the current study was SPSS version 22.0 (IBM Corp., IBM SPSS Statistics for Windows, Armonk, New York, United States). The Cox proportional hazard model was used to calculate hazard ratios (HRs) of mortality in 4 subgroups according to the site of ST measurement: the triceps, the subscapular region, the suprailiac region, and the thigh. Receiver operating characteristic (ROC) curves were plotted to obtain the area under the curve (AUC) values and the optimal cutoff values for the 4 STs. This analysis plots sensitivity by 1‑specificity at every test value, and the optimal cutoff values were determined using the Youden index.21
Four expanded models for appropriate adjustments were created as follows: Model 1 was unadjusted; Model 2 was adjusted for age, sex, and race; Model 3 added serum CRP, albumin, and LDL‑C to adjustments included in Model 2; Model 4 added systolic blood pressure, smoking, congestive heart failure, stroke, diabetes mellitus, and cancer to adjustments included in Model 3; Model 5 added BMI to adjustments included in Model 4; and Model 6 added waist circumference to adjustments included in Model 4. P values of less than 0.05 were considered significant.
Ethics approval and consent to participate
NHANES is a publicly available dataset, and all participants in the survey provided written informed consent, consistent with approval from the National Center for Health Statistics Research Ethics Review Board.
Results
Characteristics of the study population
The demographic information of the study participants is shown in Table 1. The median ST measured at the triceps, subscapular and suprailiac regions, and the thigh was 14.90, 19.10, 19.70, and 18.00 mm, respectively. Men composed 52.7% of the study population. The median value of BMI was 25.40, and the mean systolic / diastolic blood pressure was 118/72 mm Hg. Medical conditions, including congestive heart failure, stroke, diabetes mellitus, and cancer, occurred in less than 10% of the participants.
SI conversion factors: to convert glucose to mmol/l, multiply by 0.0555; albumin to gl/l, by 10; CRP to mg/l, by 10; LDL‑C to mmol/l, by 0.0259.
Abbreviations: BMI, body mass index; CRP, C- reactive protein; IQR, interquartile range; LDL‑C, low density lipoprotein cholesterol | |||
Continuous variables | Mean (SD) | Median (IQR) | |
Triceps skinfold thickness, mm | 16.57 (7.95) | 14.90 (10.40–22.00) | |
Subscapular skinfold thickness, mm | 19.93 (8.07) | 19.10 (13.60–25.20) | |
Suprailiac skinfold thickness, mm | 20.32 (9.49) | 19.70 (12.48–27.60) | |
Thigh skinfold thickness, mm | 20.32 (10.99) | 18.00 (10.90–29.30) | |
Age, y | 47.35 (19.24) | 43 (30–63) | |
Height, cm | 167.15 (9.87) | 167.30 (159.8–174.2) | |
Weight, kg | 72.17 (14.85) | 70.90 (61.30–81.50) | |
BMI, kg/m2 | 25.73 (4.27) | 25.40 (22.70–28.30) | |
Waist circumference, cm | 90.59 (12.59) | 90.00 (81.20–99.10) | |
Systolic blood pressure, mm Hg | 124.70 (21.69) | 118 (110–136) | |
Diastolic blood pressure, mm Hg | 72.16 (13.12) | 72 (64–80) | |
Serum fasting glucose, mg/dl | 100.83 (34.92) | 92.0 (4.72–5.55) | |
Serum albumin, g/dl | 4.18 (0.37) | 4.10 (4.00–4.40) | |
CRP, mg/dl | 0.42 (0.74) | 0.21 (0.21–0.33) | |
LDL‑C, mg/dl | 127.58 (38.81) | 124 (101–151) | |
Categorical variables | n (%) | ||
Male sex | 5406 (52.7) | ||
Race | Non‑Hispanic White | 4388 (42.8) | |
Non‑Hispanic Black | 2514 (24.5) | ||
Mexican‑American | 2961 (28.9) | ||
Other | 398 (3.9) | ||
Smoker | 1207 (11.8) | ||
Hypertension | 2453 (23.9) | ||
Congestive heart failure | 280 (2.7) | ||
Stroke | 234 (2.3) | ||
Diabetes mellitus | 695 (6.8) | ||
Other cancer | 333 (3.2) | ||
Association between 4 skinfold thicknesses and all‑cause, cardiovascular, and cancer mortality risk
The HRs of the 4 SATs (as reflected by ST) associated with the 3 causes of mortality are presented in Table 2. HR represents the change in risk per 1‑mm increase in ST. For all‑cause mortality, all 4 SATs showed an HR below 1, suggesting that an increase in the thickness of each SAT resulted in a lower risk of death. Among the 4, suprailiac SAT revealed the best protective effect with the lowest HR (HR, 0.972; 95% CI, 0.965–0.979; P <0.001), while SAT of the thigh offered the least benefit with the highest HR (HR, 0.988; 95% CI, 0.982–0.994; P <0.001). For CV and cancer mortality, similar trends of protective effects were shown in all 4 SATs. All unadjusted models (Model 1) were significant, and the adjusted models (Models 2–6) were significant for ST measured at the suprailiac region for CV mortality, and for STs measured at the triceps and the thigh for cancer mortality. The ranking of 4 SATs was the same in all‑cause and CV mortality, with the following classification of protective effects (from the most to the least pronounced): suprailiac region > triceps > subscapular region > thigh. In cancer mortality, the ranking was slightly different, as the HR of the SAT of the triceps (HR, 0.979; 95% CI, 0.963–0.995; P = 0.01) was slightly better than that of the suprailiac SAT (HR, 0.982; 95% CI, 0.969–0.995; P = 0.008). Of note, the HRs that were significant in unadjusted models (Model 1) remained so in models further adjusted for BMI (Model 5) and waist circumference (Model 6). This suggests that the protective effects of SATs were independent of total obesity and central obesity. Sensitivity analysis that excluded all deaths within the first 2 years of follow‑up (Supplementary material, Table S1) showed no difference in the overall effect. A stepwise decrease in all HRs in higher‑quintile groups of the 4 SATs indicated that such protective effect could be greater in regions with thicker SAT (Supplementary material, Table S2). Collectively, the thickness of the SAT was protective against mortality risk, and the SAT thickness in the suprailiac region performed the best in such scenario.
ST measurement site | HR and P value | Model 1 | Model 2 | Model 3 | Model 4 | Model 5 | Model 6 |
Model 1 = unadjusted; Model 2 = age, sex, race; Model 3 = Model 2 + CRP, albumin, LDL‑C; Model 4 =Model 3 + systolic blood pressure, smoking, congestive heart failure, stroke, DM, other cancera; Model 5 = Model 4 + BMI; Model 6 = Model 4 + waist circumference
a Other cancer includes cancers at the following sites except for skin cancer: bladder, breast, cervix, colon, rectum, large intestine, prostate, uterus, bone, brain, nervous system, esophagus, gallbladder, Hodgkin’s disease, kidney, leukemia, liver, lung, lymphoma, mouth, pharynx, ovary, pancreas, stomach, testicles, others.
Abbreviations: DM, diabetes mellitus; HR, hazard ratio; ST, skinfold thickness; others, see Table 1 | |||||||
All‑cause mortality | |||||||
Triceps | HR (95% CI) | 0.977 (0.969–0.985) | 0.979 (0.968–0.991) | 0.976 (0.965–0.988) | 0.975 (0.964–0.987) | 0.971 (0.957–0.986) | 0.967 (0.953–0.981) |
P value | <0.001 | <0.001 | <0.001 | <0.001 | <0.001 | <0.001 | |
Subscapular region | HR (95% CI) | 0.981 (0.973–0.990) | 0.988 (0.979–0.997) | 0.987 (0.978–0.996) | 0.986 (0.977–0.995) | 0.985 (0.972–0.997) | 0.979 (0.967–0.991) |
P value | <0.001 | 0.008 | 0.004 | 0.002 | 0.02 | <0.001 | |
Suprailiac region | HR (95% CI) | 0.972 (0.965–0.979) | 0.985 (0.977–0.993) | 0.984 (0.976–0.991) | 0.984 (0.976–0.992) | 0.979 (0.968–0.990) | 0.970 (0.959–0.981) |
P value | <0.001 | <0.001 | <0.001 | <0.001 | <0.001 | <0.001 | |
Thigh | HR (95% CI) | 0.988 (0.982–0.994) | 0.985 (0.976–0.994) | 0.984 (0.975–0.992) | 0.983 (0.975–0.992) | 0.984 (0.974–0.994) | 0.982 (0.972–0.991) |
P value | <0.001 | 0.001 | <0.001 | <0.001 | 0.001 | <0.001 | |
Cardiovascular mortality | |||||||
Triceps | HR (95% CI) | 0.981 (0.969–0.994) | 0.990 (0.973–1.007) | 0.985 (0.968–1.003) | 0.983 (0.966–1.001) | 0.984 (0.962–1.006) | 0.980 (0.959–1.002) |
P value | 0.004 | 0.25 | 0.10 | 0.07 | 0.15 | 0.07 | |
Subscapular region | HR (95% CI) | 0.985 (0.973–0.998) | 0.999 (0.985–1.013) | 0.996 (0.982–1.010) | 0.995 (0.981–1.009) | 1.001 (0.982–1.021) | 0.996 (0.978–1.014) |
P value | 0.02 | 0.88 | 0.59 | 0.48 | 0.89 | 0.68 | |
Suprailiac region | HR (95% CI) | 0.968 (0.958–0.979) | 0.987 (0.975–0.999) | 0.984 (0.972–0.996) | 0.984 (0.972–0.997) | 0.980 (0.964–0.997) | 0.974 (0.956–0.991) |
P value | <0.001 | 0.04 | 0.01 | 0.01 | 0.02 | 0.003 | |
Thigh | HR (95% CI) | 0.992 (0.983–1.001) | 0.990 (0.977–1.003) | 0.988 (0.975–1.001) | 0.988 (0.974–1.001) | 0.989 (0.974–1.004) | 0.987 (0.973–1.002) |
P value | 0.048 | 0.15 | 0.08 | 0.07 | 0.15 | 0.09 | |
Cancer mortality | |||||||
Triceps | HR (95% CI) | 0.979 (0.963–0.995) | 0.977 (0.956–0.999) | 0.975 (0.953–0.997) | 0.974 (0.953–0.997) | 0.960 (0.933–0.989) | 0.956 (0.930–0.982) |
P value | 0.01 | 0.05 | 0.03 | 0.02 | 0.006 | 0.001 | |
Subscapular region | HR (95% CI) | 0.986 (0.970–1.002) | 0.989 (0.972–1.007) | 0.989 (0.972–1.007) | 0.989 (0.972–1.007) | 0.982 (0.959–1.006) | 0.974 (0.952–0.997) |
P value | 0.049 | 0.23 | 0.23 | 0.23 | 0.14 | 0.02 | |
Suprailiac region | HR (95% CI) | 0.982 (0.969–0.995) | 0.992 (0.978–1.007) | 0.992 (0.977–1.007) | 0.992 (0.976–1.007) | 0.987 (0.966–1.008) | 0.974 (0.953–0.996) |
P value | 0.008 | 0.3 | 0.3 | 0.32 | 0.22 | 0.02 | |
Thigh | HR (95% CI) | 0.986 (0.975–0.998) | 0.979 (0.962–0.996) | 0.978 (0.961–0.995) | 0.977 (0.960–0.995) | 0.972 (0.953–0.991) | 0.970 (0.952–0.989) |
P value | 0.02 | 0.02 | 0.01 | 0.01 | 0.005 | 0.002 | |
Predictive analyses using receiver operating characteristic curves in 4 skinfold thicknesses
We further conducted a ROC analysis to compare the predictive ability of each SAT toward all‑cause mortality (Figure 1). Among the 4 sites of ST measurement, the suprailiac region was associated with the greatest AUC (AUC = 0.576; 95% CI, 0.563–0.589; P <0.001), reflecting the best ability to predict survival probability. In contrast, the subscapular area had the smallest AUC (AUC = 0.531; 95% CI, 0.521–0.548; P <0.001). The AUC values of the 4 SATs were all above 0.5, indicating that all 4 SAT indices were good predictors, as compared with random models.
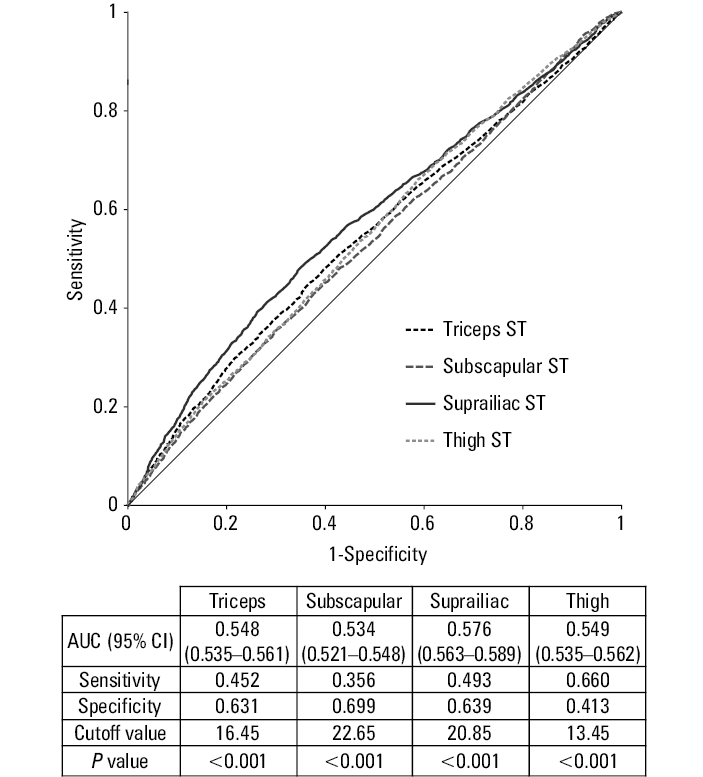
For subsequent analysis, we acquired optimal ST cutoff values according to the ROC analysis. The cutoff values for the triceps, subscapular and suprailiac regions, and the thigh were 16.45, 22.65, 20.85, and 13.45 mm, respectively.
The optimal cutoff values from the ROC analysis were used to examine the relationship between each of the 4 STs and 3 causes of mortality. Cox regression analysis was performed again using the optimal cutoff values mentioned above (Table 3). The X variable of each SAT was the subgroup with ST above the cutoff value (thicker skinfolds), and the Y variable was the cause of mortality. HR in this analysis represents the relative risk of mortality (higher when >1, and lower when <1) as compared with the cutoff value. The HRs of the 4 SATs were all lower than 1, showing that the subgroups with thicker SATs had a lower risk of mortality. The ranking of SAT was the same as that in Table 2 for all‑cause and CV mortality, as the suprailiac site had the best protective ability among the 4 sites. In addition, as we compared the HRs of the suprailiac region with respect to 3 causes of mortality, CV mortality showed the lowest HR (HR, 0.589; 95% CI, 0.483–0.717; P <0.001). The above results again demonstrated the best protective ability of the suprailiac SAT and further confirmed its greatest beneficial effect on the risk for CV events.
ST measurement site | Event, n | HR and P value | Model 1 | Model 2 | Model 3 | Model 4 | Model 5 | Model 6 |
Model 1 = unadjusted; Model 2 = age, sex, race; Model 3 = Model 2 + CRP, albumin, LDL‑C; Model 4 =Model 3 + systolic blood pressure, smoking, congestive heart failure, stroke, DM, other cancera; Model 5 = Model 4 + BMI; Model 6 = Model 4 + waist circumference
a HR in this analysis represents the relative risk compared to the cutoff value of each subcutaneous adipose tissue thickness group. Optimal cutoff values were determined by receiver operating characteristic analysis. The cutoff values of the triceps, subscapular, suprailiac, and thigh were 16.45, 22.65, 20.85, and 13.45 mm, respectively.
b Other cancer includes cancers at the following sites except for skin cancer: bladder, breast, cervix, colon, rectum, large intestine, prostate, uterus, bone, brain, nervous system, esophagus, gallbladder, Hodgkin’s disease, kidney, leukemia, liver, lung, lymphoma, mouth, pharynx, ovary, pancreas, stomach, testicles, others
| ||||||||
All‑cause mortality | ||||||||
Triceps | 874 | HR (95% CI) | 0.670 (0.571–0.785) | 0.826 (0.690–0.988) | 0.787 (0.656–0.943) | 0.791 (0.661–0.948) | 0.823 (0.676–1.001) | 0.785 (0.648–0.950) |
P value | <0.001 | 0.04 | 0.009 | 0.01 | 0.05 | 0.01 | ||
Subscapular region | 712 | HR (95% CI) | 0.713 (0.608–0.837) | 0.907 (0.771–1.067) | 0.897 (0.762–1.057) | 0.901 (0.765–1.062) | 0.967 (0.802–1.168) | 0.904 (0.752–1.087) |
P value | <0.001 | 0.24 | 0.19 | 0.21 | 0.73 | 0.28 | ||
Suprailiac region | 854 | HR (95% CI) | 0.641 (0.564–0.728) | 0.834 (0.730–0.951) | 0.717 (0.705–0.934) | 0.724 (0.707–0.943) | 0.741 (0.705–0.989) | 0.777 (0.659–0.916) |
P value | <0.001 | 0.007 | 0.003 | 0.005 | 0.04 | 0.003 | ||
Thigh | 1390 | HR (95% CI) | 0.714 (0.596–0.856) | 0.795 (0.651–0.971) | 0.768 (0.628–0.939) | 0.773 (0.633–0.946) | 0.802 (0.651–0.988) | 0.775 (0.631–0.952) |
P value | <0.001 | 0.03 | 0.01 | 0.01 | 0.04 | 0.02 | ||
Cardiovascular mortality | ||||||||
Triceps | 408 | HR (95% CI) | 0.678 (0.532–0.864) | 0.887 (0.675–1.167) | 0.833 (0.632–1.099) | 0.831 (0.631–1.094) | 0.867 (0.644–1.167) | 0.837 (0.625–1.122) |
P value | 0.002 | 0.39 | 0.19 | 0.18 | 0.35 | 0.23 | ||
Subscapular region | 313 | HR (95% CI) | 0.681 (0.532–0.873) | 0.53 (0.739–1.229) | 0.928 (0.719–1.198) | 0.933 (0.722–1.206) | 1.006 (0.751–1.347) | 0.958 (0.719–1.275) |
P value | 0.002 | 0.71 | 0.57 | 0.6 | 0.97 | 0.77 | ||
Suprailiac region | 371 | HR (95% CI) | 0.589 (0.483–0.717) | 0.850 (0.692–1.044) | 0.810 (0.658–0.997) | 0.820 (0.665–1.010) | 0.831 (0.648–1.066) | 0.785 (0.610–1.012) |
P value | <0.001 | 0.12 | 0.046 | 0.06 | 0.14 | 0.06 | ||
Thigh | 654 | HR (95% CI) | 0.618 (0.461–0.829) | 0.683 (0.496–0.940) | 0.654 (0.475–0.902) | 0.661 (0.480–0.911) | 0.676 (0.485–0.941) | 0.662 (0.477–0.918) |
P value | 0.001 | 0.02 | 0.01 | 0.01 | 0.02 | 0.01 | ||
Cancer mortality | ||||||||
Triceps | 180 | HR (95% CI) | 0.698 (0.513–0.950) | 0.802 (0.566–1.138) | 0.759 (0.534–1.081) | 0.768 (0.540–1.092) | 0.741 (0.505–1.087) | 0.703 (0.484–1.022) |
P value | 0.02 | 0.022 | 0.13 | 0.14 | 0.13 | 0.07 | ||
Subscapular region | 161 | HR (95% CI) | 0.739 (0.542–1.009) | 0.878 (0.640–1.204) | 0.878 (0.639–1.206) | 0.891 (0.648–1.226) | 0.873 (0.605–1.259) | 0.799 (0.558–1.145) |
P value | 0.06 | 0.42 | 0.42 | 0.48 | 0.47 | 0.22 | ||
Suprailiac region | 195 | HR (95% CI) | 0.672 (0.601–0.992) | 0.936 (0.724–1.210) | 0.938 (0.723–1.217) | 0.950 (0.731–1.233) | 0.944 (0.687–1.296) | 0.842 (0.609–1.163) |
P value | 0.04 | 0.61 | 0.63 | 0.69 | 0.72 | 0.29 | ||
Thigh | 289 | HR (95% CI) | 0.782 (0.554–1.106) | 0.841 (0.573–1.235) | 0.816 (0.555–1.200) | 0.829 (0.564–1.220) | 0.824 (0.551–1.232) | 0.794 (0.535–1.178) |
P value | 0.16 | 0.38 | 0.3 | 0.34 | 0.35 | 0.25 | ||
Subgroup analyses of age and sex for 3 causes of mortality in 4 skinfold thicknesses
We further performed subgroups analyses in young (<65 years) vs old (≥65 years) (Table 4) and male vs female populations (Table 5). HR represented the change in risk per 1‑mm increase in ST. We found that the protective effect was significant in the old population in terms of all‑cause (Model 6: triceps: HR, 0.971; P = 0.001; subscapular region: HR, 0.987; P = 0.04; suprailiac region: HR, 0.971; P <0.001; thigh: HR, 0.982; P = 0.001) and cancer mortality (Model 6: triceps, HR, 0.955; P = 0.007; thigh: HR, 0.964; P = 0.002). As for sex, the protective effects showed sex‑specific differences at particular sites with respect to different causes of mortality. At the triceps, the protective effect was significant in women for all‑cause mortality (Model 6: HR, 0.954; P <0.001), whereas in men it was significant for cancer mortality (Model 6: HR, 0.957; P = 0.03). At the subscapular region, the protective effect was significant in men for all‑cause (Model 6: HR, 0.984; P = 0.03) and cancer mortality (Model 6: HR, 0.969; P = 0.04). At the suprailiac region, the protective effect was significant in men for all‑cause (Model 6: HR, 0.976; P = 0.002) and CV mortality (Model 6: HR, 0.977; P = 0.048). At the thigh, the protective effect was significant in women for all‑cause mortality (Model 6: HR, 0.971; P <0.001). Collectively, the male population manifested protective effects of SAT at more sites than the female population.
ST measurement site | Age, y | HR and P value | Model 1 | Model 2 | Model 3 | Model 4 | Model 5 | Model 6 |
Model 1 = unadjusted; Model 2 = age, sex, race; Model 3 = Model 2 + CRP, albumin, LDL‑C; Model 4 =Model 3 + systolic blood pressure, smoking, congestive heart failure, stroke, DM, other cancera; Model 5 = Model 4 + BMI; Model 6 = Model 4 + waist circumference
a Other cancer includes cancers at the following sites except for skin cancer: bladder, breast, cervix, colon, rectum, large intestine, prostate, uterus, bone, brain, nervous system, esophagus, gallbladder, Hodgkin’s disease, kidney, leukemia, liver, lung, lymphoma, mouth, pharynx, ovary, pancreas, stomach, testicles, others.
| ||||||||
All‑cause mortality | ||||||||
Triceps | <65 | HR (95% CI) | 0.981 (0.963–0.999) | 0.978 (0.954–1.002) | 0.978 (0.954–1.002) | 0.973 (0.949–0.997) | 0.959 (0.927–0.992) | 0.959 (0.929–0.990) |
P value | 0.043 | 0.008 | 0.007 | 0.03 | 0.02 | 0.01 | ||
≥65 | HR (95% CI) | 0.965 (0.955–0.975) | 0.982 (0.969–0.995) | 0.979 (0.966–0.992) | 0.977 (0.964–0.991) | 0.976 (0.960–0.992) | 0.971 (0.955–0.986) | |
P value | <0.001 | 0.007 | 0.002 | 0.001 | 0.004 | <0.001 | ||
Subscapular region | <65 | HR (95% CI) | 0.993 (0.976–1.011) | 0.980 (0.962–1.000) | 0.980 (0.961–1.000) | 0.977 (0.957–0.996) | 0.960 (0.932–0.988) | 0.960 (0.934–0.986) |
P value | 0.46 | 0.045 | 0.046 | 0.02 | 0.005 | 0.003 | ||
≥65 | HR (95% CI) | 0.969 (0.959–0.978) | 0.992 (0.982–1.003) | 0.991 (0.981–1.002) | 0.990 (0.980–1.001) | 0.994 (0.980–1.008) | 0.987 (0.973–1.000) | |
P value | <0.001 | 0.046 | 0.11 | 0.03 | 0.38 | 0.04 | ||
Suprailiac region | <65 | HR (95% CI) | 0.999 (0.985–1.014) | 0.990 (0.975–1.005) | 0.990 (0.974–1.006) | 0.988 (0.973–1.004) | 0.983 (0.960–1.005) | 0.976 (0.953–1.000) |
P value | 0.93 | 0.19 | 0.21 | 0.14 | 0.13 | 0.05 | ||
≥65 | HR (95% CI) | 0.962 (0.954–0.971) | 0.985 (0.976–0.994) | 0.983 (0.974–0.993) | 0.984 (0.974–0.993) | 0.980 (0.967–0.992) | 0.971 (0.958–0.983) | |
P value | <0.001 | 0.001 | <0.001 | 0.001 | 0.002 | <0.001 | ||
Thigh | <65 | HR (95% CI) | 0.984 (0.971–0.998) | 0.987 (0.967–1.007) | 0.985 (0.965–1.005) | 0.985 (0.966–1.005) | 0.984 (0.962–1.007) | 0.983 (0.962–1.005) |
P value | 0.023 | 0.19 | 0.14 | 0.13 | 0.17 | 0.13 | ||
≥65 | HR (95% CI) | 0.982 (0.975–0.988) | 0.985 (0.975–0.995) | 0.984 (0.974–0.994) | 0.984 (0.974–0.994) | 0.985 (0.974–0.996) | 0.982 (0.972–0.993) | |
P value | <0.001 | 0.003 | 0.001 | 0.001 | 0.006 | 0.001 | ||
Cardiovascular mortality | ||||||||
Triceps | <65 | HR (95% CI) | 0.996 (0.963–1.030) | 1.019 (0.975–1.065) | 1.017 (0.972–1.064) | 1.002 (0.957–1.048) | 0.941 (0.883–1.003) | 0.965 (0.909–1.024) |
P value | 0.8 | 0.4 | 0.48 | 0.95 | 0.06 | 0.24 | ||
≥65 | HR (95% CI) | 0.968 (0.954–0.983) | 0.985 (0.966–1.004) | 0.982 (0.963–1.002) | 0.979 (0.960–0.999) | 0.990 (0.967–1.015) | 0.982 (0.960–1.006) | |
P value | <0.001 | 0.13 | 0.07 | 0.04 | 0.44 | 0.14 | ||
Subscapular region | <65 | HR (95% CI) | 1.026 (0.994–1.060) | 1.002 (0.986–1.059) | 1.019 (0.983–1.057) | 1.008 (0.972–1.045) | 0.958 (0.908–1.011) | 0.978 (0.930–1.029) |
P value | 0.12 | 0.23 | 0.29 | 0.68 | 0.12 | 0.4 | ||
≥65 | HR (95% CI) | 0.969 (0.954–0.983) | 0.995 (0.980–1.011) | 0.994 (0.978–1.009) | 0.993 (0.977–1.008) | 1.010 (0.989–1.032) | 1.000 (0.980–1.020) | |
P value | <0.001 | 0.53 | 0.41 | 0.36 | 0.34 | 0.99 | ||
Suprailiac region | <65 | HR (95% CI) | 1.016 (0.988–1.044) | 1.007 (0.978–1.038) | 1.004 (0.974–1.035) | 0.999 (0.970–1.029) | 0.951 (0.908–0.995) | 0.960 (0.918–1.005) |
P value | 0.28 | 0.62 | 0.79 | 0.95 | 0.03 | 0.08 | ||
≥65 | HR (95% CI) | 0.957 (0.945–0.970) | 0.982 (0.969–0.996) | 0.980 (0.966–0.994) | 0.980 (0.966–0.994) | 0.985 (0.966–1.003) | 0.976 (0.957–0.995) | |
P value | <0.001 | 0.009 | 0.004 | 0.005 | 0.11 | 0.01 | ||
Thigh | <65 | HR (95% CI) | 0.983 (0.957–1.009) | 1.000 (0.963–1.039) | 0.995 (0.958–1.034) | 0.991 (0.955–1.029) | 0.960 (0.919–1.002) | 0.972 (0.932–1.013) |
P value | 0.19 | 0.99 | 0.81 | 0.64 | 0.06 | 0.18 | ||
≥65 | HR (95% CI) | 0.985 (0.976–0.995) | 0.989 (0.975–1.003) | 0.987 (0.973–1.002) | 0.987 (0.972–1.001) | 0.994 (0.978–1.010) | 0.989 (0.974–1.005) | |
P value | 0.003 | 0.12 | 0.08 | 0.07 | 0.44 | 0.2 | ||
Cancer mortality | ||||||||
Triceps | <65 | HR (95% CI) | 0.994 (0.966–1.023) | 0.952 (0.914–0.991) | 0.953 (0.915–0.993) | 0.951 (0.913–0.991) | 0.949 (0.898–1.004) | 0.939 (0.892–0.989) |
P value | 0.69 | 0.02 | 0.02 | 0.02 | 0.07 | 0.02 | ||
≥65 | HR (95% CI) | 0.962 (0.941–0.983) | 0.980 (0.953–1.007) | 0.976 (0.949–1.004) | 0.975 (0.948–1.003) | 0.955 (0.922–0.989) | 0.955 (0.924–0.988) | |
P value | <0.001 | 0.15 | 0.09 | 0.08 | 0.01 | 0.007 | ||
Subscapular region | <65 | HR (95% CI) | 0.978 (0.949–1.008) | 0.954 (0.923–0.986) | 0.955 (0.924–0.988) | 0.955 (0.923–0.987) | 0.944 (0.899–0.991) | 0.933 (0.891–0.977) |
P value | 0.15 | 0.005 | 0.008 | 0.007 | 0.02 | 0.003 | ||
≥65 | HR (95% CI) | 0.982 (0.962–1.002) | 0.998 (0.977–1.019) | 0.998 (0.977–1.019) | 0.998 (0.977–1.019) | 0.989 (0.961–1.017) | 0.984 (0.958–1.012) | |
P value | 0.08 | 0.85 | 0.83 | 0.83 | 0.44 | 0.27 | ||
Suprailiac region | <65 | HR (95% CI) | 0.987 (0.9641.012) | 0.976 (0.951–1.002) | 0.978 (0.952–1.004) | 0.976 (0.950–1.003) | 0.983 (0.945–1.021) | 0.964 (0.925–1.005) |
P value | 0.3 | 0.08 | 0.1 | 0.08 | 0.37 | 0.09 | ||
≥65 | HR (95% CI) | 0.981 (0.9640.999) | 0.97 (0.978–1.015) | 0.996 (0.977–1.015) | 0.996 (0.977–1.015) | 0.986 (0.961–1.012) | 0.979 (0.953–1.005) | |
P value | 0.03 | 0.73 | 0.66 | 0.67 | 0.29 | 0.11 | ||
Thigh | <65 | HR (95% CI) | 1.004 (0.983–1.025) | 0.980 (0.950–1.011) | 0.981 (0.950–1.012) | 0.983 (0.953–1.015) | 0.994 (0.959–1.030) | 0.987 (0.954–1.020) |
P value | 0.720 | 0.21 | 0.22 | 0.3 | 0.74 | 0.43 | ||
≥65 | HR (95% CI) | 0.973 (0.959–0.987) | 0.975 (0.955–0.996) | 0.974 (0.954–0.994) | 0.973 (0.953–0.994) | 0.963 (0.941–0.986) | 0.964 (0.943–0.986) | |
P value | <0.001 | 0.02 | 0.01 | 0.01 | 0.002 | 0.002 | ||
ST measurement site | Sex | HR and P value | Model 1 | Model 2 | Model 3 | Model 4 | Model 5 | Model 6 |
Model 1 = unadjusted; Model 2 = age, sex, race; Model 3 = Model 2 + CRP, albumin, LDL‑C; Model 4 =Model 3 + systolic blood pressure, smoking, congestive heart failure, stroke, DM, other cancera; Model 5 = Model 4 + BMI; Model 6 = Model 4 + waist circumference
a Other cancer includes cancers at the following sites except for skin cancer: bladder, breast, cervix, colon, rectum, large intestine, prostate, uterus, bone, brain, nervous system, esophagus, gallbladder, Hodgkin’s disease, kidney, leukemia, liver, lung, lymphoma, mouth, pharynx, ovary, pancreas, stomach, testicles, others.
| ||||||||
All‑cause mortality | ||||||||
Triceps | Male | HR (95% CI) | 0.998 (0.983–1.014) | 0.981 (0.964–0.99) | 0.980 (0.963–0.998) | 0.978 (0.961–0.996) | 0.985 (0.963–1.007) | 0.982 (0.961–1.004) |
P value | 0.82 | 0.04 | 0.03 | 0.02 | 0.19 | 0.11 | ||
Female | HR (95% CI) | 0.969 (0.956–0.983) | 0.978 (0.963–0.993) | 0.975 (0.959–0.990) | 0.973 (0.958–0.989) | 0.959 (0.940–0.979) | 0.954 (0.936–0.972) | |
P value | <0.001 | 0.005 | 0.001 | 0.001 | <0.001 | <0.001 | ||
Subscapular region | Male | HR (95% CI) | 0.994 (0.983–1.006) | 0.985 (0.973–0.998) | 0.984 (0.972–0.997) | 0.983 (0.970–0.995) | 0.986 (0.969–1.004) | 0.984 (0.968–1.001) |
P value | 0.33 | 0.02 | 0.01 | 0.007 | 0.12 | 0.03 | ||
Female | HR (95% CI) | 0.971 (0.959–0.983) | 0.992 (0.979–1.005) | 0.992 (0.979–1.005) | 0.991 (0.977–1.004) | 0.984 (0.966–1.003) | 0.972 (0.955–0.990) | |
P value | <0.001 | 0.23 | 0.23 | 0.18 | 0.1 | 0.12 | ||
Suprailiac region | Male | HR (95% CI) | 0.965 (0.956–0.974) | 0.980 (0.970–0.991) | 0.980 (0.970–0.990) | 0.981 (0.970–0.991) | 0.979 (0.965–0.994) | 0.976 (0.961–0.991) |
P value | <0.001 | <0.001 | <0.001 | <0.001 | 0.005 | 0.002 | ||
Female | HR (95% CI) | 0.980 (0.970–0.991) | 0.991 (0.980–1.003) | 0.978 (0.978–1.001) | 0.989 (0.977–1.001) | 0.980 (0.964–0.997) | 0.961 (0.944–0.978) | |
P value | <0.001 | 0.14 | 0.08 | 0.07 | 0.02 | 0.08 | ||
Thigh | Male | HR (95% CI) | 1.003 (0.990–1.016) | 0.991 (0.978–1.003) | 0.990 (0.977–1.002) | 0.989 (0.976–1.001) | 0.994 (0.980–1.008) | 0.993 (0.979–1.007) |
P value | 0.65 | 0.14 | 0.12 | 0.08 | 0.42 | 0.31 | ||
Female | HR (95% CI) | 0.990 (0.979–1.001) | 0.979 (0.968–0.991) | 0.978 (0.966–0.990) | 0.978 (0.966–0.990) | 0.973 (0.959–0.986) | 0.971 (0.959–0.984) | |
P value | 0.07 | 0.001 | <0.001 | <0.001 | <0.001 | <0.001 | ||
Cardiovascular mortality | ||||||||
Triceps | Male | HR (95% CI) | 1.006 (0.982–1.029) | 0.991 (0.965–1.018) | 0.988 (0.962–1.015) | 0.984 (0.958–1.012) | 0.992 (0.959–1.026) | 0.991 (0.959–1.024) |
P value | 0.64 | 0.5 | 0.37 | 0.26 | 0.65 | 0.59 | ||
Female | HR (95% CI) | 0.972 (0.952–0.993) | 0.992 (0.968–1.016) | 0.987 (0.963–1.012) | 0.984 (0.960–1.009) | 0.980 (0.950–1.011) | 0.973 (0.945–1.002) | |
P value | 0.009 | 0.49 | 0.29 | 0.21 | 0.2 | 0.07 | ||
Subscapular region | Male | HR (95% CI) | 1.002 (0.984–1.019) | 0.997 (0.978–1.017) | 0.995 (0.975–1.014) | 0.992 (0.973–1.012) | 1.002 (0.975–1.029) | 1.000 (0.974–1.026) |
P value | 0.86 | 0.78 | 0.6 | 0.43 | 0.9 | 0.99 | ||
Female | HR (95% CI) | 0.971 (0.953–0.990) | 1.004 (0.984–1.025) | 1.003 (0.982–1.024) | 1.001 (0.979–1.023) | 1.006 (0.977–1.026) | 0.994 (0.967–1.022) | |
P value | 0.002 | 0.67 | 0.77 | 0.94 | 0.68 | 0.68 | ||
Suprailiac region | Male | HR (95% CI) | 0.963 (0.949–0.976) | 0.982 (0.966–0.998) | 0.980 (0.964–0.996) | 0.981 (0.964–0.997) | 0.978 (0.956–1.001) | 0.977 (0.954–1.000) |
P value | <0.001 | 0.03 | 0.02 | 0.02 | 0.06 | 0.048 | ||
Female | HR (95% CI) | 0.975 (0.958–0.991) | 0.995 (0.976–1.013) | 0.981 (0.972–1.010) | 0.989 (0.970–1.008) | 0.984 (0.959–1.010) | 0.967 (0.940–0.995) | |
P value | 0.003 | 0.56 | 0.36 | 0.27 | 0.24 | 0.02 | ||
Thigh | Male | HR (95% CI) | 1.005 (0.986–1.024) | 0.991 (0.972–1.010) | 0.989 (0.970–1.008) | 0.988 (0.969–1.007) | 0.992 (0.970–1.014) | 0.991 (0.970–1.013) |
P value | 0.62 | 0.36 | 0.27 | 0.22 | 0.46 | 0.42 | ||
Female | HR (95% CI) | 0.997 (0.980–1.014) | 0.989 (0.970–1.008) | 0.987 (0.968–1.006) | 0.988 (0.969–1.007) | 0.986 (0.965–1.009) | 0.983 (0.963–1.004) | |
P value | 0.74 | 0.26 | 0.18 | 0.22 | 0.23 | 0.11 | ||
Cancer mortality | ||||||||
Triceps | Male | HR (95% CI) | 0.984 (0.953–1.016) | 0.963 (0.928–0.999) | 0.963 (0.928–0.999) | 0.960 (0.925–0.996) | 0.960 (0.916–1.006) | 0.957 (0.914–1.002) |
P value | 0.33 | 0.04 | 0.046 | 0.03 | 0.09 | 0.03 | ||
Female | HR (95% CI) | 0.981 (0.955–1.008) | 0.981 (0.953–1.009) | 0.979 (0.950–1.008) | 0.979 (0.950–1.008) | 0.944 (0.909–0.982) | 0.940 (0.907–0.975) | |
P value | 0.18 | 0.18 | 0.15 | 0.15 | 0.17 | 0.18 | ||
Subscapular region | Male | HR (95% CI) | 0.984 (0.962–1.007) | 0.974 (0.949–0.999) | 0.975 (0.951–1.000) | 0.973 (0.948–0.998) | 0.970 (0.937–1.005) | 0.969 (0.937–1.002) |
P value | 0.18 | 0.04 | 0.05 | 0.03 | 0.1 | 0.04 | ||
Female | HR (95% CI) | 0.991 (0.968–1.014) | 0.999 (0.975–1.024) | 1.001 (0.976–1.026) | 1.002 (0.977–1.027) | 0.982 (0.948–1.017) | 0.964 (0.932–0.998) | |
P value | 0.45 | 0.96 | 0.96 | 0.87 | 0.31 | 0.4 | ||
Suprailiac region | Male | HR (95% CI) | 0.964 (0.946–0.981) | 0.979 (0.959–0.999) | 0.980 (0.960–1.000) | 0.979 (0.959–1.000) | 0.980 (0.951–1.009) | 0.976 (0.946–1.006) |
P value | <0.001 | 0.04 | 0.06 | 0.05 | 0.17 | 0.11 | ||
Female | HR (95% CI) | 1.006 (0.985–1.027) | 1.010 (0.988–1.032) | 1.008 (0.986–1.031) | 1.008 (0.986–1.031) | 0.996 (0.965–1.028) | 0.972 (0.940–1.004) | |
P value | 0.58 | 0.4 | 0.47 | 0.49 | 0.81 | 0.08 | ||
Thigh | Male | HR (95% CI) | 0.989 (0.964–1.016) | 0.975 (0.950–1.002) | 0.977 (0.951–1.003) | 0.975 (0.950–1.001) | 0.979 (0.951–1.008) | 0.978 (0.949–1.007) |
P value | 0.43 | 0.07 | 0.08 | 0.06 | 0.16 | 0.13 | ||
Female | HR (95% CI) | 0.990 (0.969–1.012) | 0.980 (0.958–1.002) | 0.980 (0.957–1.002) | 0.979 (0.957–1.002) | 0.964 (0.940–0.990) | 0.965 (0.942–0.989) | |
P value | 0.38 | 0.08 | 0.08 | 0.07 | 0.06 | 0.07 | ||
Discussion
The main finding of our study was the inverse correlation between ST and the risk for all‑cause, CV, and cancer mortality, reflecting the possible protective ability of superficial SAT (SSAT) against adverse health events. This effect was most notable for SSAT measured at the suprailiac region.
Regional fat distribution has received a lot of attention from researchers as increasing evidence has shown its prognostic ability to be more accurate than that of the common total body fat indicator, BMI.22,23 Ruderman et al24 showed that metabolically obese, normal‑weight individuals had a higher risk of cardiometabolic complications than the metabolically healthy obese patients. Their findings suggested that the risk was elevated in patients with a normal BMI but with central obesity.6,24,25 This may be explained by the fact that there are actually 2 categories of adipose tissue: VAT and SAT. The former has already been proven to have a negative impact on various health conditions, especially CV and metabolic diseases. Multifactorial underlying mechanisms have been proposed, including secretion of inflammatory cytokines (interleukin 1, interleukin 6, tumor necrosis factor α) by visceral adipocytes,26 increase in free fatty acid availability,27 and alterations in plasma glucose homeostasis.28,29 Having gained sufficient knowledge on VAT, scientists developed interest in its counterpart, SAT. Recent studies compared VAT and SAT to explore the differences between these 2 types of adipose tissue. A study that measured fat by computed tomography (CT) showed that the amount of VAT altered the carbohydrate and lipoprotein metabolism, while an increase in femoral fat (a type of SAT) may be protective against the adverse effects of obesity on plasma lipoprotein levels.30 Another study, in which 3001 participants from the Framingham Heart Study were recruited, revealed that abdominal SAT was associated with lower serum triglyceride levels, suggesting that SAT was actually a protective fat depot.8 A recent study of 2683 postmenopausal women more directly observed that elevated amount of trunk fat (similar to VAT) and reduced amount of leg fat (similar to SAT) were associated with an increased risk of CV disease.31 Taken globally, a new concept of “adverse fat distribution,” characterized by increased VAT and decreased SAT, was proposed to be a warning sign of an increased risk for cardiometabolic events.32
Although previous studies have offered robust evidence regarding the protective effects of SAT, limited information is available on SAT at different sites. In addition, diseases and cause‑specific mortalities have been discussed in separate studies, but direct comparisons are lacking. To the best of our knowledge, this study is the first to include head‑to‑head comparisons between 4 common SAT deposits and 3 causes of mortality.
The superiority of suprailiac SAT found in our study has not been discussed in the past. Several previous studies regarded ST of the suprailiac region as the trunk fat index and calculated trunk / extremity skinfold ratios (representing central / peripheral fat ratios) accordingly.33,34 The results showed a positive correlation between truncal fat and cardiometabolic indices such as blood pressure, plasma glucose, and serum lipid profiles. However, the sample sizes were small, and the studies lacked sufficient follow‑up periods. More importantly, the accuracy of ST as an indicator of truncal fat is doubtful. In fact, it has been proposed that SAT should be further separated into 2 layers: SSAT and deep SAT (DSAT).35 Emerging evidence showed that the protective role of SAT is actually contributed to SSAT rather than to DSAT. A study performed using abdominal magnetic resonance imaging clearly distinguished between SSAT and DSAT, and abdominal SSAT was related to lower fasting plasma glucose and glycated hemoglobin A1c levels.36 Other studies also revealed protective effects of SSAT on lipid profiles and glucose homeostasis.37 We considered the measurement with a caliper, as performed in NHANES III, to reflect SSAT thickness, in accordance with the results of a previous study that first proposed the subdivision into SSAT and DSAT.38 The authors used dissections on cadavers and clearly defined the fascia that separated SSAT and DSAT, and the results of SSAT thickness measurements in our study were in line with theirs. Therefore, the findings of our study explain the protective role of SSAT. In addition, the anatomical position of the suprailiac site as defined in our study is the closest one to abdominal SAT, the largest SAT deposition site and fat buffer storage in humans. Consequently, the best protective ability of suprailiac SAT is reasonable and corroborates the results of previous reports.8,39,40
The reason why SSAT is associated with benefits rather than harm may be attributed to its role of a metabolic “sink” to store excessive fat.41 Functioning as a lipid‑buffering tissue, SSAT helps maintain the homeostasis of daily nutrient influx. These safe fat depots prevent ectopic fat accumulation in nonadipose tissues such as the liver, heart, or pancreas, which leads to so‑called “lipotoxicity.”42 Studies supporting this idea showed that gluteofemoral fat (a type of SSAT) is associated with lower triglyceride levels, higher high‑density lipoprotein cholesterol levels, and a favorable lipoprotein lipase activity.43-45 On the other hand, SSAT secretes more anti‑inflammatory adipokines, such as adiponectin, and less harmful molecules, such as free fatty acids.42 Ensuring good balance of this complex endocrine organ, adipose tissue, is one of the important roles of SSAT. Failure to expand the SSAT stores can result in deleterious effects that were observed in rodents. Two scenarios were tested, revealing that transplantation of SSAT was beneficial to recipients, with improved insulin sensitivity and decreased weight,11 while removal of SSAT resulted in fat dysregulation, with an increase in serum triglyceride levels.10
The findings of our study seem to be paradoxical in the context of the conventional concept pertaining to the detrimental role of subcutaneous fat in terms of the risk for mortality and cardiometabolic events. This may be partly explained by the term “reverse epidemiology,” which was first proposed to address the relationship between several metabolic risk factors and poor outcome in dialysis patients, as compared with the general population.46 In these patients, factors such as obesity, hypercholesterolemia, elevated creatinine levels, and hypertension appeared to be related to decreased morbidity and mortality. Similarly, SSAT in our study was associated with a lower risk of mortality. These paradoxical observations do not necessarily suggest an contradictory physiological mechanism, but rather indicate that there may be other, more compelling factors that dominate and alter the relationship between traditional risk factors and outcomes. In our study, it may be the role of a “fat sink” ascribed to SSAT, which has an impact on vascular dysfunction and, consequently, leads to an opposite‑than‑expected predictive pattern. Similarly, a recent study investigating salivary inflammatory markers in obese individuals found that they had significantly lower levels of soluble CD40 ligand than nonobese individuals, which also seemed to have the best discriminatory value.47 The reverse epidemiology concerning biomarkers for obesity and inflammation warrants further research.
There are several limitations that should be identified in our study. Firstly, the available data regarding SAT in the NHANES III were obtained by ST measurement. This is a common and inexpensive method to estimate body fat, but the validity and reliability depend much on the skills of technicians and the health status of participants.48 The NHANES coordinators employed well‑trained staff at the MECs, which should have made the test more standardized. However, CT, magnetic resonance imaging, and dual‑energy X‑ray absorptiometry still serve as more accurate measurement tools.49 Secondly, previous literature suggests that studies on fat distribution should adjust for the concomitant variation in corresponding adiposity.50 A better analytic design proposed in this study is using participants with similar VAT percentages as controls and making comparisons with respect to SAT. However, relevant VAT data were not provided in NHANES III. Further studies are warranted to confirm our results, using more advanced means of measurement and more comprehensive adjustment qualifications. Lastly, since NHANES III was performed in 1988–1994, it has to be noted that the lifestyle, health habits, and commonly used medications may have changed since that time. In addition, only 31% of the original NHANES III sample were eligible for this analysis, which may affect its representativeness of the whole US population. The generalizability of our results is also limited as NHANES only collects data from US residents. The interpretation of the results should take these factors into consideration.
Conclusions
An increase in ST is associated with a lower risk of all‑cause, CV, and cancer mortality. This effect is most notable for SSAT measured at the suprailiac region. Skinfold thickness reflects SSAT better than DSAT, suggesting possible benefits of SSAT in terms of mortality risk reduction.
- Van Gaal LF, Mertens IL, De Block CE. Mechanisms linking obesity with cardiovascular disease. Nature. 2006; 444: 875‑880. | Crossref
- Balsan GA, Vieira JL, Oliveira AM, et al. Relationship between adiponectin, obesity and insulin resistance. Rev Assoc Med Bras (1992). 2015; 61: 72‑80. | Crossref
- Ibrahim MM. Subcutaneous and visceral adipose tissue: structural and functional differences. Obes Rev. 2010; 11: 11‑18. | Crossref
- Wajchenberg BL. Subcutaneous and visceral adipose tissue: their relation to the metabolic syndrome. Endocr Rev. 2000; 21: 697‑738. | Crossref
- Fox CS, Massaro JM, Hoffmann U, et al. Abdominal visceral and subcutaneous adipose tissue compartments: association with metabolic risk factors in the Framingham Heart Study. Circulation. 2007; 116: 39‑48. | Crossref
SUPPLEMENTARY MATERIAL
ARTICLE INFORMATION