The relationship between subclinical depressive symptoms and metabolic parameters in women: a subanalysis of the Bialystok PLUS study
Key words: body composition, depression, diabetes, subclinical depressive symptoms, visceral adipose tissue


 CC BY-NC-SA 4.0
The relationship between subclinical depressive symptoms and metabolic parameters in women: a subanalysis of the Bialystok PLUS study
Introduction: Clinically overt depression is associated with an increased risk for insulin resistance. Data regarding the impact of subclinical depressive symptoms on the risk of diabetes are limited.
Objectives: The study aimed to assess the relationship of subclinical depressive symptoms with body fat distribution and diabetes risk in women.
Patients and methods: The analysis included 250 women, 68 with subclinical depressive symptoms and 182 controls. A clinical examination, oral glucose tolerance test, and lipid and liver enzyme level assessments were performed. Body composition was estimated by dual‑energy X‑ray absorptiometry. The participants completed the Beck Depression Inventory (BDI) questionnaire.
Results: The women with subclinical depressive symptoms had higher visceral adipose tissue (VAT) mass than the control group. The groups did not differ in the body mass index, waist circumference, total fat, fat‑free, android, and gynoid fat mass. Homeostatic Model Assessment for Insulin Resistance (HOMA‑IR) and alanine aminotransferase (ALT) activity were higher in the women with subclinical depressive symptoms than in the control group. In the women with subclinical depressive symptoms, we observed a positive correlation between the severity of somatic‑vegetative symptoms reported in the BDI and VAT mass, HOMA‑IR, and gamma glutamyltransferase (GGT) activity. Dysglycemia occurred more frequently in the women with subclinical depressive symptoms. In a subgroup analysis of postmenopausal women, the individuals with subclinical depressive symptoms had higher HOMA‑IR, GGT, ALT, and triglyceride / high‑density lipoprotein cholesterol ratios than the control group.
Conclusions: Subclinical depressive symptoms in women might predispose to dysglycemia.
What's new?
The present study is the first attempt to assess the relationship between subclinical depressive symptoms and a predisposition to dysglycemia in women. In our study, women with subclinical depressive symptoms had significantly higher visceral adipose tissue mass, higher values for Homeostatic Model Assessment for Insulin Resistance, and increased activity of alanine aminotransferase. Dysglycemia occurred more frequently in women with subclinical depressive symptoms. Additionally, we found a significant positive correlation between the severity of somatic‑vegetative symptoms and indirect indices of insulin resistance in women with subclinical depressive symptoms. Previous studies focused primarily on individuals with clinically overt depression and indicated that depression is associated with an increased risk for diabetes. We observed that subclinical depressive symptoms may also be associated with metabolic disturbances.
Introduction
Diabetes and depressive disorders are among the most common diseases affecting humans.1,2 Mood disorders are considered spectrum disorders, since they range from milder depressive symptoms of short duration to full‑blown clinical depression (major depressive disorder).3 Subclinical depression refers to the presence of relevant depressive symptoms that do not meet the criteria for major depressive disorder.3,4 Individuals with subclinical depressive symptoms are at a high risk of developing major depressive disorder.5 According to the current literature, subclinical symptoms of depression are associated with brain structural changes (mainly in the limbic brain regions), similar to those in clinical depression.6 According to the World Health Organization data, 4.4% of the global population suffered from depression in 2015. The prevalence of depression is higher in women than in men (5.1% vs 3.6%, respectively).2 The prevalence of subsyndromal depression is even higher,3,4 and the number of individuals with depressive disorders is constantly growing.2 COVID‑19 pandemic has caused an increase in mood disorders. According to a systematic review of the studies published in the first half of 2020, the prevalence of depressive symptoms ranged from 14.6% to 48.3%, and women were reported as generally more likely to develop depressive symptoms than men.7
The exact number of people suffering from psychiatric disorders is difficult to assess, hence the use of depression questionnaires for depression screening is recommended.1 The Beck Depression Inventory (BDI) questionnaire is a diagnostic screening tool and a widely used self‑report measure of depressive symptoms.8 In the general population, scores above 20 indicate depression.9,10
Obese individuals are at an increased risk of developing depression, while depressed patients are at an increased risk of becoming obese.11,12 Obesity is associated with an increased risk of cardiovascular disease, diabetes, dyslipidemia, and nonalcoholic fatty liver disease.13 Depression is associated with increased subcutaneous and visceral adipose tissue (VAT) content, and decreased muscle mass.14,15 Abdominal adipose tissue, particularly VAT, may be related to metabolic disturbances.13,16 In a large study, Cho et al17 demonstrated that depressive symptoms in women are associated with intra‑abdominal fat and the ratio of visceral to total adipose area. Increased VAT is connected with decreased insulin sensitivity and increased plasma lipid concentration.13,16 Changes in body composition can be influenced by psychological, hormonal, and immunological factors.11 Depression is characterized by dysregulation of the hypothalamus‑pituitary‑adrenal (HPA) axis, manifested in altered diurnal secretion of cortisol or in response to a stress task, pharmacological challenge, or awakening.18 Previous studies revealed that individuals with subclinical depressive symptoms display a disturbed cortisol awakening response.18,19 The same abnormalities are observed in a major depressive disorder.18 Alterations in the HPA axis can promote differentiation and proliferation of human adipocytes.20-22
Depression is a known, significant predictor for type 2 diabetes as well as its microvascular and macrovascular complications, which lead to increased mortality.1,23 People with depression have a 37%–60% greater risk of developing type 2 diabetes.24 The association between diabetes and depression is complex and bidirectional.1,11 The severity of depressive symptoms is associated with insulin resistance, which is a pathogenic factor of type 2 diabetes.24
Homeostatic Model Assessment for Insulin Resistance (HOMA‑IR) is a widely recognized indirect index of insulin resistance.25 Other surrogate markers of insulin resistance are: triglyceride to high‑density lipoprotein cholesterol ratio (TG/HDL ratio), gamma glutamyltransferase (GGT), and alanine aminotransferase (ALT) activity.26,27
Postmenopausal women are at a higher risk of depression and metabolic disturbances than premenopausal women.28 Postmenopausal women have higher androgen to estradiol ratio, which predisposes them to increased central adiposity. Hormonal changes can cause enhanced fat accumulation in the visceral area.29
The aim of the present study was to assess the relationship between subclinical depressive symptoms, body fat distribution, and diabetes risk in women. Previous studies focused primarily on individuals with clinically overt depression, while there is support for the notion that subclinical depression may also be associated with metabolic disturbances.
Patients and methods
Study population
Our research was part of the Bialystok PLUS population study. Ethical approval for the study was obtained from the Ethics Committee of the Medical University of Bialystok, Poland (R‑I‑002/108/2016). All procedures performed during the study were in accordance with the Declaration of Helsinki. Participation was voluntary and all participants provided a written informed consent. The participants were given a detailed explanation of all procedures prior to the commencement of the study.
The study recruitment was described previously.30 In total, 952 participants, recruited between November 2018 and July 2021, were examined. People above 65 years of age were not included due to a higher prevalence of cognitive impairment in this age group than in younger individuals. In older patients, it is difficult to distinguish between depression and cognitive decline. Men were not eligible in the current study. Finally, taking into account the exclusion criteria (see below), we included 261 women with a fully completed BDI test (Figure 1).
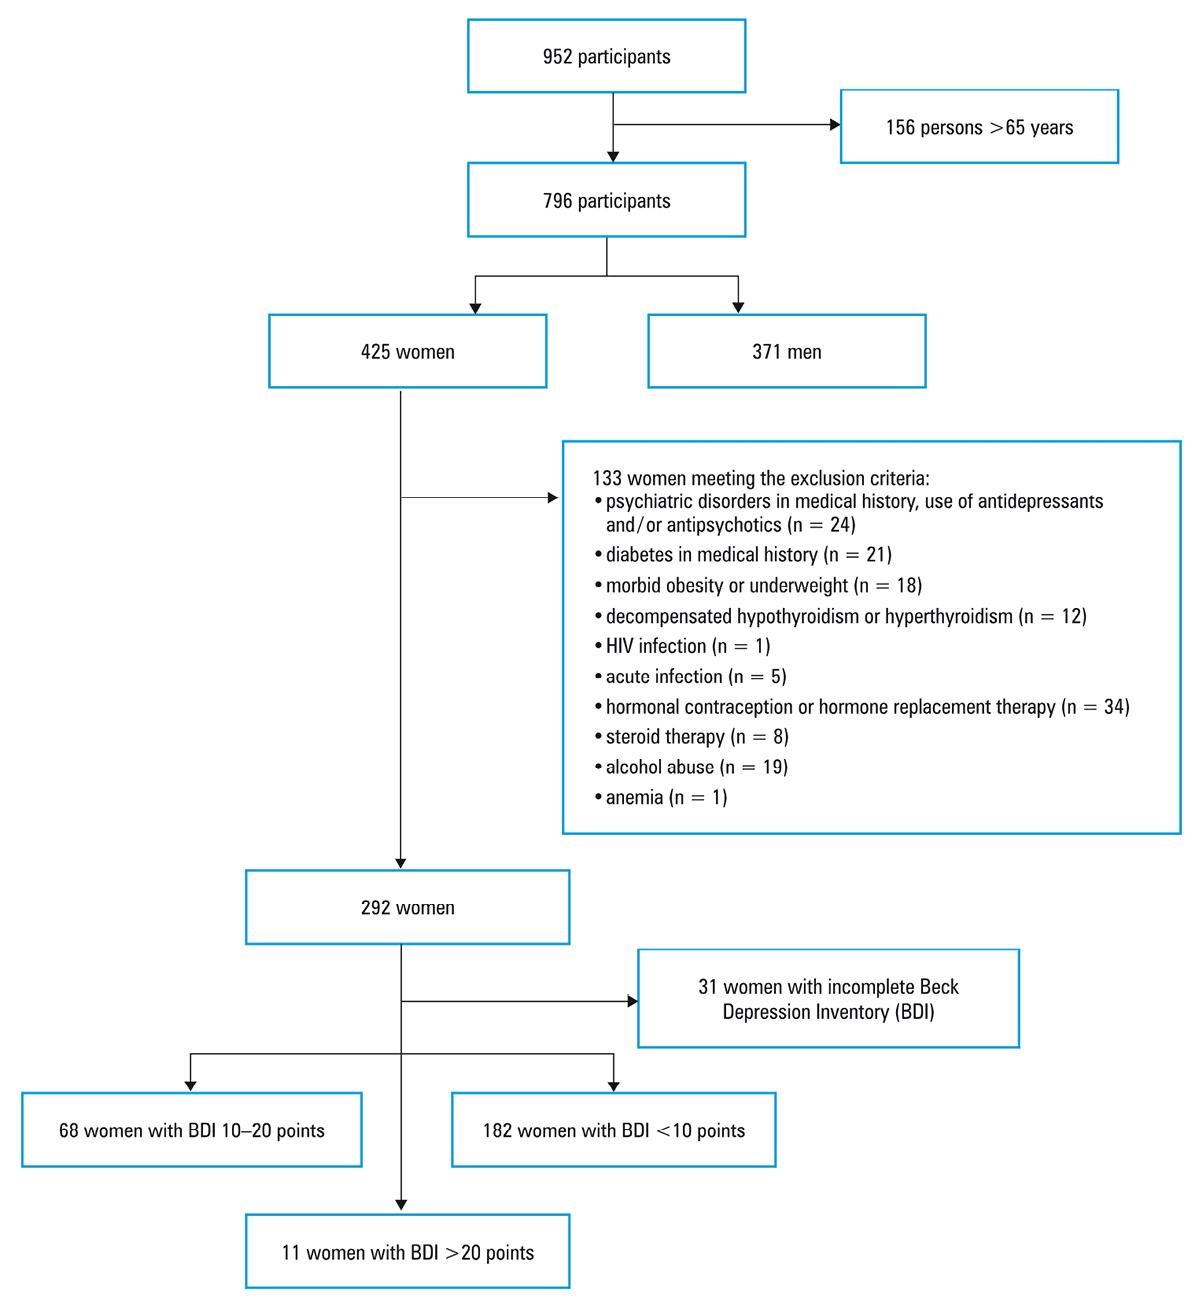
Exclusion criteria were: a personal history of depression, schizophrenia, or bipolar disorder (current or past), use of antidepressants and / or antipsychotics, diabetes in medical history, morbid obesity (body mass index, [BMI] ≥40 kg/m2), underweight (BMI <18.5 kg/m2), decompensated hypothyroidism or hyperthyroidism (thyroid‑stimulating hormone, [TSH] <0.35 µU/ml or >5 µU/ml), pregnancy or a desire to become pregnant within 6 months of commencement of the study, advanced liver disease, HIV infection, acute infection (high level of high‑sensitivity C‑reactive protein [hsCRP] ≥10 mg/l), hormonal contraception, hormone replacement therapy, steroid therapy, alcohol abuse (≥8 points in Alcohol Use Disorder Identification Test or alcohol consumption >40 g per day), anemia (blood hemoglobin <8 g/dl).
Beck Depression Inventory
The BDI is a commonly available self‑report rating inventory for diagnostic screening. The study participants completed the Polish version of the BDI that measured the symptoms of depression within the preceding month, with high scores reflecting greater severity of depressed mood (range 0–63). In previous studies, the cutoff point for subclinical depressive symptoms in the BDI was 10 points.19,31 In our study, women who scored 10–20 points on the BDI were assumed to have subclinical depressive symptoms. Those who scored below 10 points on the BDI constituted the control group.
The items comprising the BDI are divided into 2 subscales. The cognitive‑affective symptoms include the following items: 1 (mood), 2 (pessimism), 3 (sense of failure), 4 (self‑dissatisfaction), 5 (guilt), 6 (punishment), 7 (self‑dislike), 8 (self‑accusation), 9 (suicidal ideas), 10 (crying), 11 (irritability), 12 (social withdrawal), 13 (indecisiveness), while the somatic‑vegetative symptoms include the following items: 14 (body image change), 15 (work difficulty), 16 (insomnia), 17 (fatigability), 18 (loss of appetite), 19 (weight loss), 20 (somatic preoccupation), and 21 (loss of libido).
Anthropometric and sociodemographic parameters
All study participants underwent a general physical examination. Anthropometric measurements including height, weight, waist and hip circumferences were taken. BMI was calculated as body weight in kilograms divided by height in meters squared. The body composition was evaluated by a dual‑energy X‑ray absorptiometry (DXA) scan (Lunar iDXA, GE Healthcare, Chicago, Illinois, United States) at the Clinical Research Center, Medical University of Bialystok. The body composition analysis was controlled by a qualified staff member. The equipment was calibrated before each examination. The study participants were positioned on the examination Table in a supine position, with their feet secured with an adjustable strap and their arms by their sides. Each examination took approximately 8 minutes. Using this method, the body composition including body fat (kg) and fat‑free (kg) tissue was estimated. For each area of the body (head, trunk, arms, and legs), DXA assessed lean mass and fat mass with the precision (coefficient of variation) of 2% and 8%, respectively.
In our study, postmenopausal status was defined as the period of time after a woman has experienced 12 consecutive months without menstruation. Daily alcohol intake was calculated from monthly alcohol consumption. Physical activity and smoking were assessed by self‑report questionnaires.
Biochemical and hormonal measurements
Oral glucose tolerance test (OGTT) with glucose and insulin measurements in the blood was performed. OGTT was carried out using 75 g of glucose after an 8- to 12‑hour overnight fast. All participants were advised to follow their normal diet. Blood samples were collected at 0, 1, and 2 h post glucose administration to determine glucose and insulin levels. Plasma glucose levels were measured immediately using the enzymatic reference method with hexokinase (Cobas c111, Roche Diagnostic Ltd., Rotkreuz, Switzerland). Serum insulin, C‑peptide, cortisol, and TSH concentrations were assayed by electro‑chemiluminescence immunoassay (Cobas e411, Roche Diagnostic Ltd.). Plasma total cholesterol, high‑density lipoprotein cholesterol (HDL‑C), triglyceride (TG), and GGT were assessed by the enzymatic colorimetric method (Cobas c111, Roche Diagnostic Ltd.). Plasma low‑density lipoprotein cholesterol (LDL‑C) was calculated according to the Friedewald formula. Serum concentrations of hsCRP were measured with high‑sensitive immuno‑turbidimetric assay (Cobas c111, Roche Diagnostic Ltd.). ALT and aspartate aminotransferase (AST) were assessed as recommended by the International Federation of Clinical Chemistry and Laboratory Medicine without pyridoxal phosphate (Cobas c111, Roche Diagnostic Ltd.). Glycated hemoglobin was determined with high‑performance liquid chromatography (D‑10 Hemoglobin Testing System from Bio‑Rad, Hercules, California, United States).
HOMA‑IR was calculated as fasting insulin level (µIU/ml) × fasting plasma glucose level (mg/dl)/405,25 and TG/HDL‑C ratio as serum TG level (mg/dl)/HDL‑C level (mg/dl).
Diagnosis of dysglycemia
All blood measurements were performed during a single appointment, and therefore only 1 fasting glucose measurement was obtained. Diabetes was diagnosed in the patients with glucose level at 2 h of OGTT equal to or higher than 200 mg/dl or glycated hemoglobin equal to or higher than 6.5%. Prediabetes, that is, impaired fasting glucose (IFG) and impaired glucose tolerance (IGT), was diagnosed as follows: IFG was diagnosed in the patients with fasting glucose level equal to or higher than 100 mg/dl and glucose level at 2 h of OGTT below 140 mg/dl, and IGT was diagnosed in the patients with glucose level at 2 h of OGTT between 140 and 199 mg/dl. Glucose metabolism was considered normal if fasting glucose level was below 100 mg/dl, and glucose level at 2 h of OGTT was below 140 mg/dl.32,33
Statistical analysis
Statistical analyses were performed using Statistica 13.0 (Statsoft Inc., Tulsa, Oklahoma, United States) and STATA 16 (StataCorp LP, College Station, Texas, United States). The variables were tested for normal distribution using the Shapiro–Wilk test. Due to the non‑normal distribution of data, all values were expressed as median and interquartile range. Comparisons between 2 groups were performed using the Mann–Whitney test for continuous variables and the χ2 test for nominal variables. Correlation analysis (cognitive‑affective symptoms and somatic‑vegetative symptoms with HOMA‑IR, GGT, ALT, TG/HDL ratio, and visceral fat mass) were performed using the Spearman test with Bonferroni correction. Multiple linear regression analyses were used to evaluate the relationships between the presence of subclinical depressive symptoms and VAT, after adjusting for possible confounding variables, such as BMI, age, physical activity, smoking status, and daily alcohol consumption. The level of significance was set at P below 0.05.
Results
Clinical characteristics and body composition in the study groups
The groups did not differ in age, BMI, or waist and hip circumferences (all P >0.05) (Table 1). DXA analysis (Table 2) revealed no significant differences in total fat mass, arm and leg fat mass, android and gynoid fat mass, or total fat‑free mass. The women with subclinical depressive symptoms had higher VAT mass than those in the control group (P = 0.03). The study groups did not differ significantly in terms of physical activity, smoking, and alcohol consumption.
Characteristics | Women with subclinical depressive symptoms (n = 68) | Control group (n = 182) | P value |
Data are presented as median (interquartile range) or number (percentage) of patients. P values were derived from the Mann–Whitney test or the χ2 test.
a P <0.05
Abbreviations: BDI, Beck Depression Inventory; BMI, body mass index | |||
BDI, points | 13.0 (11–16) | 4.0 (2.0–6.0) | <0.001a |
Age, y | 49.5 (40.5–61.0) | 45.0 (38.0–56.0) | 0.06 |
Postmenopause | 34 (50) | 70 (38.5) | 0.10 |
BMI, kg/m2 | 24.7 (22.3–29.7) | 24.7 (22.2–28.5) | 0.59 |
Overweight / obesity | 32 (47.1) | 85 (46.7) | 0.96 |
Waist circumference, cm | 89.1 (78.5–102.6) | 87.9 (80.4–97.0) | 0.79 |
Hip circumference, cm | 96.5 (91.9–103.2) | 96.2 (92.6–102.1) | 0.87 |
Smoking, pack‑years | 11.1 (2.5–15.0) | 12.7 (1.5–18.7) | 0.87 |
Current or ex‑smoker | 29 (42.6) | 78 (42.8) | 0.98 |
Not drinking alcohol | 30 (44.1) | 62 (34.1) | 0.19 |
<20 g alcohol/day | 38 (55.9) | 116 (63.7) | |
>20 g alcohol/day | 0 | 4 (2.2) | |
Physical activity <1 h/week | 42 (61.8) | 117 (64.3) | 0.65 |
Physical activity 1–5 h/week | 21 (30.9) | 47 (25.8) | |
Physical activity >5 h/week | 5 (7.3) | 18 (9.9) | |
Body part mass, kg | Women with subclinical depressive symptoms (n = 68) | Control group (n = 182) | P value |
Data are presented as median (interquartile range). P values were derived from the Mann–Whitney test.
a P <0.05
Abbreviations: VAT, visceral adipose tissue | |||
Total fat | 24.6 (18.7–33.6) | 24.0 (19.6–30.3) | 0.67 |
Total fat‑free | 40.5 (37.6–44.6) | 41.4 (38.2–45.0) | 0.34 |
Trunk fat | 13.0 (9.2–18.1) | 12.2 (9.2–16.2) | 0.28 |
Arm fat | 2.8 (2.2–3.6) | 2.6 (2.2–3.2) | 0.37 |
Arm fat‑free | 4.2 (3.7–4.8) | 4.2 (3.7–4.7) | 0.97 |
Leg fat | 8.2 (6.1–10.4) | 8.3 (6.7–10.8) | 0.30 |
Leg fat‑free | 14.4 (12.5–15.7) | 14.5 (12.9–16.1) | 0.29 |
Android fat | 2.0 (1.4–3.0) | 1.9 (1.3–2.7) | 0.23 |
Gynoid fat | 4.4 (3.2–5.4) | 4.2 (3.5–5.1) | 0.72 |
VAT | 0.7 (0.4–1.3) | 0.5 (0.3–1.0) | 0.03a |
Surrogate markers of insulin resistance in the study groups
In the women with subclinical depressive symptoms, HOMA‑IR and ALT activity were higher than in the control group (P = 0.04 for both parameters) (Table 3).
Characteristics | Women with subclinical depressive symptoms (n = 68) | Control group (n = 182) | P value |
Data are presented as median (interquartile range). P values were derived from the Mann–Whitney test.
a P <0.05
SI conversion factors: to convert total cholesterol, LDL‑C, and HDL‑C to mmol/l, multiply by 0.0259; to convert TG to mmol/l, multiply by 0.0114.
Abbreviations: ALT, alanine aminotransferase; AST, aspartate aminotransferase; GGT, gamma glutamyltransferase; HDL‑C, high‑density lipoprotein cholesterol; HOMA‑IR, Homeostatic Model Assessment for Insulin Resistance; LDL‑C, low‑density lipoprotein cholesterol; OGTT, oral glucose tolerance test; TG, triglyceride | |||
Glucose 0 h OGTT, mg/dl | 98.0 (94.0–105.0) | 95.0 (90.0–102.0) | 0.03a |
Glucose 1 h OGTT, mg/dl | 141.0 (119.0–170.0) | 136.0 (108.0–162.0) | 0.12 |
Glucose 2 h OGTT, mg/dl | 119.0 (104.0–143.0) | 117.0 (103–135.0) | 0.49 |
Insulin 0 h OGTT, μIU/ml | 10.1 (8.0–14.2) | 9.4 (6.7–12.7) | 0.09 |
Insulin 1 h OGTT, μIU/ml | 62.9 (48.2–95.9) | 64.2 (39.6–92.5) | 0.56 |
Insulin 2 h OGTT, μIU/ml | 53.8 (33.1–74.2) | 44.8 (31.6–63.1) | 0.21 |
HOMA‑IR | 2.5 (1.8–3.6) | 2.2 (1.5–3.1) | 0.04a |
C‑peptide 0 h, ng/ml | 2.2 (1.8–2.9) | 2.1 (1.7–2.5) | 0.06 |
C‑peptide 1 h, ng/ml | 9.0 (7.0–10.5) | 8.7 (6.9–10.8) | 0.67 |
C‑peptide 2 h, ng/ml | 8.1 (6.6–11.1) | 8.1 (6.3–10.7) | 0.63 |
Glycated hemoglobin, % | 5.4 (5.2–5.7) | 5.3 (5.1–5.6) | 0.23 |
Cortisol, μg/dl | 12.3 (9.5–15.0) | 11.4 (9.1–14.9) | 0.39 |
Total cholesterol, mg/dl | 189.0 (162.0–205.0) | 186.0 (164.0–210.0) | 0.85 |
TG, mg/dl | 83.0 (61.0–125.0) | 77.0 (59.0–105.0) | 0.11 |
HDL‑C, mg/dl | 66.5 (61.2–74.0) | 66.5 (57.0–74.4) | 0.93 |
TG/HDL‑C | 1.3 (0.8–2.0) | 1.2 (0.8–1.7) | 0.15 |
LDL‑C, mg/dl | 114.7 (94.9–139.9) | 119.1 (98.4–141.3) | 0.47 |
GGT, IU/l | 14.2 (9.2–20.6) | 11.7 (9.5–16.1) | 0.19 |
AST, IU/l | 19.4 (17.4–23.0) | 19.1 (16.4–22.7) | 0.21 |
ALT, IU/l | 18.9 (13.3–22.5) | 16.3 (12.5–20.6) | 0.04a |
Relationships between insulin resistance markers and the severity of cognitive‑affective symptoms and somatic‑vegetative symptoms
In the group of women with subclinical depressive symptoms, we observed a positive correlation between the severity of somatic‑vegetative symptoms and VAT mass (R = 0.51, P = 0.001), HOMA‑IR (R = 0.40, P = 0.04), and GGT (R = 0.44, P = 0.004).
Prevalence of dysglycemia in the study groups
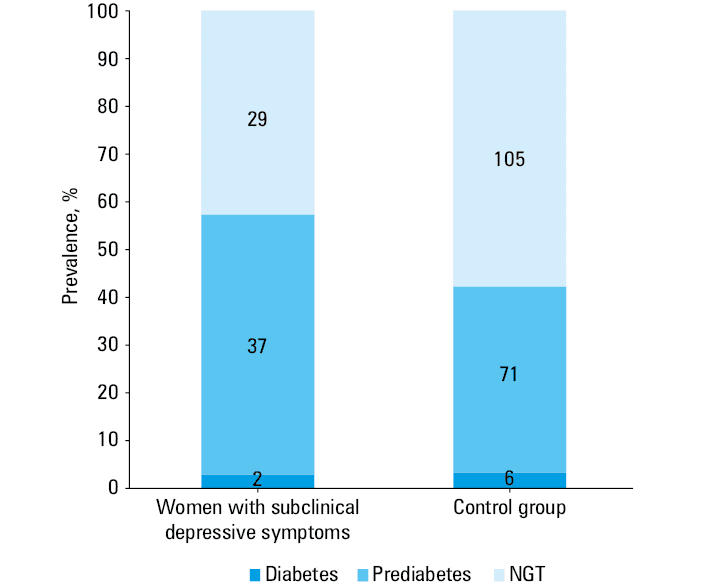
Disturbances in glucose metabolism diagnosed on the basis of OGTT and glycated hemoglobin levels were more prevalent in the group with subclinical depressive symptoms than in the control group (57.3% vs 42.3%, P = 0.03) ((Figure 2). New‑onset diabetes was present in 2.9% and prediabetes in 54.4% of the women with subclinical depressive symptoms, as compared with 3.3% and 39% in the control group (P = 0.09).
Comparison of the body composition and insulin resistance markers in the subgroup of postmenopausal women
VAT mass, HOMA‑IR, TG/HDL ratio, GGT, and ALT activity were higher in the postmenopausal women with subclinical depressive symptoms in comparison with the postmenopausal women without subclinical depressive symptoms (P = 0.02, P = 0.008, P = 0.046, P = 0.01, P = 0.04, respectively) (Table 4).
Characteristics | Postmenopausal women with subclinical depressive symptoms (n = 34) | Postmenopausal women without subclinical depressive symptoms (n = 70) | P value |
Data are presented as median (interquartile range). P values were derived from the Mann–Whitney test.
a P <0.05
| |||
Age, y | 61.0 (56.0–64.0) | 59.0 (53.0–62.0) | 0.05 |
BMI, kg/m2 | 27.3 (23.2–31.5) | 25.8 (23.4–29.9) | 0.44 |
HOMA‑IR | 3.2 (2.3–4.3) | 2.3 (1.8–3.1) | 0.008a |
Total cholesterol, mg/dl | 199.0 (166.0–214.0) | 203.0 (180.0–223.0) | 0.25 |
TG, mg/dl | 113.0 (80.0–139.0) | 93.0 (76.0–114.0) | 0.07 |
HDL‑C, mg/dl | 63.6 (54.0–70.9) | 66.4 (57.1–74.4) | 0.34 |
TG/HDL‑C | 1.8 (1.3–2.6) | 1.5 (1.1–2.0) | 0.046a |
LDL‑C, mg/dl | 131.3 (95.3–144.8) | 129.7 (111.4–149.9) | 0.46 |
GGT, IU/l | 16.6 (14.0–26.0) | 14.5 (11.0–20.8) | 0.01a |
AST, IU/l | 21.5 (19.0–25.8) | 21.3 (18.5–24.8) | 0.74 |
ALT, IU/l | 20.4 (16.5–26.3) | 18.3 (13.8–22.5) | 0.04a |
Total fat mass, kg | 27.9 (21.6–35.8) | 27.2 (21.3–33.0) | 0.94 |
Total fat‑free mass, kg | 40.5 (37.8–43.0) | 41.0 (37.6–43.4) | 0.87 |
Trunk fat mass, kg | 15.7 (11.7–20.3) | 14.3 (10.7–18.7) | 0.37 |
Arm fat mass, kg | 2.9 (2.5–4.0) | 3.0 (2.5–3.7) | 0.69 |
Arm fat‑free mass, kg | 4.3 (3.8–4.8) | 4.2 (3.7–4.6) | 0.34 |
Leg fat mass, kg | 8.2 (6.1–10.5) | 8.7 (7.1–12.1) | 0.13 |
Leg fat‑free mass, kg | 14.0 (12.5–15.5) | 14.3 (12.9–15.5) | 0.41 |
Android fat mass, kg | 2.5 (1.8–3.3) | 2.4 (1.7–3.0) | 0.28 |
Gynoid fat mass, kg | 4.6 (3.4–5.7) | 4.4 (3.7–5.4) | 0.63 |
VAT, kg | 1.1 (0.7–1.5) | 0.8 (0.4–1.4) | 0.02a |
Multiple linear regression analysis of VAT
Multiple linear regression analysis showed that the presence of subclinical depressive symptoms was associated with significantly higher VAT mass after adjusting for possible confounding variables (age, BMI, physical activity, smoking status, and daily alcohol consumption) (Table 5).
Variable | β | SE | P value |
R2 = 0.752
β, regression standardized coefficient
The values were assessed with multiple linear regression.
a P <0.05
Abbreviations: see Table 1 | |||
Age, y | 11.440 | 1.762 | <0.001a |
BMI, kg/m2 | 92.452 | 4.199 | <0.001a |
Physical activity, activity level (<1 h/week, 1–5 h/week, >5 h/week) | 5.537 | 29.078 | 0.85 |
Smoking, yes vs no | 81.988 | 39.587 | 0.04a |
Alcohol consumption, intake level (not drinking alcohol, <20 g alcohol / day, >20 g alcohol / day) | 13.604 | 37.892 | 0.72 |
Subclinical depressive symptoms, yes vs no | 102.348 | 43.066 | 0.02a |
Comparison of the body composition, insulin resistance markers, and the prevalence of dysglycemia in the group of women with clinical depression
Only 11 women scored above 20 points on the BDI, which could indicate clinical depression. We excluded this group from the main analysis due to the small sample size but the results are worth mentioning. The group of women with clinical depression did not differ in age, BMI, or waist and hip circumferences (all P >0.05) from the group of women with subclinical depression and the control group. The women with clinical depressive symptoms had significantly higher VAT mass and fasting glucose as compared with the subclinical depressive symptoms and control groups: median (interquartile range), 0.8 (0.3–1.5) kg vs 0.7 (0.4–1.3) kg vs 0.5 (0.3–1.0) kg, P = 0.05, and 103 (94.0–110.0) mg/dl vs 98.0 (94.0–105.0) mg/dl vs 95.0 (90.0–102.0) mg/dl, P = 0.05, respectively. Dysglycemia was recognized in 54.5% of the women with clinical depression, as compared with 57.3% in the group of women with subclinical depressive symptoms, and 42.3% in the control group (P = 0.09). We diagnosed prediabetes in 6 women and normal glucose tolerance in 5 women in the group with clinical depression.
Discussion
The main finding of our study was that women with subclinical depressive symptoms were characterized by significantly greater VAT mass, bigger values of HOMA‑IR and ALT, and thus a higher incidence of prediabetes as compared with the control group. Additionally, the relationship between the indices of insulin resistance, and the intensity of somatic‑vegetative and cognitive‑affective symptoms in the women with subclinical depressive symptoms was assessed for the first time. We observed a significant positive correlation between the severity of somatic‑vegetative symptoms in BDI and VAT mass, HOMA‑IR, and GGT activity in the women with subclinical depressive symptoms from the population‑based cohort study.
We compared the results obtained in the group of women with subclinical depressive symptoms with the published results of studies focusing on individuals with clinical depression or with depressive symptoms. Lee et al34 showed that depressive mood is associated with increased VAT mass but not with subcutaneous adipose tissue mass. However, only overweight individuals (those with already increased visceral fat volumes) were included in the abovementioned study, while we also examined women with normal BMI. Everson‑Rose et al35 examined middle‑aged women and demonstrated that visceral fat volume was higher in women with depression, particularly in overweight and obese ones. The results of a study by Cho et al17 also support the finding that depressive symptoms are associated with higher VAT mass. Murabito et al36 observed that exacerbation of depressive symptoms is strongly associated with increased VAT volume, mostly in peri- and postmenopausal women. Everson‑Rose et al35 reported similar observations. The present study revealed a significant positive correlation between somatic‑vegetative depressive symptoms and VAT mass in the women with subclinical depressive symptoms. In a previous study by other authors,37 total fat mass and abdominal adiposity were associated with depressive symptoms, and this association was found to be the strongest with neurovegetative symptoms of depression (mainly with hyperphagia and fatigability). Furthermore, Guedes et al38 investigated individuals with the metabolic syndrome and showed a significant inverse correlation between total lean mass and severity of depressive symptoms. The authors suggested that physical activity might be a confounding variable in the relationship between depressive symptoms and body composition. In our study, the groups did not differ in terms of physical activity and fat‑free mass. It is also worth highlighting that VAT mass was significantly higher in the women with subclinical depressive symptoms despite the fact that the groups did not differ in BMI, waist, or hip circumference.
Furthermore, we found a difference in VAT mass in the subgroup of postmenopausal women between the women with and without subclinical depressive symptoms. Our observation expands on previous findings of Xiong et al,39 as our study included a new group of patients, that is, those with subclinical depressive symptoms. Xiong et al39 demonstrated that postmenopausal women with depressive symptoms had elevated VAT values as compared with women without depressive symptoms.39
The relationship between depressive symptoms and visceral fat may be associated with several potential mechanisms, including HPA dysregulation and hypercortisolemia, hormonal milieu, the role of adipose tissue as an endocrine organ, inflammation, stress in utero, childhood adversity, and trauma. In people with depressive symptoms, dysregulation of the HPA axis is observed. The receptors for glucocorticoids are more abundant in visceral than in subcutaneous tissue.20,21 Postmenopausal women with depressive symptoms are characterized by greater HPA axis dysregulation.28 However, in our study, morning cortisol concentrations did not differ significantly between the study groups. In overweight and obese people, cortisol measurement is problematic, since cortisol levels demonstrate a U‑shaped relationship with visceral and total fat mass,40 which might explain the lack of difference in the present analysis. Moreover, mood disorders are mostly associated with flattening of the diurnal cortisol curve (high cortisol levels in the evening).11 Additionally, peripheral hypercortisolemia can be present in depression, which can be related to 11β-hydroxysteroid dehydrogenase type 1 activity.21,41 Menopause is significantly associated with changes in the hormonal milieu. Increased fat distribution, especially VAT, is connected with sex hormone levels (high bioavailable testosterone and high androgen to estradiol ratio).29 Adipose tissue is a large endocrine organ in the body, which can synthesize and release numerous metabolic products. The 2 fat depots (subcutaneous and visceral fat) may have different intensity of metabolic activity. Increased visceral fat is connected with adipocyte hypertrophy and hyperplasia, low grade systemic inflammation, and altered secretion of adipokines. According to the literature, proinflammatory markers may contribute to the development of depression.20,21,42 The genetic variants that increase immune response are frequent in patients with mood disorders.20 Adults with a history of childhood trauma or children of mothers experiencing stress during pregnancy have increased levels of inflammation markers and are at a high risk of HPA axis functional disturbance and later psychopathology.20,43
The association between insulin resistance and depressive disorders is bidirectional. Impaired insulin signaling in the brain may be responsible for depressive‑like symptoms. The proposed mechanism related to the onset of depression in patients with insulin resistance is enhanced production of proinflammatory markers, which could activate several stress kinases in the brain. Consequently, this may lead to phosphorylation of insulin receptor substrate‑1 on serine residues, thus impacting insulin signaling response, which can impair hippocampal neurogenesis and synaptic plasticity, HPA axis dysregulation, and can affect the reward system.43 Speed et al12 used Mendelian randomization in the analysis of genome‑wide association study results from the UK Biobank and the Psychiatric Genomics Consortium, and showed that depressive symptoms are related to fat mass.
In our study, HOMA‑IR was significantly higher in the women with subclinical depressive symptoms. In their meta‑analysis, Kan et al24 reported a positive association between severity of depressive symptoms and insulin resistance assessed by HOMA‑IR. The excess of visceral fat can indirectly impair insulin action in target organs as well as in the liver. In postmenopausal women, we observed higher TG/HDL‑C ratios in comparison with the control group. Visceral fat is strongly associated with impaired suppression of free fatty acids (FFA), high levels of FFA in the liver, impaired carbohydrate oxidation, increased production of triglyceride‑rich lipoproteins, and decreased HDL‑C levels.26 Depression is related to higher TG and lower HDL‑C concentrations.44 Previous studies demonstrated that increased visceral fat is a marker of increased ectopic fat in other sites, such as the liver.16 ALT and GGT have been used as surrogate markers for liver fat accumulation, systemic and hepatic insulin resistance, metabolic syndrome, type 2 diabetes, cardiovascular disease, and all‑cause mortality.27 In the present study, in the group of women with subclinical depressive symptoms, ALT was higher than in the control group. Moreover, in the postmenopausal women, GGT was higher in the subgroup of women with subclinical depressive symptoms than in the control group. These liver markers are associated with increased hepatic glucose production, fasting glycemia and fasting glucagon levels, increased insulin secretion, decreased hepatic insulin clearance, and oxidative stress.27 In a previous study,45 elevated ALT was associated with the development of depressive symptoms.
In our study, somatic‑vegetative symptoms positively correlated with HOMA‑IR and GGT activity. Austin et al46 demonstrated that somatic depressive symptoms are more strongly associated with HOMA‑IR than cognitive depressive symptoms. Khambaty et al47 analyzed a 6‑year change in HOMA‑IR in individuals aged 50–70 years. The analysis revealed that baseline somatic symptoms, but not cognitive symptoms, predicted a 6‑year increase in insulin resistance. People with somatic‑vegetative depressive symptoms tend to demonstrate poor health behaviors, for example, high dietary fat and carbohydrate intake, smoking, physical inactivity.11 As lifestyle‑related factors are associated with nonalcoholic fatty liver disease, hepatic steatosis is also related to depression.48
In our study, dysglycemia occurred more frequently in the women with subclinical depressive symptoms than in the control group. In a study by Chen et al,49 prediabetes was significantly associated with the risk of depression among the study population with a mean age below 60 years. The prevalence of dysglycemia is constantly increasing.50 The combination of prediabetes and depressive symptoms is associated with an increased risk of developing diabetes.43
There are several limitations to the present study. The main limitation is a small sample size. Additionally, we used a self‑reported scale to define subclinical depressive symptoms, and did not perform a comprehensive psychiatric evaluation. Moreover, the literature provides different definitions of subclinical depressive symptoms, and it is therefore difficult to choose a universal cutoff point. According to the study design, all the procedures and blood tests were performed during a single meeting, and therefore only 1 fasting glucose measurement was obtained. Diabetes was diagnosed in patients with glucose level equal to or above 200 mg/dl at 2 h of OGTT or glycated hemoglobin equal to or above 6.5%.
In conclusion, women with subclinical depressive symptoms could have an increased risk of developing dysglycemia in comparison with women without subclinical depressive symptoms, which might be related to increased VAT mass. Further research is needed to investigate whether subclinical depressive symptoms can predispose to dysglycemia and to identify the mechanism through which subclinical depressive symptoms contribute to increased visceral adiposity.
- Egede LE, Ellis C. Diabetes and depression: global perspectives. Diabetes Res Clin Pract. 2010; 87: 302‑312. | Crossref
- Depression and Other Common Mental Disorders: Global Health Estimates. Geneva: World Health Organization; 2017. Licence: CC BY‑NC‑SA 3.0 IGO. https://apps.who.int/iris/bitstream/handle/10665/254610/WHO‑MSD‑MER‑2017.2‑eng.pdf. Accessed May 2022
- Ayuso‑Mateos J, Nuevo R, Verdes E, et al. From depressive symptoms to depressive disorders: the relevance of thresholds. Br J Psychiatry. 2010; 196: 365‑371. | Crossref
- Chen X, Zhang X, Zhu X, Wang G. Efficacy of an Internet‑based intervention for subclinical depression (MoodBox) in China: study protocol for a randomized controlled trial. Front Psychiatry. 2021; 11: 585920. | Crossref
- Hermanns N, Schmitt A, Gahr A, et al. The effect of a Diabetes‑Specific Cognitive Behavioral Treatment Program (DIAMOS) for patients with diabetes and subclinical depression: results of a randomized controlled trial. Diabetes Care. 2015; 38: 551‑560. | Crossref
ARTICLE INFORMATION