Dynamic changes in soluble suppression of tumorigenicity 2 levels predict major adverse cardiovascular events in patients with ST-segment elevation myocardial infarction
Key words: major adverse cardiovascular events, primary percutaneous coronary intervention, soluble suppression of tumorigenicity 2, ST-segment elevation myocardial infarction


 CC BY-NC-SA 4.0
Dynamic changes in soluble suppression of tumorigenicity 2 levels predict major adverse cardiovascular events in patients with ST-segment elevation myocardial infarction
Introduction: The predictive value of soluble suppression of tumorigenicity 2 (sST2) for the occurrence of major adverse cardiovascular events (MACEs) in patients with ST‑segment elevation myocardial infarction (STEMI) remains unclear.
Objectives: We aimed to investigate the role of sST2 in predicting MACEs in STEMI patients after primary percutaneous coronary intervention (pPCI).
Patients and methods: A total of 350 patients were enrolled in this study. The levels of sST2, N‑terminal pro–B‑type natriuretic peptide (NT‑proBNP), cardiac troponin I (TnI), and creatine kinase–MB (CK‑MB) were measured on admission as well as 24 hours and 5 days after pPCI. The end point was the incidence of MACEs.
Results: Compared with the values on admission, sST2 levels increased 24 hours post pPCI and decreased significantly at day 5 after the procedure in the whole cohort. The pattern of sST2 level changes between the 3 time points was similar in the MACE and MACE‑free groups. Notably, the change in the sST2 level from admission to 24 hours post pPCI (∆1sST2) was significantly higher in the MACE group. After multivariable adjustment, ∆1sST2 was an independent risk factor for MACEs, with an area under the curve of 0.621 (95% CI, 0.547–0.695). Patients with a greater ∆1sST2 had a significantly higher incidence of composite MACEs, coronary revascularization, and cardiac rehospitalization. However, the change in sST2 levels from admission to 5 days post pPCI, as well as the dynamic changes in NT‑proBNP, TnI, and CK‑MB levels had no predictive value.
Conclusions: The increase in plasma sST2 levels from admission to 24 hours post pPCI has a potential value for independently predicting the incidence of coronary revascularization and cardiac rehospitalization at 1 year in patients with STEMI.
What's new?
In this prospective cohort study involving 350 patients with ST‑segment elevation myocardial infarction (STEMI), we found plasma levels of soluble suppression of tumorigenicity 2 (sST2) significantly increased 24 hours after primary percutaneous coronary intervention (pPCI) and then decreased at day 5 post pPCI. The pattern of dynamic changes in sST2 levels was similar to that observed for cardiac biomarkers. Notably, sST2 had a potential predictive value superior to that of the traditional biomarkers, including N‑terminal pro–B‑type natriuretic peptide, troponin I, and creatine kinase–MB. The increase in sST2 levels from admission to 24 hours post pPCI independently predicted 1‑year major adverse cardiovascular events (MACEs), especially coronary revascularization and cardiac rehospitalization. Clinical implications of the present study are as follows: (1) serial measurement of plasma sST2 levels can provide additional prognostic information in STEMI patients undergoing pPCI; and (2) mitigating sST2 level elevation as a therapeutic target may help reduce the rates of post‑pPCI MACEs and thereby improve clinical outcomes.
Introduction
Acute ST‑segment elevation myocardial infarction (STEMI) is significantly associated with both short and long‑term health complications and simultaneously increases the risk of post‑myocardial infarction (MI) ventricular remodeling and heart failure (HF).1,2 Consequently, patients with STEMI are at a higher risk of major adverse cardiovascular events (MACEs) during the post‑MI period, despite undergoing primary percutaneous coronary intervention (pPCI).3,4 Although troponin and creatine kinase levels reflect the extent of myocardial damage, these biomarkers are not sensitive enough to predict the risk of MACEs.5,6 New tools for early and accurate diagnosis of MACEs, as well as prediction of risk, are critical for optimizing therapeutic strategies. Previous studies showed that using biological markers can improve diagnostic accuracy in cardiovascular patients.4,7
Soluble suppression of tumorigenicity 2 (sST2) is a member of the interleukin (IL) 1 receptor family with transmembrane (ST2L) and soluble isoforms (sST2). IL‑33 is the functional ligand for ST2L. The IL‑33/ST2L signaling leads to transcriptional activation of inflammatory genes, thereby triggering cytokine / chemokine storms and a T‑helper type 2 (Th2) immune response, which in turn exert immunomodulatory and protective effects on the heart to inhibit adverse cardiac remodeling and fibrosis.7,8 Both endogenous and exogenous stressors can stimulate peripheral blood mononuclear cells to secrete inflammatory cytokines, which can then relay the activation signal to the lung epithelial cells and cardiac myocytes to increase the sST2 production. sST2 plays a role of a decoy receptor sequestering free IL‑33 to inhibit the ST2/IL‑33 immune signaling. sST2 also participates in the regulation of extracellular matrix remodeling and inflammation, associated with arrhythmia and other MACEs.9-11 Novel biomarkers, such as sST2, have recently emerged as potentially useful tools for diagnosing cardiovascular diseases.12 However, because of the small sample size and / or poor assay sensitivity in previous studies, the predictive value of sST2, especially in terms of the changes in the level of this protein, for short- and long‑term MACEs in patients with STEMI following pPCI remains unclear.
Therefore, we sought to evaluate dynamic changes in plasma levels of sST2 in 350 STEMI patients undergoing pPCI and assess the relationship between these levels and the incidences of MACEs during 1‑year follow‑up.
Patients and methods
Study population
The study participants were identified using the database of the Cardiovascular Center of Beijing Friendship Hospital. As shown in Figure 1, medical records of 481 STEMI inpatients, who were admitted within 6 hours of symptom onset and underwent pPCI between February 2017 and April 2020, were retrospectively reviewed. Finally, a total of 350 patients were included in this study (Supplementary material, Figure S1). Exclusion criteria were as follows: 1) severe renal dysfunctions (estimated glomerular filtration rate [eGFR] <30 ml/min/1.73 m2), 2) severe liver diseases, 3) acute infectious diseases or rheumatic diseases, 4) existing neoplastic diseases, 5) estimated life expectancy below 1 year, and 6) lack of complete clinical or follow‑up data. The enrolled patients were divided into 2 groups: the MACE group (STEMI patients with MACEs during the follow‑up) and the MACE‑free group (STEMI patients without MACEs during the follow‑up), and were followed for up to 1‑year by outpatient care or teleconsultation.
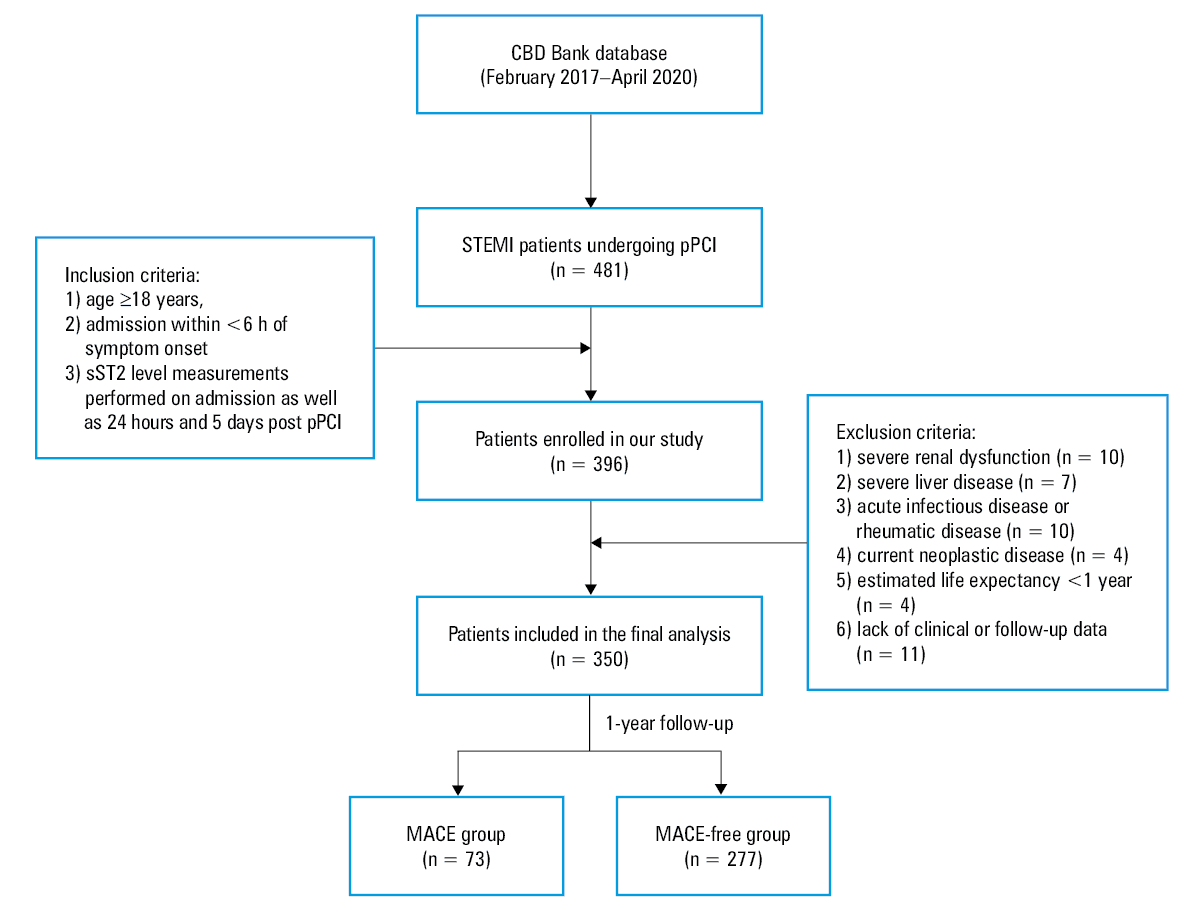
Abbreviations: CBD Bank, Cardiovascular Center of Beijing Friendship Hospital Data Bank; MACEs, major adverse cardiovascular events; pPCI, primary percutaneous coronary intervention, sST2, soluble suppression of tumorigenicity 2; STEMI, ST‑segment elevation myocardial infarction
The data collection procedure was approved by the Institutional Review Board of the Beijing Friendship Hospital, affiliated with the Capital Medical University (2021‑P2‑107‑02). All patients signed a written informed consent to participate in this study. The study protocol was compliant with the principles outlined in the Declaration of Helsinki.
Data collection and definitions
The patients’ demographic information, medical and medication history, and laboratory measurements were collected and confirmed through electronic medical records. Subsequent outcomes of MACE treatments were collected and recorded up to 1 year during the follow‑up visits to an outpatient clinic or telephone consultations.
Cardiac troponin I (TnI) and creatine kinase–MB (CK‑MB) levels were measured with the sandwich electrochemiluminescence immunoassay at the Department of Laboratory Medicine. We measured the serum levels of N‑terminal pro–B‑type natriuretic peptide (NT‑proBNP) on admission (baseline) and assessed the peak value during hospital stay with the solid‑phase chromatographic immunoassay. The high‑sensitivity C‑reactive protein (hsCRP) level was measured with the particle‑enhanced immunonephelometric assay.
Transthoracic echocardiography was performed within 48 hours of admission at the Department of Echocardiography Laboratory using a Philips Ultrasound machine (Philips Medical Systems, Andover, Massachusetts, United States). Left ventricular ejection fraction (LVEF) was assessed by modified biplane Simpson’s rule. Other assessed parameters included left ventricular end‑diastolic dimension (LVEDD) and left ventricular end‑systolic dimension (LVESD). To compare the left ventricular end‑diastolic volume (LVEDV) and left ventricular end‑systolic volume (LVESV) in different body sizes, they were indexed to the body surface area (left ventricular end‑diastolic volume index [LVEDVI] and left ventricular end‑systolic volume index [LVESVI]).
STEMI diagnosis was confirmed based on the following criteria recommended by the European Society of Cardiology13: 1) chest pain lasting for more than 30 minutes; 2) presence of ST‑segment elevation on dynamic electrocardiography, measured at the J‑point at least in 2 contiguous leads, with an elevation of 2.5 mm in men below 40 years of age, 2 mm in men aged 40 years or older, or 1.5 mm in women in leads V2–V3 and / or 1 mm in other leads in the absence of left ventricular hypertrophy or left bundle branch block; 3) elevated levels of serum markers of myocardial injury, and 4) no contraindications to PCI of the infarct‑affected artery identified on coronary angiography. MACEs included cardiac death, nonfatal MI, coronary revascularization, and cardiac rehospitalization. Cardiac death was defined as fatal MI and heart failure (HF), sudden death, and other cardiac deaths. Nonfatal MI was defined as chest pain with new ST‑segment changes and elevation of myocardial necrosis markers to at least twice the upper limit of normal. Coronary revascularization was defined as revascularization of the target vessel or nontarget vessels that was necessary due to the symptoms of myocardial ischemia and diagnosis of unstable angina pectoris or acute MI. Cardiac rehospitalization referred to rehospitalization of patients for angina pectoris or HF. HF comprised acute HF and acute exacerbation of chronic HF.
Coronary angiography and percutaneous coronary intervention
Patients with STEMI underwent coronary angiography immediately after admission to the Beijing Friendship Hospital. The examinations were performed by cardiologists in the catheter laboratory, using a digital subtraction machine to revascularize the MI‑affected coronary artery. Moreover, 2 interventional cardiologists assessed the severity of stenosis of the coronary artery using the double‑blind method.
Enzyme‑linked immunosorbent assay
Blood samples were obtained on admission to the hospital (baseline) as well as 24 hours and 5 days after pPCI and were anticoagulated with ethylenediaminetetraacetic acid. The samples were centrifuged, and the plasma was stored at −80 °C until further analysis. The sST2 plasma concentration was measured using the enzyme‑linked immunosorbent assay (ELISA; DST200, R&D Systems, Inc., P299891, Minneapolis, Minnesota, United States). A microplate reader was used to determine the optical density (OD) of each sample at 450 nm. Linear regression analysis was performed for the standard curve generation according to standard OD values. Calibration and standardization of this assay were performed according to the manufacturer’s protocol. Previous reports documented the intra- and inter‑assay coefficients of variation below 2.5% and below 4.0%, respectively.
Statistical analysis
Depending on the distribution of the data, continuous variables were expressed as mean (SD) or median and interquartile range (IQR). Frequencies and percentages were used to describe categorical data. Differences between the study groups for continuous and categorical variables were assessed using the t test, analysis of variance (ANOVA), the χ2 test, and the Mann–Whitney test, as appropriate. The Friedman test was used to analyze the differences in sST2 levels at individual time points. Multivariable Cox regression analysis was performed to analyze the independent risk factors for MACEs in STEMI patients after pPCI. The Spearman correlation coefficient was used to assess the correlation between biomarker values and other continuous variables. The receiver operating characteristics (ROC) curve was plotted to evaluate the potential role of sST2 in predicting MACEs during 1‑year follow‑up. The cutoff value was defined for the maximum Youden index. The cumulative hazard of 1‑year MACEs was estimated by the Kaplan–Meier method, and the groups were compared using the log‑rank test. All analyses were 2‑tailed, and a P value below 0.05 was considered significant. The data were analyzed using SPSS statistical package, version 23.0 (SPSS Inc., Chicago, Illinois, United States).
Results
Baseline characteristics of patients with ST‑segment elevation myocardial infarction in the groups with and without major adverse cardiovascular events
MACEs occurred in 20.9% of the enrolled patients during the 1‑year follow‑up. As shown in Table 1, the participants were divided into MACE (n = 73) and MACE‑free (n = 277) groups. The demographic, clinical, laboratory, echocardiographic, and angiographic characteristics were compared between the 2 groups.
Parameter | Total (n = 350) | MACE (n = 73) | MACE‑free (n = 277) | P value |
Data are presented as mean (SD) or median (interquartile range) unless indicated otherwise.
Δ1CK‑MB was calculated as the level assessed 24 hours after pPCI minus the admission level of CK‑MB; Δ2CK‑MB was calculated as the level at day 5 after pPCI minus the admission level of CK‑MB.
Δ1TnI was calculated as the level assessed 24 hours after pPCI minus the admission level of TnI; Δ2TnI was calculated as the level assessed at day 5 after pPCI minus the admission level of TnI.
Δ1NT‑proBNP was calculated as the level assessed 24 hours after pPCI minus the admission level of NT‑proBNP; Δ2NT‑proBNP was calculated as the level assessed at day 5 after pPCI level minus the admission level of NT‑proBNP.
a P <0.05 vs the MACE‑free group
Abbreviations: ACEI, angiotensin‑converting enzyme inhibitor; ARB, angiotensin II receptor blocker; BMI, body mass index; CHD, coronary heart disease; DBP, diastolic blood pressure; eGFR, estimated glomerular filtration rate; FBG, fasting blood glucose; HDL‑C, high‑density lipoprotein cholesterol; hsCRP, high‑sensitivity C‑reactive protein; LDL‑C, low‑density lipoprotein cholesterol; LM, left main trunk; LVEDD, left ventricular end‑diastolic dimension; LVEDVI, left ventricular end‑diastolic volume index; LVEF, left ventricular ejection fraction; LVESD, left ventricular end‑systolic dimension; LVESDVI, left ventricular end‑systolic volume index; MI, myocardial infarction; MRA, mineralocorticoid receptor antagonist; OMI, old myocardial infarction; pPCI, primary percutaneous coronary intervention; pCK‑MB, peak value of creatine kinase isoenzyme‑MB; pNT‑proBNP, peak value of N‑terminal pro‑B‑type natriuretic peptide; pTnI, peak value of troponin I; SBP, systolic blood pressure; TC, total cholesterol; TG, triglyceride; WBC, white blood cell count; others, see Figure 1 | ||||
Male sex, n (%) | 264 (75.4) | 50 (68.5) | 214 (77.3) | 0.12 |
Age, y | 62 (55–70) | 65 (59–72.5)a | 61 (53.5–69) | 0.005 |
BMI, kg/m2 | 25.5 (23.5–27.8) | 25.3 (23.4–28.2) | 25.6 (23.7–27.7) | 0.99 |
SBP, mm Hg | 125 (21.7) | 124.5 (22.5) | 125.1 (21.6) | 0.85 |
DBP, mm Hg | 73.5 (64–83) | 75 (64.5–84.5) | 72 (64–82.5) | 0.29 |
Heart rate, bpm | 74 (65–84) | 75 (65–89) | 72 (65–84) | 0.59 |
Anterior MI, n (%) | 177 (50.6) | 41 (56.2) | 136 (49.1) | 0.28 |
Killip class II–IV, n (%) | 91 (26) | 18 (24.7) | 73 (26.4) | 0.77 |
Medical history, n (%) | ||||
Hypertension | 225 (64.3) | 52 (71.2) | 173 (62.5) | 0.16 |
Diabetes mellitus | 123 (35.1) | 29 (39.7) | 94 (33.9) | 0.36 |
CHD | 70 (20) | 17 (23.3) | 53 (19.1) | 0.43 |
OMI | 64 (18.3) | 16 (21.9) | 48 (17.3) | 0.37 |
Revascularization | 50 (14.3) | 13 (17.8) | 37 (13.4) | 0.33 |
Current / ex‑smoker | 221 (63.1) | 53 (72.6) | 168 (60.6) | 0.06 |
Pharmacotherapy before admission, n (%) | ||||
Antiplatelet agent | 113 (32.3) | 23 (31.5) | 90 (32.5) | 0.87 |
ACEI/ARB | 79 (22.6) | 18 (24.7) | 61 (22) | 0.63 |
β-Blocker | 31 (8.9) | 4 (5.5) | 27 (9.7) | 0.25 |
Statin | 41 (11.7) | 14 (19.2)a | 27 (9.7) | 0.03 |
Laboratory investigations | ||||
WBC, × 109/l | 9.5 (7.7–12) | 9.2 (7.4–12.2) | 9.6 (7.9–12) | 0.51 |
Hemoglobin, g/l | 146 (134–158) | 142 (128–154)a | 149 (136–161) | 0.003 |
hsCRP, mg/l | 5.8 (2.4–15.5) | 6.8 (3.4–19.3) | 5.6 (2.2–13.8) | 0.12 |
Creatinine, μmol/l | 71 (60.9–84.7) | 69.3 (59.8–89.2) | 71.4 (61.3–84.2) | 0.85 |
eGFR, ml/min/1.73 m2 | 95.6 (71.6–117.8) | 86.2 (62–114.8) | 94.7 (72.5–118.5) | 0.06 |
FBG, mmol/l | 6.3 (5.5–8.4) | 6.5 (5.4–8.9) | 6.2 (5.5–8.2) | 0.52 |
TC, mmol/l | 4.6 (3.8–5.2) | 4.2 (3.4–5)a | 4.6 (3.9–5.3) | 0.007 |
TG, mmol/l | 1.4 (1.1–2) | 1.4 (1.1–2) | 1.4 (1.1–2) | 0.99 |
LDL‑C, mmol/l | 2.7 (2.2–3.2) | 2.4 (1.8–2.9)a | 2.7 (2.2–3.2) | 0.01 |
HDL‑C, mmol/l | 1 (0.9–1.2) | 1 (0.8–1.2) | 1 (0.9–1.2) | 0.05 |
Non–HDL‑C, mmol/l | 3.5 (2.8–4.2) | 3.2 (2.6–3.9)a | 3.6 (2.9–4.2) | 0.01 |
CK‑MB on admission, ng/ml | 5.5 (1.9–21.7) | 5.8 (1.9–21.8) | 5.1 (1.9–21.6) | 0.92 |
CK‑MB 24 h post pPCI, ng/ml | 91.4 (41.3–191.7) | 113.6 (46.2–218.2) | 90.8 (40.9–176.3) | 0.18 |
pCK‑MB, ng/ml | 127 (28.2–257) | 111 (15.2–258) | 135 (32.6–258.5) | 0.12 |
CK‑MB 5 days post pPCI, ng/ml | 1.5 (0.9–2.2) | 1.5 (0.5–2.1) | 1.5 (0.9–2.3) | 0.43 |
∆1CK‑MB, ng/ml | 72.1 (21.2–161.1) | 97.7 (26–187.3) | 67 (20.3–140.8) | 0.09 |
Δ2CK‑MB, ng/ml | –2.9 (–17.7 to –0.3) | –3.2 (–16.4 to –0.1) | –2.7 (–18.9 to –0.3) | 0.91 |
TnI on admission, ng/ml | 0.2 (0–1.8) | 0 (0.2–1.3) | 0 (0.2–2.1) | 0.50 |
TnI 24 h post pPCI, ng/ml | 15.7 (2.8–39.2) | 12.9 (1–39.3) | 16.3 (3.5–39.3) | 0.18 |
pTnI, ng/ml | 50 (21.8–50) | 50 (22–50) | 50 (21.5–50) | 0.75 |
TnI 5 days post pPCI, ng/ml | 1.8 (0.6–4.9) | 0.3 (1.5–4.7) | 0.6 (1.9–5) | 0.36 |
Δ1TnI, ng/ml | 9.2 (0–31.8) | 4.8 (0–26.6) | 10.4 (0–32.6) | 0.22 |
Δ2TnI, ng/ml | 0.6 (0–3.3) | 0.2 (–0.1 to 3.3) | 0.7 (0–3.4) | 0.38 |
NT‑proBNP on admission, pg/ml | 194 (79.1–680.5) | 275 (114–798) | 180.5 (73.9–620.3) | 0.14 |
NT‑proBNP 24 h post pPCI, pg/ml | 280.5 (105–818.3) | 79.8 (227–902.5) | 118 (300–805) | 0.29 |
pNT‑proBNP, pg/ml | 1391 (603.5–2794) | 1829 (846–3520.5)a | 1286.5 (581.3–2595.3) | 0.045 |
NT‑proBNP 5 days post pPCI, pg/ml | 685 (313–1431) | 833.5 (307.8–1513.3) | 655 (310–1414) | 0.46 |
Δ1NT‑proBNP, pg/ml | 47.39 (–292.1 to 534) | –458.9 (58.5–500) | –280.8 (46.9–574.5) | 0.87 |
Δ2NT‑proBNP, pg/ml | 264.7 (0–813) | 276.7 (–61.3 to 837.2) | 264.7 (0–807) | 0.90 |
Echocardiographic parameters | ||||
LVEDD, cm | 5.2 (4.9–5.4) | 5.2 (4.9–5.5) | 5.2 (4.9–5.4) | 0.80 |
LVESD, cm | 3.6 (3.3–3.9) | 3.6 (3.3–3.9) | 3.6 (3.3–3.9) | 0.69 |
LVEDVI, ml/m2 | 69.5 (62.6–78.4) | 70.1 (60.9–81.5) | 69.5 (62.8–78.2) | 0.92 |
LVESVI, ml/m2 | 29.5 (24.5–36.8) | 28.9 (23.7–37.4) | 29.9 (24.6–36.6) | 0.66 |
LVEF | 0.57 (0.51–0.62) | 0.58 (0.52–0.63) | 0.57 (0.50–0.62) | 0.61 |
LVEF <50%, n (%) | 85 (24.3) | 16 (21.9) | 69 (24.9) | 0.60 |
Angiographic parameters | ||||
LM, n (%) | 22 (6.3) | 6 (8.2) | 16 (5.8) | 0.44 |
Triple vessel, n (%) | 243 (69.4) | 51 (69.9) | 192 (69.3) | 0.93 |
TIMI flow grade 0–1 post pPCI, n (%) | 4 (1.1) | 0 | 4 (1.4) | 0.17 |
Door‑to‑balloon time, min | 84.5 (68.8–120) | 82 (64–110) | 85 (70–120) | 0.25 |
pPCI, n (%) | 322 (92) | 69 (94.5) | 253 (91.3) | 0.37 |
GRACE score | 151 (133–174) | 150 (133.5–179) | 151 (133–174) | 0.88 |
SYNTAX score | 16.5 (12–20.5) | 14 (11.3–19.5)a | 17 (12.5–20.5) | 0.02 |
TIMI score | 4 (2–6) | 4 (2–6) | 4 (2–6) | 0.66 |
Pharmacotherapy during hospitalization, n (%) | ||||
Antiplatelet agent | 350 (100) | 73 (100) | 277 (100) | 1.00 |
ACEI/ARB | 239 (68.3) | 48 (65.8) | 191 (69) | 0.60 |
MRA | 49 (14) | 11 (15.1) | 38 (13.7) | 0.77 |
β-Blocker | 274 (78.3) | 51 (69.9) | 223 (80.5) | 0.06 |
Statin | 350 (100) | 73 (100) | 277 (100) | 1.00 |
In comparison with the MACE‑free group, patients in the MACE group were significantly older, had lower levels of hemoglobin and non–high‑density lipoprotein cholesterol, a higher peak value of NT‑proBNP (pNT‑proBNP), lower SYNTAX score, and lower levels of low‑density lipoprotein cholesterol (LDL‑C) and total cholesterol (TC). Lower LDL‑C and TC in the MACE group correlated with a higher percent of statin use (all P <0.05).
Medical history, pharmacotherapy during hospitalization, NT‑proBNP levels on admission, angiographic characteristics, GRACE score, and the Thrombolysis in Myocardial Infarction (TIMI) score were similar in the 2 groups (all P >0.05). For comparison purposes, we calculated the changes in NT‑proBNP (∆1NT‑proBNP, calculated as the level at 24 hours post pPCI minus the admission level, and ∆2NT‑proBNP, calculated as the level at day 5 post pPCI minus the admission level), changes in TnI (∆1TnI, calculated as the level at 24 hours post pPCI minus the admission level, and ∆2TnI, calculated as the level at day 5 post pPCI minus the admission level), and changes in CK‑MB (∆1CK‑MB, calculated as the level at 24 hours post pPCI minus the admission level, and ∆2CK‑MB, calculated as the level at day 5 post pPCI level minus the admission level). However, no significant differences between the groups were found.
Comparisons of plasma soluble suppression of tumorigenicity 2 levels at 3 analyzed time points in patients with and without major adverse cardiovascular events
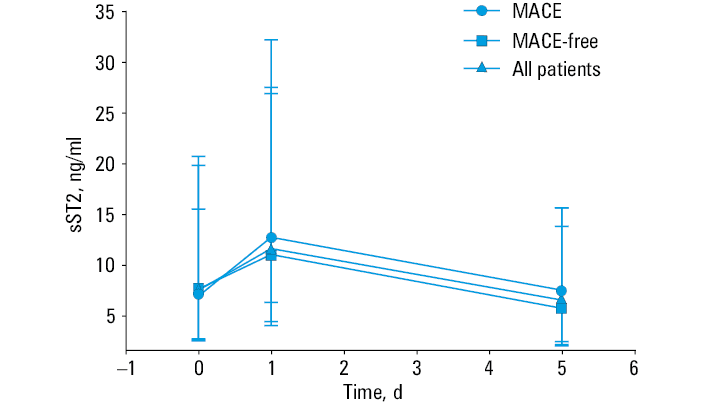
The sST2 levels changed dynamically, increasing at 24 hours and decreasing at day 5 after pPCI (P <0.001). On admission, the median (IQR) sST2 level was 6.9 (2.5–15.5) ng/ml in the MACE group and 7.6 (2.7–20.7) ng/ml in the MACE‑free group. Twenty‑four hours post pPCI, median (IQR) sST2 concentrations increased significantly to 12.7 (6.3–32.2) ng/ml and 11.0 (4.0–26.9) ng/ml in the MACE and MACE‑free groups, respectively. At day 5 after pPCI, the median (IQR) plasma levels of sST2 in the MACE and MACE‑free groups were 7.5 (2.4–13.8) ng/ml and 5.7 (2.0–15.6) ng/ml, respectively. The pattern of sST2 changes was similar in the MACE and MACE‑free groups, and also similar to the pattern of changes in the levels of cardiac biomarkers post MI. sST2 concentrations at the 3 analyzed time points did not differ between the MACE and MACE‑free groups (all P >0.05; Figure 2).
Abbreviations: see Figure 1
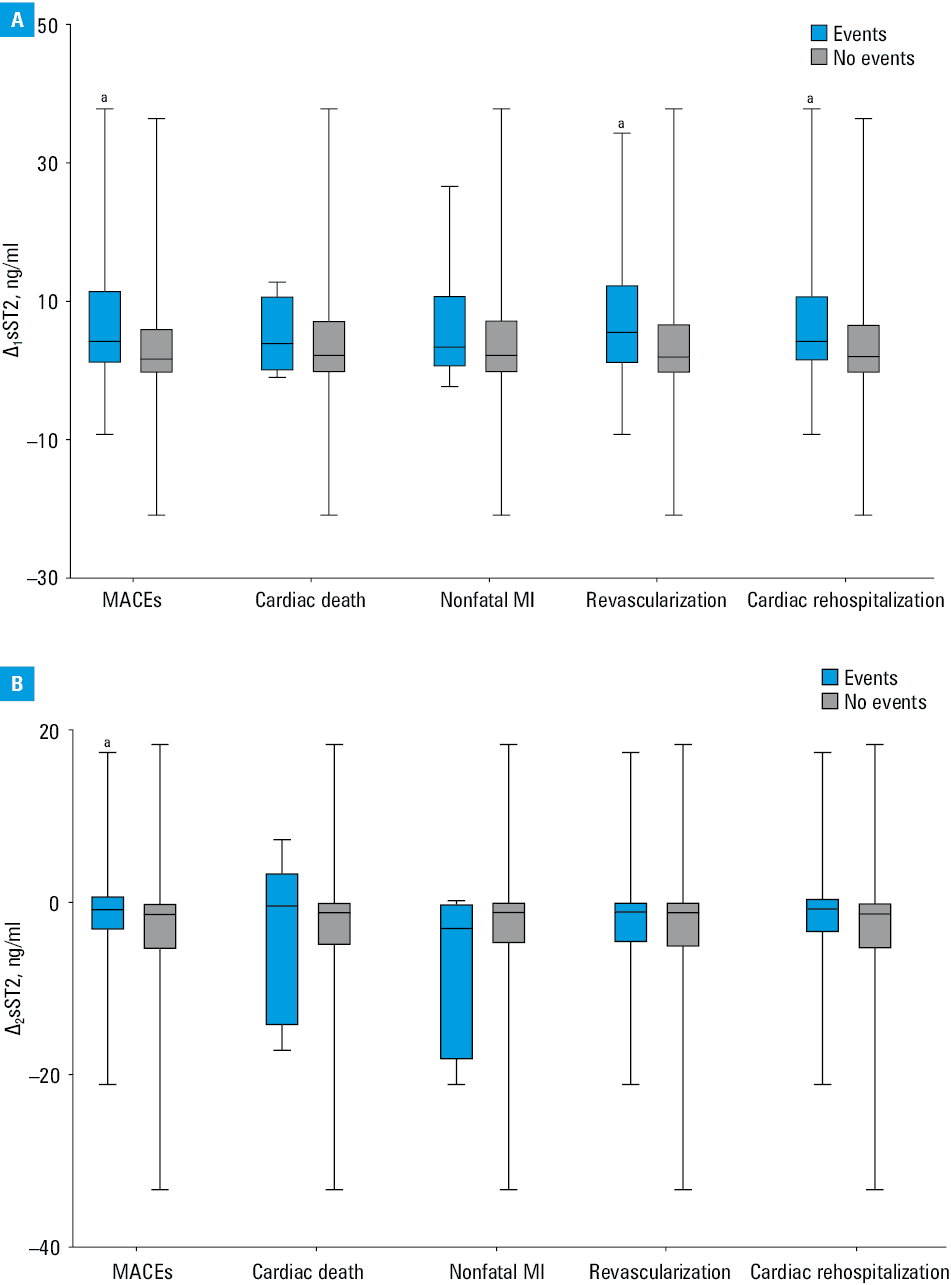
We also calculated the changes in sST2 levels between different time points. ∆1sST2 represented the change from the admission level to the level 24 hours post pPCI, and ∆2sST2 was the change from the admission level to the level at day 5 post pPCI. In comparison with the MACE‑free group, patients with MACEs showed a significantly greater ∆1sST2 (median [IQR], 4.3 [1.0–11.7] ng/ml vs 1.7 [–0.4 to 6.2] ng/ml, P = 0.001] (Figure 3A). As shown in Figure 3B, median (IQR) ∆2sST2 was –0.7 (–3.2 to 1.0) ng/ml in the MACE group and –1.3 (–5.4 to 0.1) ng/ml in the MACE‑free group (P = 0.02). In other words, the plasma levels of sST2 in the MACE group were significantly more elevated 24 hours post pPCI and slightly lower at day 5 post pPCI than in the MACE‑free group. Moreover, the Spearman correlation analysis revealed that ∆1sST2 positively correlated with hsCRP, TnI, and pNT‑proBNP levels (R = 0.111, R = 0.285, and R = 0.165, respectively; all P <0.05) but not with LVEDD, LVESD, LVEDV, LVESV, LVEDVI, LVESVI, and LVEF in both groups.
Abbreviations: see Figure 1
The ∆1sST2 and ∆2sST2 values in different MACE subgroups were also analyzed and compared. In the coronary revascularization group, median (IQR) levels of ∆1sST2 were significantly higher than in the group without coronary revascularization (5.6 [1.0–12.6] ng/ml vs 2.0 [–0.4 to 6.9] ng/ml, P = 0.02). In the cardiac rehospitalization group, median (IQR) ∆1sST2 values were also significantly higher than in the patients who did not require cardiac rehospitalization (4.3 [1.3–11.0] ng/ml vs 2.1 [–0.4 to –6.8] ng/ml, P = 0.02). However, the cardiac death and nonfatal MI groups showed similar levels of ∆1sST2. The ∆2sST2 values were similar in all the subgroups (P >0.05; Figure 3A and 3B).
Analysis of risk factors for major adverse cardiovascular events
During the 1‑year follow‑up, MACEs occurred in 20.9% of the enrolled patients. The Cox regression analysis was used to analyze the independent risk factors for MACEs. As shown in Table 2, ∆1sST2, ∆2sST2, SYNTAX score, pNT‑proBNP, hemoglobin, and LDL‑C levels, age, sex, and LVEF below 50% were found to be the independent risk predictors. Multivariable Cox regression analysis revealed that ∆1sST2 was an independent risk factor for MACE occurrence (P = 0.03).
Parameter | Univariable model | Multivariable model 1a | Multivariable model 2b | |||||||||
P value | HR | 95% CI | P value | Adjusted HR | 95% CI | P value | Adjusted HR | 95% CI | ||||
∆1sST2 was calculated as the level assessed 24 hours after pPCI minus the admission level of sST2; ∆2sST2 was calculated as the level assessed at day 5 after pPCI minus the admission level of sST2.
a Adjusted for ∆1sST2, male sex, age, SYNTAX score, hemoglobin, pNT‑proBNP, LDL‑C, and LVEF<50%
b Adjusted for ∆2sST2, male sex, age, SYNTAX score, hemoglobin, pNT‑proBNP, LDL‑C, and LVEF<50%
| ||||||||||||
∆1sST2, ng/ml | 0.001 | 1.036 | 1.015 | 1.058 | 0.03 | 1.030 | 1.003 | 1.057 | – | – | – | – |
∆2sST2, ng/ml | 0.05 | 1.039 | 1.000 | 1.080 | – | – | – | – | 0.19 | 1.030 | 0.986 | 1.076 |
Male sex | 0.11 | 0.670 | 0.409 | 1.097 | 0.96 | 0.978 | 0.445 | 2.151 | 0.92 | 1.043 | 0.476 | 2.282 |
Age | 0.01 | 1.023 | 1.005 | 1.042 | 0.33 | 1.013 | 0.987 | 1.040 | 0.31 | 1.014 | 0.988 | 1.041 |
SYNTAX score | 0.04 | 2.672 | 1.011 | 7.060 | 0.32 | 0.974 | 0.925 | 1.025 | 0.28 | 0.972 | 0.923 | 1.024 |
Hemoglobin, g/l | 0.002 | 1.455 | 0.614 | 3.447 | 0.89 | 0.999 | 0.978 | 1.020 | 0.99 | 1.000 | 0.979 | 1.021 |
pNT‑proBNP, per 100 pg/ml | 0.07 | 1.005 | 1.000 | 1.010 | 0.33 | 1.003 | 0.997 | 1.009 | 0.26 | 1.004 | 0.997 | 1.010 |
LDL‑C, mmol/l | 0.03 | 0.706 | 0.518 | 0.961 | 0.22 | 0.792 | 0.545 | 1.153 | 0.18 | 0.771 | 0.529 | 1.125 |
LVEF <50% | 0.62 | 0.869 | 0.499 | 1.513 | 0.90 | 1.043 | 0.529 | 2.056 | 0.84 | 1.072 | 0.541 | 2.125 |
Receiver operating characteristic curve analysis of the predictive value of Δ1 sST2 for major adverse cardiovascular events
The area under the ROC curve for ∆1sST2 as a predictor of post‑pPCI MACEs in this patient cohort was 0.621 (95% CI, 0.547–0.695; P = 0.001). According to the maximum Youden index, the cutoff value was 1.87 ng/ml, with a sensitivity of 69.9%, and a specificity of 51.6% (Figure 4).
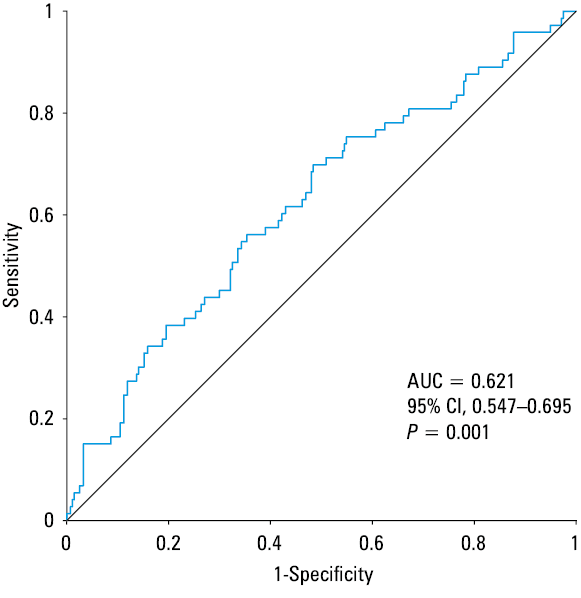
Abbreviations: AUC, area under the curve; others, see Figure 1
The Kaplan–Meier analysis of the 1‑year risk for major adverse cardiovascular events according to Δ1sST2
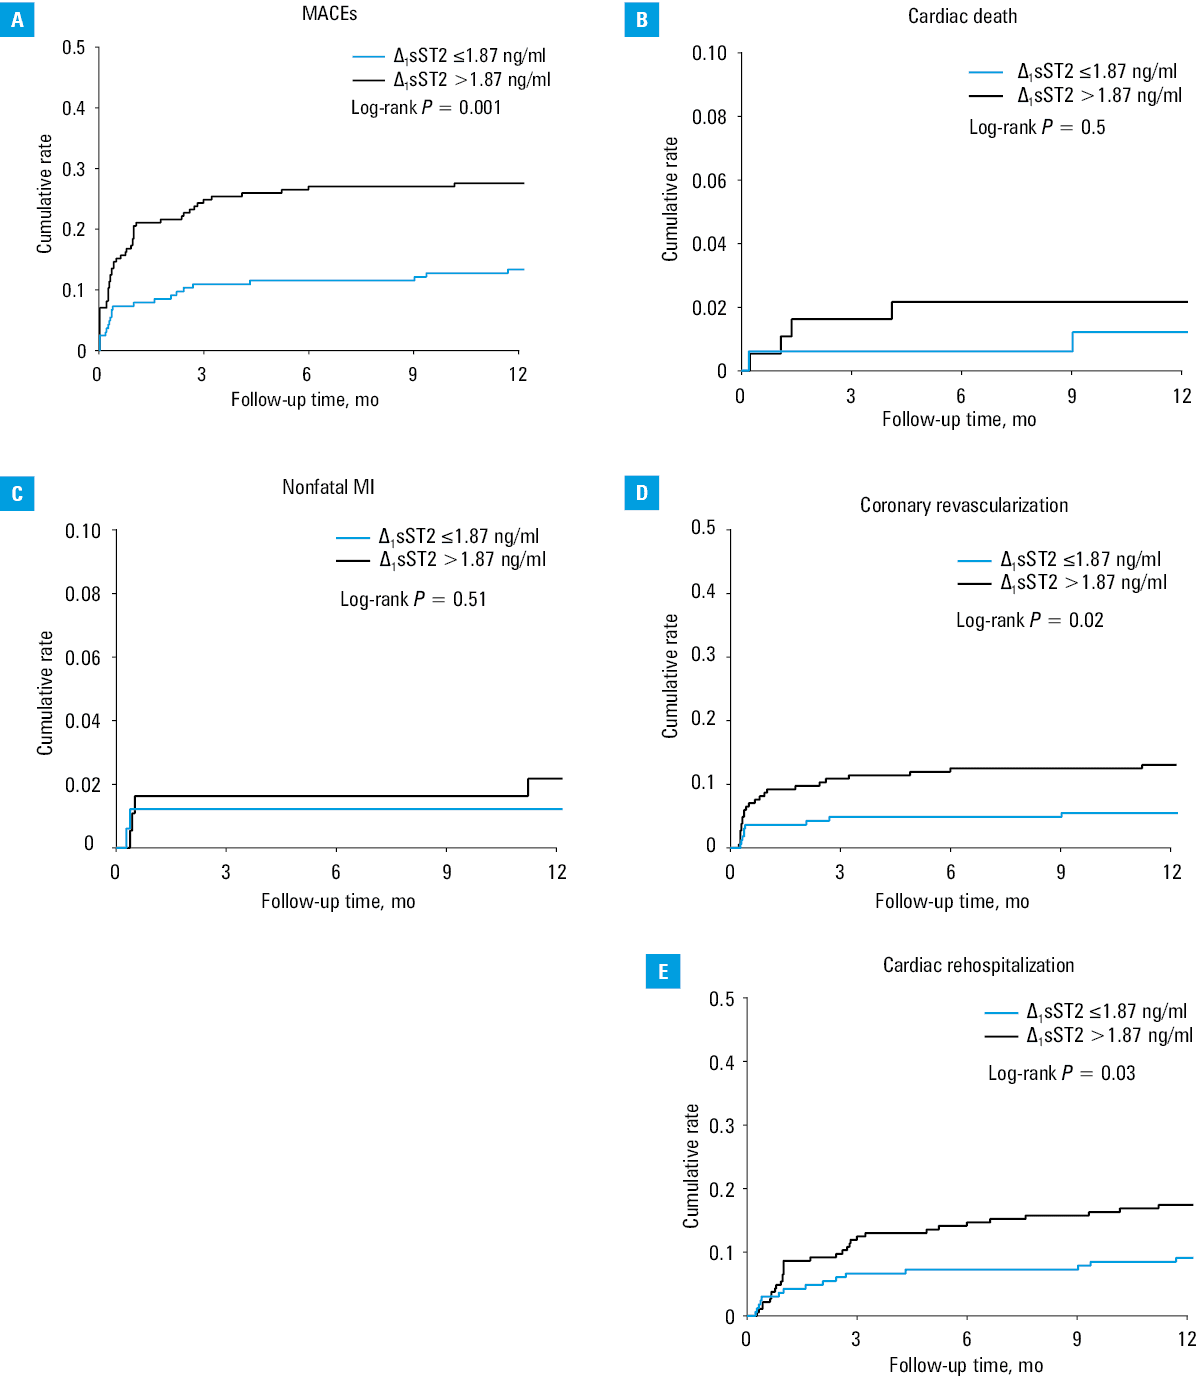
Based on the cutoff value of ∆1sST2, all patients were divided into a low ∆1sST2 group (∆1sST2 ≤1.87 ng/ml; n = 165) and a high ∆1sST2 group (∆1sST2 >1.87 ng/ml; n = 185). In the analysis using the low ∆1sST2 group as a reference, the 1‑year incidence rate of MACEs was 13.3% (22/165) in the low ∆1sST2 group and 27.6% (51/185) in the high ∆1sST2 group (hazard ratio [HR], 2.225; 95% CI, 1.368–3.719; P <0.05; Table 3). Coronary revascularization was elective in all cases and was performed in 9.4% of all patients (33/350), including 5.5% (9/165) of the patients in the low ∆1sST2 group and 13% (24/185) in the high ∆1sST2 group (HR, 2.476; 95% CI, 1.151–5.326; P <0.05). Cardiac rehospitalization occurred in 9.1% (15/165) of the patients in the low ∆1sST2 group and 17.3% (32/185) of those in the high ∆1sST2 group (HR, 1.982; 95% CI, 1.073–3.661; P <0.05). The incidence of cardiac death and nonfatal MI did not differ in the 2 groups (P >0.05; Table 3; Figure 5).
Parameter | ∆1sST2 ≤1.87 ng/ml (n = 165) | ∆1sST2 >1.87 ng/ml (n = 185) | HR (95 %CI) | P value |
Data are presented as number (percentage) of patients unless indicated otherwise.
∆2sST2 was calculated as the level assessed 24 hours after pPCI minus the admission level of sST2.
| ||||
MACEs | 22 (13.3) | 51 (27.6) | 2.225 (1.368–3.719) | 0.001 |
Cardiac death | 2 (1.2) | 4 (2.2) | 1.791 (0.328–9.778) | 0.50 |
Nonfatal MI | 3 (1.8) | 5 (2.7) | 1.779 (0.326–9.741) | 0.51 |
Coronary revascularization | 9 (5.5) | 24 (13) | 2.476 (1.151–5.326) | 0.02 |
Cardiac rehospitalization | 15 (9.1) | 32 (17.3) | 1.982 (1.073–3.661) | 0.03 |
Discussion
In the current study, we present 2 important findings: 1) changes in the plasma level of sST2 measured at 3 time points in the post‑pPCI patients with STEMI were similar to the changes in the levels of cardiac biomarkers—the concentration of sST2 was elevated 24 hours post pPCI and then decreased at day 5 after the procedure, and 2) the change in plasma sST2 levels from baseline to 24 hours post pPCI had a potential predictive value for MACE incidence during 1‑year follow‑up in patients with STEMI. Patients in the MACE group had a significantly greater increase in their plasma sST2 levels than those in the MACE‑free group. However, the same was not true for NT‑proBNP, TnI, and CK‑MB levels.
MACEs refer to complications occurring in patients with acute myocardial infarction (AMI) after PCI and are related to a high mortality rate. Thus, prevention and early intervention are critical to avoiding MACEs or minimizing their incidence.14,15 AMI can provoke cell migration into the myocardium, stimulating the inflammatory immune responses and resulting in structural and biochemical changes in the infarcted myocardium. These processes may lead to left ventricular remodeling, HF, and even death.5,16,17 As a traditional marker of myocardial damage, elevated troponin was associated with greater MI size and poor prognosis, but it was not implicated to predict left ventricular remodeling in previous studies, while CK‑MB still lacks the specificity in the diagnosis of AMI. In conditions such as breast malignancy, myocarditis, or pericarditis, CK‑MB level determination may lead to false‑positive results.18 Subsequently, some clinical scores, such as GRACE and TIMI, have emerged to enhance the specificity of the prediction of MACEs. However, significant differences in the predictive ability of the GRACE score in STEMI patients were found,19,20 and the TIMI score was ineffective, especially among individuals with left ventricular dysfunctions.21 Natriuretic peptides are considered well‑known diagnostic and prognostic biomarkers for MACEs, but due to their clinical vulnerability and hyposensitivity, they are not always reliable in clinical practice.22 The prognostic impact of NT‑proBNP in STEMI patients has been evaluated in previous studies.23,24 Mohammad et al25 showed that the change in pNT‑proBNP values following STEMI was predictive of the extent of myocardial damage and clinical outcomes. Sabatine et al26 demonstrated the enhanced predictive and prognostic power of short‑term risk stratification using changes in the sST2 level combined with the NT‑proBNP level in patients with STEMI. However, we failed to corroborate the significance of changes in NT‑proBNP levels that had been shown in previous studies. Therefore, we attempted to assess the role of alteration trends in NT‑proBNP levels to predict MACEs in this study. Besides, the use of novel biological markers was shown to improve the accuracy of diagnosis in cardiovascular patients, providing additional mechanistic insights into the biological alterations, and sST2 is one of these biomarkers.
It has been shown that sST2 binds IL‑33, inhibiting its interaction with the ST2L receptor to trigger the cardioprotective signaling, resulting in the limited protective effect of ST2 on cardiac remodeling.12,27,28 Previous studies showed that sST2 is a robust prognostic marker predicting an increased risk of cardiovascular mortality and adverse events. sST2 level increases steadily after AMI till it reaches its peak 12 to 18 hours post AMI, and this change positively correlates with CK levels and negatively with ejection fraction.29-31 Kohli et al32 concluded that the change in the sST2 level is strongly associated with the risk of HF after non‑STEMI at 30 days and 1 year but correlates weakly with biomarkers of acute injury and NT‑proBNP. Jenkins et al33 demonstrated that higher values of sST2 could be associated with an increased risk of death and HF following MI in a large cohort of unselected community patients. However, another study showed that the baseline sST2 level was not associated with progressive cardiac remodeling following MI in a 4‑month follow‑up.34 Despite some promising results, it remains uncertain whether sST2 can be used to predict the outcome of patients with AMI. Herein, we reported that the sST2 concentration significantly increased 24 hours post pPCI and decreased at day 5 after the procedure in 350 STEMI patients, which is consistent with the results of previous studies30,31. However, in our study, sST2 plasma levels on admission, as well as 24 hours and 5 days post pPCI, were not significantly different in the MACE and MACE‑free groups. In contrast, previous studies showed that the sST2 level on admission might serve as a prognostic marker in the follow‑up of patients with HF and AMI.35,36 Our study did not confirm the role of sST2 on admission in predicting the risk of MACEs. We also observed changes in the level of NT‑proBNP; however, the predictive ability of baseline or peak values of NT‑proBNP was not onfirmed either in this study. Furthermore, the multivariable Cox regression analysis revealed that ∆NT‑proBNP had no significant predictive potential with respect to MACEs. The inconsistent results may be due to the differences in study populations and definitions of MACEs. In addition, NT‑proBNP is primarily associated with decreased cardiac function, and levels of natriuretic peptides are usually influenced by age, sex, body mass index, etiology of HF, renal dysfunction, and other factors.37 The prognostic value of sST2 was shown to be incremental to that of NT‑proBNP in patients with HF.37,38 sST2 positively correlated with cardiomyocyte hypertrophy and cardiac fibrosis, promoting inflammatory reactions, and had a low biological variability.39 Notably, ∆1sST2 and ∆2sST2 values were significantly different between the MACE and MACE‑free groups in our study. The Cox regression analysis revealed that ∆1sST2 was an independent risk factor for MACEs, whereas ∆2sST2 was not. In other words, a high sST2 concentration 24 hours post‑pPCI in patients with STEMI was associated with an increased risk of MACE development, independent of any other prognostic factors, such as age, sex, LVEF below 50%, or LDL‑C, hemoglobin, and pNT‑proBNP levels in the 1‑year follow‑up. To the best of our knowledge, this is the first study reporting these critical observations. Additionally, our data suggest that sST2 measurement at multiple time points can provide more accurate prognostic information with respect to MACEs than a single measurement.
MI is associated with the activation of inflammatory immune responses. In response to inflammation and cardiac stress, the IL‑33/ST2 signaling pathway gets activated to prevent myocardial hypertrophy and fibrosis by blocking the conversion of T‑helper type 1 (Th1) to Th2 cells to alleviate atherosclerosis. Meanwhile, sST2 is released into circulation. Th1 cells play a critical pathogenic role in atherosclerosis.40 This might explain why the plasma levels of sST2 were significantly increased in patients with STEMI. In our study, ∆1sST2 weakly correlated with biomarkers of acute injury (TnI) and inflammation (hsCRP), and less pronounced changes in sST2 levels were associated with significantly lower incidence of composite MACEs, coronary revascularization, and cardiac rehospitalization during the 1‑year follow‑up after pPCI. It is possible that a higher level of sST2 could induce a more severe inflammatory response, severe atherosclerosis, and increased area of myocardial injury, thus explaining why the incidence rate of MACEs was higher in the group with greater ∆1sST2 than that with lower ∆1sST2.
We were not able to prove that the absolute level of sST2 at a single time point had any prognostic role for MACE prediction. This discrepancy between our results and findings of previously published studies10,14 might be due to the fact that we measured sST2 levels at multiple time points to reveal the impact of dynamic changes in the sST2 level rather than considering the absolute sST2 level at a single time point.
SYNTAX scoring, a quantitative digital method for the prognostic evaluation of patients undergoing PCI, assesses the severity of coronary artery disease and the number of affected vessels in combination with image analyses. Previous studies showed that elevated levels of LDL‑C and TC, as well as statin use before index admission, were associated with a high SYNTAX score and were predictors of coronary heart disease complexity.41-43 In our study, the SYNTAX score as well as LDL‑C and TC levels were higher and statin use was less frequent in the MACE‑free group than in the MACE group. SYNTAX score was found to positively correlate with the LDL‑C level in previous studies,44 which was consistent with the results of our study—this is why patients in the MACE‑free group had a higher SYNTAX score. We also estimated the door‑to‑balloon time to evaluate the relationship between the sST2 level and ischemic time. Vichova et al45 showed that a longer delay to reperfusion was associated with higher baseline levels of thioredoxin 1 and 8‑isoprostanes 1 hour following pPCI, which was related to oxidative stress. Unfortunately, no significant difference for this parameter was observed in our study. However, Vichova et al45 noted that the changes in marker levels in relation to ischemic time and reperfusion seem more relevant than isolated values. This observation was consistent with our results.
Overall, our study supports and extends the knowledge from prior publications. We examined the changes in sST2 levels in patients after STEMI and found an association between this parameter and long‑term clinical outcomes after pPCI. We did not prove that the dynamic changes in the levels of NT‑proBNP, TnI, and CK‑MB had an independent predictive value for MACEs. There were no significant differences in pharmacotherapy before admission and during hospitalization between the MACE and MACE‑free groups. We believe that the predictive value of sST2 could be higher in STEMI patients undergoing pPCI.
Limitations
There are some limitations to this study. First, this was a single‑center study with a relatively small sample size and short follow‑up. Second, the incidence rate of cardiac death in this study was too low to enable investigation of its relationship with the sST2 level in this cohort of patients.
Conclusions
The increase in the plasma sST2 level from admission to 24 hours post pPCI could have an independent prognostic value in predicting 1‑year MACEs, especially coronary revascularization and cardiac rehospitalization, in STEMI patients undergoing pPCI. Mitigating sST2 elevation as a therapeutic target may reduce the incidence of post‑pPCI MACEs and improve clinical outcomes of the patients.
- Yeh RW, Sidney S, Chandra M, et al. Population trends in the incidence and outcomes of acute myocardial infarction. N Engl J Med. 2010; 362: 2155‑2165. | Crossref
- Roger VL. Cardiovascular diseases in populations: secular trends and contemporary challenges‑Geoffrey Rose lecture, European Society of Cardiology meeting 2014. Eur Heart J. 2015; 36: 2142‑2146. | Crossref
- Ibanez B, James S, Agewall S, et al. 2017 ESC Guidelines for the management of acute myocardial infarction in patients presenting with ST‑segment elevation: the Task Force for the management of acute myocardial infarction in patients presenting with ST‑segment elevation of the European Society of Cardiology (ESC). Eur Heart J. 2018; 39: 119‑177.
- Zagidullin N, Motloch LJ, Gareeva D, et al. Combining novel biomarkers for risk stratification of two‑year cardiovascular mortality in patients with ST‑elevation myocardial infarction. J Clin Med. 2020; 9: 550. | Crossref
- Tymińska A, Kapłon‑Cieślicka A, Ozierański K, et al. Association of galectin‑3 and soluble ST2, and their changes, with echocardiographic parameters and development of heart failure after ST‑segment elevation myocardial infarction. Dis Markers. 2019; 2019: 9529053. | Crossref
SUPPLEMENTARY MATERIAL
ARTICLE INFORMATION