
Antiviral prophylaxis, male sex, and killer immunoglobulin-like receptor KIR2DL3 as markers for stratifying the risk of BK polyomavirus–associated nephropathy in kidney transplant recipients
Key words: BKPyVAN, polyomavirus–associated nephropathy, kidney transplantation, killer-cell immunoglobulin-like receptor, natural killer cell, valganciclovir


 CC BY-NC-SA 4.0
Antiviral prophylaxis, male sex, and killer immunoglobulin-like receptor KIR2DL3 as markers for stratifying the risk of BK polyomavirus–associated nephropathy in kidney transplant recipients
CC BY-NC-SA 4.0
Introduction: The risk of polyomavirus‑associated nephropathy (PyVAN) currently ranges from 1% to 10%, and the risk of graft loss is 10% to 50% within 2 years post‑diagnosis. There is currently no specific antiviral therapy against BK polyomavirus (BKPyV), and no therapeutic approach has been proven superior. Natural killer cells play a key role in the defense against viral infections.
Objectives: A retrospective, single‑center cohort study was performed to investigate the association between the kidney transplant recipients’ killer‑cell immunoglobulin‑like receptor (KIR) genotype and PyVAN. We also evaluated other possible risk factors for the occurrence of PyVAN in a population of kidney transplant recipients.
Patients and methods: DNA samples from 134 kidney transplant recipients were identified for the presence or absence of variable KIR genes and their HLA ligands using polymerase chain reaction with sequence‑specific primers.
Results: The analysis revealed that the presence of the inhibitory KIR2DL3 (P = 0.03) was a risk factor for posttransplant PyVAN. We also found that the presence of acute rejection before PyVAN (P = 0.02), male sex (P = 0.04), and the lack of antiviral prophylaxis (P = 0.01) were additional risk factors for posttransplant PyVAN.
Conclusions: Our findings confirm that the KIR/HLA genotype plays a significant role in the development of PyVAN and suggest the contribution of both environmental and genetic factors to the incidence of BKPyV infection after kidney transplantation.
What's new?
To date, there are limited data on the relationship between killer‑cell immunoglobulin‑like receptor (KIR) genes and BK polyomavirus–associated nephropathy (PyVAN). In this study, we focus on the impact of KIRs and their interaction with human leukocyte antigen ligands on the risk of PyVAN, and evaluate other possible risk factors for the occurrence of PyVAN in a population of kidney transplant recipients.Thus far, the risk stratification for posttransplant PyVAN has been primarily based on the assessment of characteristic histology on a renal biopsy and / or detection of BK polyomavirus (BKPyV) DNA in the urine and plasma. In our opinion, this strategy could be improved by implementing other biomarkers predictive of PyVAN after kidney transplantation. It would allow for more personalized management. The assessment of KIR2DL3 prior to transplantation could potentially be used in combination with checking for BKPyV DNA.
Introduction
In at least 80% of the adult population, BK polyomavirus (BKPyV) infection occurs early in childhood and remains latent within renal tubular cells and the uroepithelium, with minimal clinical manifestations.1 In kidney transplant recipients, the virus reveals its pathogenicity most commonly by causing a form of tubulointerstitial nephropathy, referred to as BK polyomavirus–associated nephropathy (PyVAN).2 Apart from kidney transplantation itself, one of the strongest determinants of PyVAN evolution is the recipient’s level of immunosuppression. The risk of PyVAN currently ranges from 1% to 10%, and the risk of graft loss is 10% to 50% within 2 years post‑diagnosis, reflecting the importance of this infectious complication.3 There is currently no specific antiviral therapy against BKPyV, and no therapeutic approach has been found superior. The most important component of anti‑PyVAN treatment is the reduction of immunosuppressive treatment strength. However, complete withdrawal of immunosuppression is impossible, and proper identification of other PyVAN risk factors is necessary to discover new modalities helpful in minimizing the negative impact of this complication in the kidney transplant population.4 Within the last decade, several factors have been shown to affect the risk of BKPyV replication and the evolution of PyVAN, including some donor characteristics (eg, older age, the presence of BKPyV viruria, cytomegalovirus [CMV] serostatus, and the absence of HLA‑C7), and recipient characteristics (eg, prior sensitization, obesity, sex, and BKPyV serostatus).5-7 Additionally, some factors that are related to the transplantation procedure itself were found to play a role, including the time of cold ischemia, the presence of a ureteral stent, and graft function.8,9 Among immunological parameters, the type of immunosuppressive treatment and occurrence of acute rejection episodes were also shown to impact the risk of PyVAN occurrence.9 In recent years, the list of relevant risk factors has grown through the identification of several genetic markers. In recipients, the presence of KIR3DS1, HLA‑C7, HLA‑A2, HLA‑B44, HLA‑B51, and HLA‑DR15, as well the g‑interferon gene polymorphism, were identified to play a role. In donors, the presence of HLA‑C7 and MICA A5.1 were also shown to be relevant.10
The immune response to BKPyV infection is complex, and the role of both adaptive and innate responses has not been well established in the transplant recipients. Natural killer (NK) cells have been shown to affect the pathophysiology of BKPyV infection and nephropathy. Killer immunoglobulin‑like receptors (KIRs) are surface receptors that are expressed by NK cells and play a central role in immunity. Together with their HLA ligands, KIRs regulate the function of NK cells, thereby determining whether they are to be activated or inhibited from killing the cell being interrogated.11 Inhibition and activation of the NK cell response is determined by the balance between activating and inhibitory signals from KIRs‑HLA interactions.
KIRs that have a short intracytoplasmic tail activate lymphocytes. Inhibitory KIRs have a long intracellular region and may possess 2 or 3 immunoglobulin‑like extracellular domains.12-14 There are 2 groups of KIR haplotypes: group A and group B. Group A includes mostly inhibitory KIRs, of which only KIR2DS4 and KIR2DL4 activate NK cells.15
The genetic variability of KIRs and / or HLA ligands in solid organ transplants might help to determine the clinical outcomes and protection against viral infections. To date, there are limited data on the relationship between the KIR genes and PyVAN. In this study, we focused on the impact of KIRs and their interaction with HLA ligands on the risk of PyVAN, and evaluated other possible risk factors for the occurrence of PyVAN in a population of kidney transplant recipients.
Patients and methods
The patients (n = 134) who received a kidney transplant between March 2010 and November 2014 in the Department of General and Transplant Surgery, were enrolled in the study.
Ethics
The study was approved by the ethics committee of the Medical University of Warsaw (KB/114/2014 and KB/50/2015). The study complied with the provisions of Good Clinical Practice Guidelines and the Declaration of Helsinki. All the patients provided their informed consent prior to participation in the study.
Study group
Deceased donor grafts were typed for HLA‑A, HLA‑B, HLA‑C1, and HLA‑DR. Kidney transplant recipients were typed for KIR and HLA‑A, HLA‑B, HLA‑C, and HLA‑DR. Then, close monitoring of the occurrence of acute rejection episodes, immunosuppressive drugs concentration, and white blood count fluctuations was performed for 720 days. Commercial tests were run according to the manufacturers’ instructions. Lymphocyte and leukocyte blood counts were assessed using fluorescence flow cytometry (XN‑2000 system, Sysmex, Kobe, Japan), and whole blood tacrolimus (ARCHITECT i1000SR immunoassay analyzer, Abbot Park, Illinois, United States) / cyclosporine A (The Dimension EXL 200 Integrated Chemistry System, Siemens Healthcare Diagnostics, Erlangen, Germany) concentrations were determined using a chemiluminescent microparticle immunoassay. The estimated glomerular filtration rate (eGFR) was calculated based on the abbreviated Modification of Diet in Renal Disease equation. A total of 62.7% of the recipients received induction therapy (Table 1). All acute rejection episodes were proven by biopsy, with the diagnosis based on the Banff 2017 criteria.16
Characteristic | Value | |
Abbreviations: eGFR, estimated glomerular filtration rate; HLA, human leukocyte antigen; IQR, interquartile range; KIR, killer cell immunoglobulin‑like receptors | ||
Age of recipient, y, median (IQR) | 49 (20–77) | |
Male sex, n (%) | 87 (65) | |
Type of transplant, n (%) | Kidney | 129 (96) |
Kidney + pancreas | 4 (3) | |
Kidney + heart | 1 (1) | |
Number of kidney transplants | 1 | 113 |
2 | 20 | |
3 | 1 | |
Type of donor, n (%) | Living | 10 (7.4) |
Deceased | 124 (92.6) | |
Induction therapy, n (%) | Thymoglobulin | 13 (9.7) |
Basiliximab | 71 (53) | |
None | 50 (37.3) | |
Maintenance immunosuppression, n (%) | Tacrolimus + mycophenolate mofetil / sodium + prednisone | 117 (87.3) |
Cyclosporine A + mycophenolate mofetil / sodium + prednisone | 16 (12) | |
Tacrolimus + everolimus + prednisone | 1 (0.7) | |
HLA mismatch, n (%) | 1–3 | 59 (44) |
3–6 | 75 (56) | |
Cyclosporine A concentration, ng/ml, median (IQR) | Day 30 | 282.2 (74.2–740) |
Day 90 | 185 (76–453.9) | |
Day 360 | 130.7 (46–338.4) | |
Tacrolimus concentration, ng/ml, median (IQR) | Day 30 | 10.8 (1.2–23) |
Day 90 | 8.9 (2.1–25.2) | |
Day 360 | 6.9 (3.1–22.4) | |
Allograft function; eGFR, ml/min/1.73 m2, median (IQR) | Day 30 | 43.9 (6.7–103.7) |
Day 90 | 46.1 (8.5–98.9) | |
Day 360 | 48.8 (8.8–105) | |
KIR genotype, n (%) | A/A | 42 (31.3) |
B/X | 92 (68.7) | |
T‑cell–mediated rejection (TCMR) was initially treated with intravenous methylprednisolone. If resistance to this treatment was evident, the patients were treated with thymoglobulin. Antibody‑mediated rejection (ABMR) episodes were treated with intravenous immunoglobulin, methylprednisolone, and /or plasmapheresis. According to the institutional protocol, all of the patients at intermediate (R+) and high (D+/R–) CMV risk received antiviral prophylaxis with valganciclovir (VGCV), with its dose adjusted to the kidney graft function.
Human leukocyte antigen genotyping
Donors and recipients were typed for HLA‑A, HLA‑B, and HLA‑DR‑B1 by sequence‑specific primer polymerase chain reaction. The HLA‑C and KIR genes were typed using Lifecodes HLA‑SSO and KIR‑SSO typing kits, respectively (Immucor Dgn, Lifecodes, Stamford, Connecticut, United States), based on xMAP Luminex technology (Luminex, Austin, Texas, United States) according to the manufacturers’ instructions.
Killer cell immunoglobulin‑like receptors genotyping
Cryopreserved recipient peripheral blood mononuclear cells were used for KIR genotyping by applying a reverse‑sequence specific oligonucleotide method according to the manufacturer’s instructions (Lifecodes KIR Genotyping, Immucor Transplant Diagnostic, Stamford, Connecticut, United States). DNA concentration in each sample was determined using a UV/Vis NanoDrop Spectrophotometer (ThermoFisher Scientific, Wilmington, Delaware, United States). All further genotyping procedures were performed retrospectively.
KIR gene profiles were determined by the presence or absence of each KIR gene in a given individual. KIR2DS4 was typed for encoded cell surface receptor or a truncated protein variant with loss of the transmembrane and cytoplasmic domains by GeneScan analysis with a 6‑carboxyfluorescein labeled primer. We used the MATCH IT DNA program for analysis (Immucor, Norcross, Georgia, United States).
The presence of KIR ligands in the recipients was assessed by grouping each patient’s HLA class I antigens according to defined specificities: the patients were considered to have C1 group ligands if they possessed an HLA‑C molecule with an asparagine at position 80, C2 group ligands if they possessed an HLA‑C molecule with a lysine residue at position 80, and Bw4 ligands if their HLA‑B antigens included at least 1 antigen with the Bw4 specificity as described elsewhere17. We defined KIR‑A and KIR‑B haplotypes as previously described.15,18 Briefly, the group A haplotypes comprise 4 framework genes present in most KIR haplotypes (KIR3DL3, KIR3DL2, KIR2DL4, and the pseudogene KIR3DP1) plus KIR2DL1, KIR2DL3, KIR3DL1, KIR2DS4, and KIR2DP1. KIR‑B haplotypes contain 1 or more of the following genes: KIR2DL2, KIR2DL5, KIR2DS1, KIR2DS2, KIR2DS3, KIR2DS5, and KIR3DS1. BKPyV DNAemia was evaluated in plasma using a commercial BKPyV R‑gene real‑time detection and quantification kit analysis (bioMérieux, Marcy l’Etoile, France). The quantitative results are expressed as copies/ml. The quantification range for BKPyV is 2.3 to 9.0 log10 copies/ml for plasma. The results were validated with extraction, inhibition, and negative controls provided in the BKPyV R‑gene kit.
BK polyomavirus‑associated nephropathy
BKPyV DNA quantification was performed using plasma samples on days 0, 90, and 360 post kidney transplantation, and additionally when the allograft biopsies were performed.
PyVAN was diagnosed according to the 2017 Banff criteria for a morphologic classification of biopsy‑proven PyVAN based primarily on a tissue PyV load score, and the Banff fibrosis ci score. Each score graded from 0 to 3, and both showed an independent association with the graft outcome.19
Statistical analysis
Qualitative variables were compared using the χ2 test and the Fisher exact test, depending on the sample size. To measure the fraction of events, the Kaplan–Meier model was used. This model estimates and tests survival over time under different factors. Quantitative variables were summarized by medians (interquartile range [IQR]) because the parameters did not follow a normal distribution, and they were compared using the Wilcoxon rank sum test. A multivariable analysis was performed with the generalized logistic regression model. To assess the goodness‑of‑fit and select the optimal model, the Akaike Information Criterion statistics with the exhaustive feature selection technique was used. Values of P below 0.05 were considered significant. The data were analyzed using SAS 14.3 software (SAS Institute Inc., Cary, North Carolina, United States).
Results
Clinical characteristics of the study patients
The recipients’ baseline characteristics are summarized in Table 1. The study included 134 kidney transplant recipients. Group 1 (PyVAN[+]) included 20 recipients with biopsy‑proven PyVAN. Group 2 (PyVAN[–]) included 114 recipients with no BKV infection or PyVAN during the 720 days after the kidney transplantation.
Characteristics of KIR genotypes
The framework genes KIR2DL4, KIR3DP1, KIR3DL2, and KIR3DL3 were present in all of the recipients. The frequencies of the other KIR genes are presented in Figure 1.
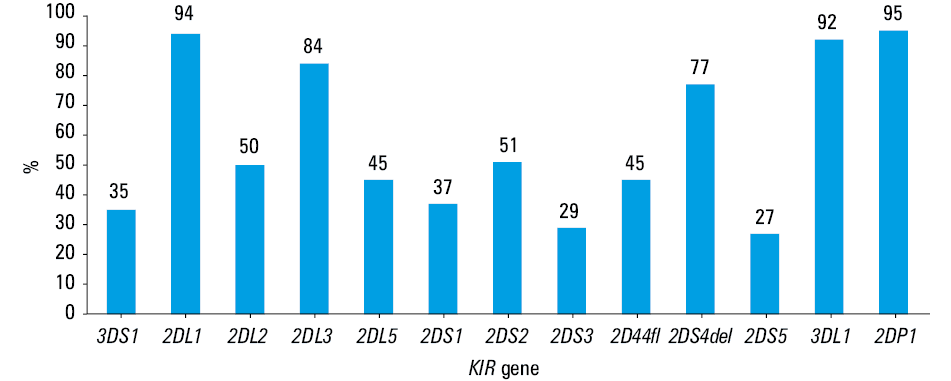
Based on the presence or absence of multiple activating KIRs, the samples in which KIR2DS4 was the only detected KIR activating gene were assigned the genotype A/A. We categorized genotypes as B/X if they carried the KIR activating genes other than KIR2DS4, which is concordant with the approach of other investigators.15,20 We then analyzed KIR A/A and B/X subgroup frequencies in the PyVAN(+) and PyVAN(–) study subgroups. The difference between both KIR genotypes did not reach statistical significance (P = 0.88) (Table 2).
Genetic factor | PyVAN(+), n (%) | PyVAN(–), n (%) | P value | |
Abbreviations: PyVAN, polyomavirus‑associated nephropathy; others, see Table 1 | ||||
KIR genotype | A/A | 6 (14.3) | 36 (85.7) | 0.88 |
B/X | 14 (15.2) | 78 (84.8) | ||
Number of activating KIRs | 1 | 6 (14.3) | 36 (85.7) | 0.63 |
2 | 5 (16.7) | 25 (83.3) | ||
3 | 4 (23.5) | 13 (76.5) | ||
4 | 4 (18.2) | 18 (81.8) | ||
5 | 1 (6.3) | 15 (93.7) | ||
6 | 0 | 7 (100) | ||
Number of inhibitory KIRs | 5 | 0 | 5 (100) | 0.78 |
6 | 9 (16.7) | 45 (83.3) | ||
7 | 8 (14) | 49 (86) | ||
8 | 3 (16.7) | 15 (83.3) | ||
KIR2DL1+HLA‑C2 | 13 (16.9) | 64 (83.1) | 0.45 | |
KIR2DL1-HLA‑C2 | 7 (12.3) | 50 (87.7) | ||
KIR2DL2+HLA‑C1 | 6 (9.8) | 55 (90.2) | 0.13 | |
KIR2DL2-HLA‑C1 | 14 (19.8) | 59 (80.8) | ||
KIR2DL3+HLA‑C1 | 16 (19.5) | 66 (80.5) | 0.06 | |
KIR2DL3-HLA‑C1 | 4 (7.7) | 48 (92.3) | ||
KIR3DL1+HLA‑Bw4 | 11 (12.2) | 79 (87.8) | 0.2 | |
KIR3DL1-HLA‑Bw4 | 9 (20.45) | 35 (79.55) | ||
KIR3DL2+HLA‑A3/A11 | 10 (17.9) | 46 (82.1) | 0.41 | |
KIR3DL2-HLA‑3/A11 | 10 (12.8) | 67 (87.2) | ||
KIR gene frequencies in the patients with BK polyomavirus–associated nephropathy (univariable analysis)
To determine whether the frequency of certain KIR genes within this region differed between the PyVAN(+) and PyVAN(–) patients, we screened for their presence using KIR gene region typing. The KIR gene distribution between the PyVAN(+) and PyVAN(–) groups is presented in Table 3. The KIR2DL3 gene frequency was 82.1% in the PyVAN(–) group and 17.9% in the PyVAN(+) group (P = 0.03).
Genetic factor | PyVAN(+), n (%) | PyVAN(–), n (%) | P value |
KIR2DL1 (+) | 19 (15.1) | 107 (84.9) | 0.84 |
KIR2DL1 (–) | 1 (12.5) | 7 (87.5) | |
KIR2DL2 (+) | 8 (11.9) | 59 (88.1) | 0.33 |
KIR2DL2 (–) | 12 (17.9) | 55 (82.1) | |
KIR2DL3 (+) | 20 (17.9) | 92 (82.1) | 0.03 |
KIR2DL3 (–) | 0 | 22 (100) | |
KIR2DL5 (+) | 9 (14.7) | 52 (85.3) | 0.95 |
KIR2DL5 (–) | 11 (15.1) | 62 (84.9) | |
KIR2DS1 (+) | 8 (16) | 42 (84) | 0.78 |
KIR2DS1 (–) | 12 (14.3) | 72 (85.7) | |
KIR2DS2 (+) | 8 (11.8) | 60 (88.2) | 0.29 |
KIR2DS2 (–) | 12 (18.2) | 54 (81.8) | |
KIR2DS3 (+) | 3 (7.7) | 36 (92.3) | 0.13 |
KIR2DS3 (–) | 17 (17.9) | 78 (82.1) | |
KIR2DS4del e × 5 (+) | 16 (15.5) | 87 (84.5) | 0.71 |
KIR2DS4del e × 5 (–) | 4 (12.9) | 27 (87.1) | |
KIR2DS4fl e × 5 (+) | 7 (11.7) | 53 (88.3) | 0.34 |
KIR2DS4fl e × 5 (–) | 13 (17.6) | 61 (82.4) | |
KIR2DS5 (+) | 6 (16.2) | 31 (83.8) | 0.79 |
KIR2DS5 (–) | 14 (14.4) | 83 (85.6) | |
KIR3DS1 (+) | 6 (12.8) | 41 (87.2) | 0.6 |
KIR3DS1 (–) | 14 (16.1) | 73 (83.9) | |
KIR3DL1 (+) | 18 (14.5) | 106 (85.5) | 0.63 |
KIR3DL1 (–) | 2 (20) | 8 (80) | |
KIR2DP1 (+) | 20 (15.6) | 108 (84.4) | 0.29 |
KIR2DP1 (–) | 0 | 6 (100) | |
KIR genotype and rate of BK polyomavirus–associated nephropathy (univariable analysis)
Univariable logistic regression analysis revealed no significant difference in the other KIR gene frequencies between the PyVAN(+) and PyVAN(–) groups. The recipients were also stratified according to the number of either activating or inhibitory KIRs in their genomes. No significant differences were found between the PyVAN(+) and PyVAN(–) patients for the frequencies of the single activating and inhibitory KIR genes (Table 2). Combinatorial frequency of the KIR genes with their HLA class I ligands was also compared to determine whether certain receptor‑ligand combinations influence the development of PyVAN. We noted a higher incidence of PyVAN in the recipients who carried KIR2DL3 in the presence of its ligand HLA‑C1, as compared with the recipients who carried KIR2DL3 in the absence of its ligand (19.5% vs 7.7%, respectively, P = 0.06) (Table 2). With regard to the other receptor‑ligand combinations, the univariable analysis did not reveal significant associations between certain KIR/HLA matches and posttransplant PyVAN.
Factors other than KIR that affect posttransplant BK polyomavirus–associated nephropathy
Univariable logistic regression analysis was performed also to examine factors that could potentially impact the posttransplant occurrence of PyVAN. We analyzed age, sex, number of kidney transplants, type of donor, type of transplant, panel reactive antibodies, acute rejection episodes before PyVAN, HLA mismatch, lymphocyte count, leukocyte count, VGCV prophylaxis, and induction therapy. Of these factors, male sex (P = 0.04) and the absence of antiviral prophylaxis with VGCV (P = 0.01) were significant. We also performed the univariable logistic regression analysis that examined ABMR and TCMR separately, eGFR, and the time from the transplantation procedure to PyVAN occurrence. None of the other variables was associated with PyVAN (Table 4).
Characteristics | PyVAN(+) | PyVAN(–) | P value | ||
Age, y, mean (SD) | 49.6 (14.5) | 47.5 (14.4) | 0.23 | ||
Sex, n (%) | Male | 17 (19.5) | 70 (80.5) | 0.04 | |
Female | 3 (6.4) | 44 (93.6) | |||
Number of kidney transplants, n (%) | 1 | 16 (14.1) | 97 (85.8) | 0.72 | |
2 | 4 (20) | 16 (80) | |||
3 | 0 | 1 (100) | |||
Type of transplant, n (%) | Kidney | 19 (14.7) | 110 (85.3) | 0.77 | |
Kidney + pancreas | 1 (25) | 3 (75) | |||
Kidney + heart | 0 | 1 (100) | |||
Type of donor, n (%) | Deceased | 19 (15.3) | 105 (84.7) | 0.64 | |
Living | 1 (10) | 9 (90) | |||
Acute rejection before PyVAN, n (%) | Yes | 39 (90.7) | 4 (9.3) | 0.1 | |
No | 61 (79.2) | 16 (20.8) | |||
PRA max, %, median (IQR) | 7.6 (0–90) | 8.6 (0–100) | 0.35 | ||
HLA mismatch, n (%) | ≤3/6 | 9 (15.3) | 50 (84.7) | 0.92 | |
>3/6 | 11 (14.7) | 64 (85.3) | |||
Lymphocyte blood count before PyVAN, 109/l, n (%) | <0.8 | 8 (14.5) | 47 (85.5) | 0.77 | |
≥0.8 | 11 (16.4) | 56 (83.6) | |||
Leukocyte blood count before PyVAN, 109/l, n (%) | <4.1 | 13 (16.7) | 65 (83.3) | 0.5 | |
≥4.1 | 7 (12.5) | 49 (87.5) | |||
VGCV before PyVAN, n (%) | Yes | 3 (50) | 3 (50) | 0.01 | |
No | 17 (12.6) | 111 (87.4) | |||
Induction therapy, n (%) | |||||
Basiliximab | Yes | 10 (14.1) | 61 (85.9) | 0.77 | |
No | 10 (15.9) | 53 (84.1) | |||
Thymoglobulin | Yes | 2 (15.4) | 11 (84.6) | 0.96 | |
No | 18 (14.9) | 103 (85.1) | |||
Basiliximab or thymoglobulin | Yes | 12 (14.3) | 72 (85.7) | 0.95 | |
No | 8 (16) | 42 (84) | |||
Independent risk factors for posttransplant BK polyomavirus–associated nephropathy (multivariable analysis)
The multivariable analysis included all clinical variables and individual KIR genes and their HLA ligands that were analyzed in the univariable analyses. The maximum model to be considered was identified. The optimal subset of variables was then selected, and their reliability was assessed. The multivariable analysis revealed that the presence of KIR2DL3 was an independent risk factor for posttransplant PyVAN (Table 5).
Discussion
We analyzed the relationship between KIR genotypes and posttransplant PyVAN in a cohort of 134 recipients of kidney transplants. The key finding of our study was the association between the presence of the inhibitory KIR2DL3 and posttransplant PyVAN. The presence of KIR2DL3 (odds ratio [OR], = 4.61; P = 0.05) was associated with the risk of PyVAN among kidney transplant recipients.
Previous studies showed that different levels of susceptibility to BKPyV may be attributable to variations of the KIR receptors and consequently the repertoire of NK cells.
Trydzenskaya et al21 were the first to define the role of KIRs in the pathogenesis of PyVAN. Their analysis of individual receptors revealed significantly lower frequencies of the activating receptor KIR3DS1 in the the PyVAN(+) patients than in the controls, suggesting a protective effect of activating KIRs and the genetic predisposition to PyVAN on NK cell level.21 A lower number of activating KIRs among the PyVAN(+) patients was later confirmed in another study,22 but no difference in any particular activating KIR gene frequency was observed. The authors also confirmed that the KIR A/A haplotype was more frequent in PyVAN.22 In another study of 103 kidney transplant recipients,23 an analysis of the recipients’ KIR and donors’ HLA genotypes in a missing‑self context did not suggest that the absence of HLA ligands for KIR inhibitory receptors or a high number of activating KIRs were associated with a significant reduction in the incidence of BKPyV replication.23 With regard to infections other than PyVAN, a growing body of evidence suggests that the severity of their course correlates with certain KIR genotypes.
The present results are consistent with a previous analysis24 of KIR and HLA genotypes, suggesting that KIR2DL3 (OR, 0.610; P = 0.03), with or without the HLA‑C1 ligand and Cen‑A haplotype, is associated with chronic hepatitis C virus (HCV) infection. The authors suggested that KIR2DL3 in combination with HLA‑C1 or C1C1 contributes to a failure of spontaneous clearance of HCV when the effect of IL28B is considered. This observation was confirmed by other researchers.25,26 Several studies also linked KIR2DL3 with the spontaneous resolution of HCV infection.27 Nevertheless, this protective effect has been shown only among individuals who were homozygous for KIR2DL3 and not among KIR2DL2/KIR2DL3 heterozygotes. The discrepant findings of the earlier reports were explained by the route of HCV infection and viral load of HCV. Another possible explanation of this discrepancy might be the presence of highly deleterious single‑nucleotide polymorphisms of the KIR2DL3 gene that suggest notable changes in the protein secondary structure, instability, and conservation. These factors could affect KIR function and susceptibility to viral infections.28 Similarly to our findings, the absence of the KIR2DL3 gene prevented HIV‑infected patients from contracting tuberculosis.29 The authors suggested that the presence of activating KIRs, together with the lack of inhibitory KIRs (KIR2DL3 + HLA‑C1/C2 and KIR2DL1 + HLA‑C1/C2), might modulate the NK cell response. Likewise, a recent study by our group showed that the lack of KIR2DS2, the presence of KIR2DL3, and the presence of KIR2DL2–HLA‑C1 were risk factors for posttransplant CMV infection.30 Few studies have been designed to assess the issue of CMV prevention in the context of risk factors for PyVAN. A post hoc analysis of data from 2 prior studies on CMV prevention sought to address potential interactions between antiviral prophylaxis and BKPyV events. The authors showed that the risk of BKPyV viremia increased in patients who received VGCV prophylaxis.31 Extending this finding, we investigated whether anti‑CMV therapy is associated with a higher risk of PyVAN in our cohort. Interestingly, in the present study, a lower incidence of posttransplant PyVAN was observed in the patients with no anti‑CMV antiviral prophylaxis, based on univariable and multivariable analyses. Importantly, tacrolimus and cyclosporine trough levels and steroid dose did not differ between the patients with and without PyVAN. Moreover, large prospective trials that evaluated VGCV prophylaxis vs a preemptive therapy did not observe an increased risk of BKPyV infection in the prophylaxis groups.32,33
The possible explanation of our finding is that the lower incidence of PyVAN in the patients with no anti‑CMV prophylaxis is based on the fact that VGCV may have an immunosuppressive effect by suppressing T cell proliferation. In the absence of VGCV, there is no additional bone marrow suppression, and therefore the risk of PyVAN is lower.
Finally, in the multivariable analysis, we confirmed the previously reported and widely recognized association between male sex, age, acute rejection episodes, and the onset of PyVAN.34-37 The present study has some limitations, mainly concerning the limited sample size, the lack of information about the expression of KIRs, the lack of analyses on NK cell subsets expressing the KIRs most relevant for PyVAN development, and the lack of matched‑pair randomized groups of recipients.
In summary, our results suggest that genotyping recipients for the KIR2DL3 gene may help predict the occurrence of posttransplant PyVAN. Other factors, such as male sex, the absence of antiviral prophylaxis, and acute rejection episodes, were independent predictive factors for the occurrence of PyVAN. The results of our study may be important for clinical practice. Further interventional studies are needed to translate these potentially relevant markers into pre- and posttransplant screening and treatment modalities.
- Kean JM, Rao S, Wang M, Garcea RL. Seroepidemiology of human polyomaviruses. PLoS Pathog. 2009; 5: e1000363. | Crossref
- Helle F, Brochot E, Handala L, et al. Biology of the BKPyV: an update. Viruses. 2017; 9: E327. | Crossref
- Hirsch HH, Randhawa P; AST Infectious Diseases Community of Practice. BK polyomavirus in solid organ transplantation. Am J Transplant. 2013; 13: 179‑188. | Crossref
- Johnston O, Jaswal D, Gill JS, et al. Treatment of polyomavirus infection in kidney transplant recipients: a systematic review. Transplantation. 2010; 89: 1057‑1070. | Crossref
- Thangaraju S, Gill J, Wright A, et al. Risk factors for BK polyoma virus treatment and association of treatment with kidney transplant failure: insights from a paired kidney analysis. Transplantation. 2016; 100: 854‐861. | Crossref
ARTICLE INFORMATION