The role of artificial intelligence technology analysis of high-resolution computed tomography images in predicting the severity of COVID-19 pneumonia
Key words: artificial intelligence, COVID-19, high-resolution computed tomography


 CC BY-NC-SA 4.0
The role of artificial intelligence technology analysis of high-resolution computed tomography images in predicting the severity of COVID-19 pneumonia
Introduction: High‑resolution computed tomography (HRCT) is usually used only for qualitative analysis of COVID‑19 pneumonia. However, when coupled with artificial intelligence (AI) it can also automatically provide quantitative data.
Objectives: The purpose of the study was to analyze the role of automatic assessment of COVID‑19 pneumonia severity on HRCT images by AI technology.
Patients and methods: We retrospectively studied medical records of consecutive patients admitted to the Krakow University Hospital due to COVID‑19. Of the 1729 patients, 804 underwent HRCT with automatic analysis of such radiological parameters as absolute inflammation volume, absolute ground glass volume, absolute consolidation volume (ACV), percentage inflammation volume, percentage ground glass volume, percentage consolidation volume (PCV), and severity of pneumonia classified as none, mild, moderate, or critical.
Results: The automatically assessed radiological parameters correlated with the clinical parameters that reflected the severity of pneumonia (P <0.05). The patients with critical pneumonia, as compared with mild or moderate one, were more frequently men, had significantly lower oxygen saturation, higher respiratory rate, higher levels of inflammatory markers, as well as more common need for mechanical ventilation and admission to the intensive care unit. They were also more likely to die during hospitalization. Notably, as determined by the receiver operating characteristic curve analysis, radiological parameters above or equal to the cutoff points were independently associated with in‑hospital mortality (ACV odds ratio [OR], 4.08; 95% CI, 2.62–6.35; PCV OR, 4.05; 95% CI, 2.60–6.30).
Conclusions: Using AI to analyze HRCT images is a simple and valuable approach to predict the severity of COVID‑19 pneumonia.
What's new?
In patients with pneumonia, the assessment of chest high‑resolution computed tomography (HRCT) images performed by radiologists typically results only in qualitative analysis of the extent of the disease. Meanwhile, artificial intelligence (AI) can automatically analyze not only the presence, but also the volume and structure of inflammatory lesions in a quantitative manner, providing objective parameters of the dynamics of pneumonia. The main innovation of our work is the use of AI‑automated analysis of HRCT in COVID‑19 patients. It means that the assessment of the degree of lung involvement is not a time‑consuming task performed manually by radiologists, but it is performed automatically with results available within minutes after a scan. Such a rapid analysis can also predict the severity of future clinical disorders and in‑hospital death from COVID‑19.
Introduction
In the early phase of the COVID‑19 pandemic, attempts were made to use chest high‑resolution computed tomography (HRCT) to confirm positive cases, especially with a large number of patients and limited access to polymerase chain reaction (PCR) test.1 Unfortunately, the specificity of the HRCT assessment is insufficient due to the same symptoms of pneumonia caused by other etiological factors.
For this reason, radiological societies (American College of Radiology, British Thoracic Imaging Society) state in their current guidelines that HRCT cannot be used as a screening tool, nor as a first‑line test of SARS‑CoV‑2 infection.2,3 The gold standard for verification of COVID‑19 is a PCR test of a pharyngeal or nasopharyngeal swab. However, in line with the above recommendations, HRCT can be used in cases of complications in patients with confirmed SARS‑CoV‑2 infection.
The frequency of pneumonia in patients with COVID‑19 currently depends on many factors, including the level of vaccination and the subsequent type of the virus mutation. It was found that the symptoms of pneumonia confirmed by HRCT are present in approximately 80% of unvaccinated patients.4 In about 10% of cases, the course of the disease is so severe that it requires admission to an intensive care unit (ICU).5
A software that automatically detects and assesses pathological structures on CT or X‑ray scans can be a very useful tool for radiologists.6,7 Therefore, artificial intelligence (AI) techniques currently attract a lot of interest in radiology.
In the initial phase of the COVID‑19 pandemic, the main advantage of automatic assessment of COVID‑19 patients was the potential to evaluate a huge number of images in a short period of time.8 This was especially true for those hospitals that did not have a sufficient number of trained radiologists. However, doubts soon arose about the specificity of the identification of COVID‑19 pneumonia and the need to differentiate it from other causes of pneumonia.8-10Nonetheless, in confirmed SARS‑CoV‑2 infections, a rapid automatic assessment may be a useful method for an objective quantitative analysis of the dynamics of pulmonary infiltrations.11
It turns out that automatic quantification of COVID‑19–induced pulmonary lesions on HRCT can noninvasively and early predict a severe course of the disease.12,13Therefore, the results of the automatic HRCT image assessment in patients with COVID‑19 may be treated as a prognostic factor important for choosing the optimal treatment strategy.
The novel coronavirus constantly mutates, which affects its infectivity, the course of the disease and the virus susceptibility to the available vaccines. Recently, an AI model called PyR0 has been created,14 which uses data from 6.4 million SARS‑CoV‑2 sequences to find mutation patterns promoting the spread of new strains of the virus. It accurately predicted the rise of Omicron’s BA.2 subvariant and the Alpha variant. This can help to plan the optimal strategy for dealing with subsequent pandemic waves.
The purpose of our study was to compare the results of AI analysis of HRCT images in COVID‑19 pneumonia, with clinical data that include the results of laboratory tests evaluating the severity of the inflammation.
Patients and methods
From March 6, 2020 to October 15, 2020, 1729 patients were admitted to the Krakow University Hospital due to COVID‑19, confirmed by PCR from nasopharyngeal swabs, and completed their hospital course (ie, from an admission to a discharge or death). Among them, 812 patients with COVID‑19 pneumonia underwent chest HRCT due to clinical indications related to pneumonia, with evaluation of the degree of lung involvement. In 8 patients in this group, the results of the quantitative lung analysis were inconclusive, so these patients were excluded from further analysis. The median time interval between the hospital admission and HRCT was 4 days (interquartile range [IQR], 1–11 days).
All HRCT examinations were performed using multirow helical scanners (64 or 80 rows), and the following parameters: slice thickness 0.625 mm, 0.75 mm, 1 mm, or 1.25 mm, tube voltage 120 kV, tube current‑time product 100–350 mAs.
For a retrospective analysis of each patient, the HRCT images in Digital Imaging and Communications in Medicine format were sent from the hospital Picture Archiving and Communication System to the processing server in the local hospital network. The AI software YITU CT installed on the server was developed by YITU Healthcare Technology Co., Ltd. (Hangzhou, China) in cooperation with Huawei Technologies Co., Ltd. (Shenzhen, China).15,16
The development and structure of the YITU CT AI software are presented in the article by Pan et al.17 According to the authors, the system consists of 3 different network components: 1) 12 convolutional segments, which include a convolutional layer, a batch normalization layer, and an activation layer; 2) three max‑pooling layers for downsampling; and 3) three transpose convolutional layers for upsampling. The AI software was trained using chest CT images without respiratory artifacts from 942 confirmed COVID‑19 patients and 1340 healthy persons, randomly divided into a training set (75%) and a test set (25%). One hundred training epochs were performed for networking training with a batch size of 8. The Adam algorithm was used for the model optimizer. The ground truth region of interest (GT‑ROI) for lung lesions was first drawn by a radiologist with a 5‑year experience in thoracic radiology and then reviewed and modified if needed by a senior radiologist with a 28‑year experience in thoracic radiology. The Dice coefficient determining the accuracy of the measurement of predicted ROI (PR‑ROI) by AI, with reference to GT‑ROI, was 85% for the training set and 82.08% for the test set.
The YITU CT is commercially available in Asia and Europe, and according to the information from the local representative it has CE certification for its scope. The product meets the provisions of the Council Directive 93/42/EEC on Medical Devices (Class 1, rule 12, medical image management and processing software).
The software was initially used as a trial version and was finally purchased by the Krakow University Hospital.
In our study, the analysis of the images was performed fully automatically by YITU CT AI, in the same way as already described in our previous publication.10
The final report (Figure 1) included, among others:
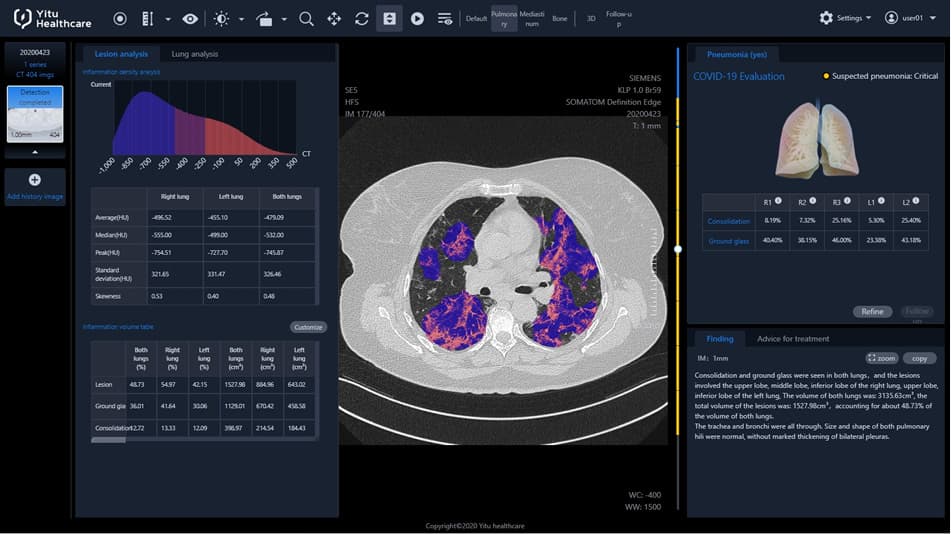
1 inflammation CT density histogram, the values of average, median, and peak CT density for the inflammation regions in the right, left, and both lungs;
2 volume of inflammation, absolute value in cm3 and as a percentage of the entire lung tissue, for the right, left, and both lungs;
3 within the volume of the inflammation as above, distinction into ground glass and consolidation (inflammation volume = ground glass volume + consolidation volume), absolute value in cm3 and as a percentage of the entire lung tissue, for the right, left, and both lungs;
4 HRCT images with inflammation regions marked in color;
5 volume of the inflammation as a percentage of the entire lung tissue, with distinction between ground glass and consolidation, independently for every lung lobe, additionally with a pseudo 3D graphic presentation;
6 estimated risk of pneumonia, assessed by AI software, based on CT evaluation, reported as none, mild, moderate, or critical (suspected pneumonia);
7 preprepared text of the radiological report.
All the evaluation results could be exported from the server into an Excel spreadsheet.
In this study, only the following radiological parameters were analyzed in each patient, for both lungs together: absolute inflammation volume (AIV, cm3), absolute ground glass volume (AGV, cm3), absolute consolidation volume (ACV, cm3), percentage inflammation volume (PIV) (inflammation volume as percent of the lung volume), percentage ground glass volume (PGV) (ground glass volume as percent of the lung volume), and percentage consolidation volume (PCV) (consolidation volume as percent of the lung volume).
Clinical data were obtained from the hospital database and included age, sex, the presence of comorbidities such as cardiovascular disease (CVD), chronic kidney disease (CKD), history of preexisting chronic lung disease (CLD), history of cancer, admission parameters: respiratory rate, oxygen saturation, high‑sensitivity C‑reactive protein (hsCRP), D‑dimer, interleukin 6, white blood count, neutrophil count, lymphocyte count, serum ferritin, lactate dehydrogenase; parameters of clinical course: in‑hospital death, mechanical ventilation, ICU admission, length of hospital stay, treatment with remdesivir, dexamethasone, and anticoagulants (heparin, vitamin K antagonists, non‑vitamin K oral anticoagulants) in the course of the disease.
The treatment algorithm was in accordance with the recommendations of that time, presented by the Polish Association of Epidemiologists and Infectiologists.18,19
The therapeutic strategy has evolved over time, as presented in updates of the above recommendations,20-22 as well as by Patrucco et al23 in their review article.
The study was approved by the local bioethics committee (approvals 1072.6120.279.2020, 1072.6120.333.2020, and 1072.6120.363.2020). Patient consent was waived by the local bioethics committee due to the retrospective assessment of CT images.
Statistical analysis
We used SAS software, version 9.3 (SAS Institute, Cary, North Carolina, United States), for database management and statistical analysis.
At the first stage, we analyzed the presence of correlations between the radiological parameters of lung involvement with inflammation and the clinical parameters on admission, as previously, in the entire study group. Due to non‑normal distributions, the correlations between quantitative variables were evaluated with the Spearman correlation coefficient.
Then, we studied the radiological parameters of the lung involvement, clinical parameters on admission, and parameters of the clinical course, independently in subgroups of pneumonia severity, as grouped by AI software. It should be emphasized here that the exact criteria for the above classification into severity subgroups were not available to the user. As a result, 4 subgroups were selected. Differences between those groups were compared using a one‑way analysis of variance for normally distributed and the Kruskal–Wallis test for non‑normally distributed continuous variables (the normality of continuous variable distribution was assessed by the Shapiro–Wilk test). Categorical variables were compared by the χ2 test in FREQ procedure. All post‑hoc analyses were performed using the Bonferroni adjustments. The results were expressed as numerical values and percentages for categorical variables and mean values and SD or median and IQR for continuous variables.
We also analyzed the capability of the radiological parameters of lung involvement to identify the patients with higher risk of in‑hospital death due to COVID‑19 by constructing the receiver operating characteristic (ROC) curve and calculating the area under the ROC curve (AUC) using the Mann–Whitney test in PROC LOGISTIC statement. Then, we estimated the optimal cutoff point for the parameter of interest level to classify the patients with a higher probability of death. We calculated the Youden index (J) as (sensitivity + specificity – 1). After calculating the J value for each sensitivity and specificity, the maximum J value was selected as the Youden index for which the level of the corresponding parameters indicated the cutoff point.
Finally, in the logistic regression analyses, the independent predictors of in‑hospital death were explored. The following variables were included in the model: age (≥ vs <median); sex (men vs women); CVD defined as a history of at least 1 of the following diseases: arterial hypertension, coronary artery disease, heart failure, stroke or atrial fibrillation (present vs absent), CKD (present vs absent), CLD: chronic obstructive pulmonary disease or asthma (present vs absent), AIV (≥ vs <cutoff point). The same models were also constructed for the remaining radiological parameters instead of AIV: AGV, ACV, PIV, PGV, PCV (≥ vs <cutoff point). In all analyses, statistical significance set at a P value below 0.05.
Results
The final statistical analysis involved 804 patients, 295 women, 509 men, 20–100 years old, of mean (SD) age 62.8 (14.8) years, and median age of 64 years.
The median duration of hospitalization was 20 (IQR, 13–31) days, admission to the ICU was needed in 144 patients, with a median stay in the ICU of 16 (IQR, 8–30) days. Overall, in‑hospital mortality was 13.1% (105 of 804 patients).
The results of the correlation analysis between the radiological parameters of lung involvement with inflammation and the clinical parameters on admission, in the entire study group, are presented in Table 1. The highest Spearman correlation coefficients were found for radiological parameters, especially for PIV and LDH (r = 0.52), PGV and LDH (r = 0.52), PIV and hsCRP (r = 0.48), PGV and hsCRP (r = 0.47), AIV and ferritin (r = 0.41), and AGV and ferritin (r = 0.40).
Variable | Spearman rank order correlationsa | |||||||||
Respiratory rate, /min | Oxygen saturation, % | hsCRP, mg/l | D‑dimer, µg/ml | IL‑6, pg/ml | WBC, 103/µl | Neutrophil count, 103/µl | Lymphocyte count, 103/µl | Ferritin, ng/ml | LDH, U/l | |
a All correlations are significant at P <0.05
Abbreviations: ACV, absolute consolidation volume; AGV, absolute ground glass volume; AIV, absolute inflammation volume; hsCRP, high‑sensitivity C‑reactive protein; IL‑6, interleukin 6; LDH, lactate dehydrogenase; PCV, percentage of consolidation volume; PGV, percentage of ground glass volume; PIV, percentage of inflammation volume; WBC, white blood cells | ||||||||||
AIV, cm3 | 0.14 | –0.22 | 0.46 | 0.13 | 0.32 | 0.23 | 0.29 | –0.24 | 0.41 | 0.51 |
AGV, cm3 | 0.13 | –0.22 | 0.44 | 0.11 | 0.31 | 0.22 | 0.28 | –0.22 | 0.40 | 0.50 |
ACV, cm3 | 0.15 | –0.21 | 0.46 | 0.17 | 0.32 | 0.22 | 0.28 | –0.25 | 0.37 | 0.48 |
PIV, % | 0.15 | –0.23 | 0.48 | 0.17 | 0.34 | 0.25 | 0.32 | –0.25 | 0.38 | 0.52 |
PGV, % | 0.14 | –0.23 | 0.47 | 0.15 | 0.33 | 0.25 | 0.32 | –0.24 | 0.38 | 0.52 |
PCV, % | 0.15 | –0.21 | 0.46 | 0.19 | 0.32 | 0.23 | 0.30 | –0.26 | 0.34 | 0.47 |
Table 2 summarizes the radiological parameters of lung involvement, clinical parameters on admission, and clinical course parameters, independently in subgroups of pneumonia severity. As compared with patients with mild or moderate pneumonia, the patients with critical pneumonia were more frequently men, had significantly lower oxygen saturation on admission, had a higher respiratory rate, and higher levels of immune‑inflammatory biomarkers on admission. The need for mechanical ventilation, admission to the ICU, and treatment with remdesivir and dexamethasone were more common in the patients with critical pneumonia than in those with mild or moderate pneumonia.
Characteristics | Pneumonia | P valuea | |||
None (n = 26) | Mild (n = 117) | Moderate (n = 181) | Critical (n = 480) | ||
Data are presented as mean (SD) or median (interquartile range) unless indicated otherwise.
a P for differences between groups
b P <0.05 for difference vs Mild pneumonia group
c P <0.05 for difference vs Moderate pneumonia group
d P <0.05 for difference vs Critical pneumonia group
e P <0.05 for difference vs None pneumonia group
f Data available for: respiratory rate in 587 patients, oxygen saturation in 675 patients, D‑dimer in 781 patients, IL‑6 in 541 patients
Abbreviations: CKD, chronic kidney disease; CLD, chronic lung disease; CVD, cardiovascular disease; ICU, intensive care unit; NOAC, non–vitamin K oral anticoagulants; others, see Table 1 | |||||
Age, y | 52.5 (18.3)b,c,d | 64.8 (14.4)e | 62.0 (15.6)e | 63.2 (14.1)e | 0.02 |
Women, n (%) | 12 (46.1) | 53 (45.3)d | 74 (40.9)d | 156 (32.5)b,c | 0.02 |
CVD, n (%) | 8 (30.8)b,c,d | 86 (73.5)c,e | 106 (58.6)b,d,e | 342 (71.2)c,e | <0.001 |
CKD, n (%) | 2 (7.7) | 11 (9.4) | 20 (11) | 62 (12.9) | 0.62 |
CLD, n (%) | 2 (7.7) | 21 (17.9) | 21 (11.6) | 50 (10.4) | 0.14 |
History of cancer, n (%) | 4 (15.4) | 21 (17.9) | 38 (20.9) | 66 (13.8) | 0.15 |
Radiological parameters | |||||
AIV, cm³ | 0.24 (0.00–0.98)b,c,d | 38.39 (12.76–104.67)c,d,e | 253.37 (128.00–403.28)b,d,e | 1068.45 (667.29–1650.81)b,c,e | <0.001 |
AGV, cm³ | 0.12 (0.00–0.61)b,c,d | 33.06 (9.59–83.27)c,d,e | 201.27 (100.04–324.52)b,d,e | 823.03 (470.64–1300.26)b,c,e | <0.001 |
ACV, cm³ | 0.04 (0.00–0.30)b,c,d | 6.30 (2.16–13.66)c,d,e | 36.94 (23.30–67.52)b,d,e | 246.04 (139.43–393.76)b,c,e | < 0.001 |
PIV, % | 0.01 (0.00–0.02)b,c,d | 0.87 (0.31–2.29)c,d,e | 6.17 (3.67–8.52)b,d,e | 30.64 (17.96–46.41)b,c,e | < 0.001 |
PGV, % | 0.00 (0.00–0.01)b,c,d | 0.74 (0.20–1.94)c,d,e | 4.68 (2.76–6.91)b,d,e | 22.79 (13.44–35.06)b,c,e | < 0.001 |
PCV, % | 0.00 (0.00–0.01)b,c,d | 0.17 (0.04–0.29)c,d,e | 0.87 (0.56–1.56)b,d,e | 6.82 (3.62–11.68)b,c,e | < 0.001 |
Parameters on admission | |||||
Respiratory ratef, /min | 12 (12–14) | 14 (12–16)d | 12 (12–16)d | 16 (12–20)b,c | <0.001 |
Oxygen saturationf, % | 97 (96–98)d | 96 (95–98)d | 95 (94–97)d | 93 (89–96)b,c,e | <0.001 |
hsCRP, mg/l | 7.7 (1.1–47.3)b,c,d | 15.9 (6.1–68.2)c,d,e | 41.8 (15.2–69.2)b,d,e | 79.4 (43.9–141.5)b,c,e | <0.001 |
D‑dimerf, µg/ml | 1.52 (0.64–3.92) | 1.13 (0.445–2.04)d | 1.08 (0.5–2.35)d | 1.25 (0.68–2.99)b,c | 0.001 |
IL‑6f, pg/ml | 31.8 (9.1–47.8) | 23.6 (7.21–54.0)d | 25.1(10.0–49.2)d | 46.8 (18.4–104.2)b,c | 0.001 |
WBC 103/µl | 5.64 (4.13–7.96) | 6.43 (4.30–9.35)d | 5.55 (4.37–7.59)d | 7.45 (5.24–10.53)b,c | 0.01 |
Neutrophil count, 103/µl | 3.46 (1.9–5.21) | 3.97 (2.35–7.0)d | 3.68 (2.69–5.36)d | 5.87 (3.75–8.73)b,c | <0.001 |
Lymphocyte count, 103/µl | 1.05 (0.79–1.58) | 1.21 (0.74–1.58)d | 1.08 (0.75–1.52)d | 0.85 (0.57–1.17)b,c | 0.001 |
Ferritin, ng/ml | 123 (15–309)b,c,d | 251 (119–620)d,e | 523 (239–941)d,e | 809 (419–1411)b,c,e | <0.001 |
LDH, U/l | 192.5 (165–254)c,d | 230 (186–300)d | 271 (214–331)d,e | 383 (278–524)b,c,e | <0.001 |
Clinical course | |||||
In‑hospital death, n (%) | 0 | 8 (6.8)d | 18 (9.9)d | 79 (16.5)b,c | <0.01 |
Mechanical ventilation, n (%) | 0 | 3 (2.6)d | 13 (7.2)d | 98 (20.4)b,c | <0.001 |
ICU admission, n (%) | 0 | 7 (6.0)d | 15 (8.3)d | 122 (25.4)b,c | <0.001 |
Length of hospital stay, d | 16.5 (10–23) | 17 (12–24) | 18 (12–30) | 21 (14–31) | 0.046 |
Remdesivir treatment, n (%) | 0 | 7 (6)d | 20 (11)d | 109 (22.7)b,c | <0.001 |
Dexamethasone treatment, n (%) | 3 (11.5)d | 25 (21.4)d | 61 (33.7)d | 289 (60.2)b,c,e | <0.001 |
Anticoagulants (heparin, vitamin K antagonists, NOAC) treatment, n (%) | 17 (65.4) | 94 (80.3) | 144 (79.6) | 402 (83.8) | 0.09 |
In the ROC analyses, among the studied radiological parameters of lung assessment, the highest predictive values of in‑hospital death from COVID‑19 were found for PCV (AUC = 0.69), ACV (AUC = 0.68), and PIV (AUC = 0.67) (Table 3).
Radiological parameters | AUC | 95% CI | P value | Cutoff point | Sensitivity | Specificity | Youden index |
Abbreviations: AUC, area under the curve; others, see Table 1 | |||||||
AIV, cm³ | 0.64 | 0.58–0.71 | <0.001 | 884 | 0.58 | 0.66 | 0.24 |
AGV, cm³ | 0.63 | 0.57–0.69 | 0.001 | 654 | 0.53 | 0.66 | 0.19 |
ACV, cm³ | 0.68 | 0.62–0.74 | <0.001 | 246 | 0.56 | 0.74 | 0.30 |
PIV, % | 0.67 | 0.61–0.72 | <0.001 | 31.1 | 0.52 | 0.75 | 0.27 |
PGV, % | 0.66 | 0.60–0.71 | <0.001 | 18.4 | 0.59 | 0.67 | 0.26 |
PCV, % | 0.69 | 0.64–0.75 | <0.001 | 8.2 | 0.51 | 0.78 | 0.29 |
The results of multivariable logistic regression analyses for independent predictors of in‑hospital death, concerning in subsequent models the radiological parameters of AIV, AGV, ACV, PIV, PGV, and PCV (≥ vs <cutoff point), and taking into account age, sex, CVD, CKD, and CLD are presented in Table 4. Radiological parameters of lung involvement greater than or equal to the established cutoff points proved to be strong predictors of in‑hospital death.
Radiological parameters | OR (95% CI) | P value |
a Along with the parameter of quantitative assessment of lung lesions, each model includes age, sex, cardiovascular disease (defined as a history of at least 1 of the following diseases: arterial hypertension, coronary artery disease, heart failure, stroke, or atrial fibrillation), chronic kidney disease, history of preexisting chronic lung diseases (ie, chronic obstructive pulmonary disease or asthma), and 1 of the radiological parameters (≥ vs <cutoff point as assessed in receiver operating characteristic curve—see Table 3).
Abbreviations: OR, odds ratio; others, see Table 1 | ||
AIV, cm3 | 3.06 (1.95–4.79) | <0.001 |
AGV, cm3 | 2.33 (1.50–3.62) | <0.001 |
ACV, cm3 | 4.08 (2.62–6.35) | <0.001 |
PIV, % | 3.67 (2.36–5.71) | <0.001 |
PGV, % | 3.01 (1.95–4.64) | <0.001 |
PCV, % | 4.05 (2.60–6.30) | <0.001 |
In particular, we found that ACV greater than or equal to the cutoff point of 246 cm3 was associated with a higher risk of in‑hospital death with odds ratio (OR) of 4.08. The other ORs were 2.92 for age (≥ median 64 years), 1.04 for sex (men), 1.04 for present CVD, 1.52 for present CKD, and 0.61 for present CLD.
Next, PCV greater than or equal to the cutoff point of 8.2% was associated with a higher risk of in‑hospital death with OR of 4.05, with OR accounting for age (≥ median 64 years) 3.00, for sex (men) 1.20, for present CVD 1.0, present CKD 1.49, and present CLD 0.6.
Discussion
In the initial assessment of patients with COVID‑19, it is important to establish the factors influencing possible further course of the disease. Kanecki et al24 in a study based on data from a national hospital register including 8252 patients, looked for differences between the survivors and nonsurvivors of COVID‑19. These data may be helpful in identifying patients requiring special medical care and preventive measures during hospitalization.
In our work, we found that the radiological parameters of lung involvement, automatically assessed by AI technology, correlated with laboratory markers of inflammation, and especially in the case of ACV and PCV, were strong predictors of in‑hospital death due to COVID‑19.
Shen et al25 analyzed the clinical characteristics of 36 patients with COVID‑19 on admission and CT scored by 2 radiologists using the method described by Chung et al26 to evaluate the extent of the lung involvement. The degree of involvement of each of the 5 lung lobes was assessed and classified as none (0%), score 0; minimal (1%–25%), score 1; mild (26%–50%), score 2; moderate (51%–75%), score 3; or severe (76%–100%), score 4. An overall lung total severity score was reached by summing up the 5 lobe scores (range of possible scores, 0–20).26 Shen et al25 found that the extent of lung inflammation (CT score) correlated positively with neutrophil count (r = 0.385) and negatively with lymphocyte count (r = –0.495). This is in line with our results, as we found a positive correlation between the radiological parameters of lung involvement and neutrophil count (r, 0.28–0.32) and a negative correlation between the radiological parameters of lung involvement and lymphocyte count (r, –0.22 to –0.26).
Francone et al27 evaluated COVID‑19 pneumonia in 130 patients, using a slightly different semiquantitative CT severity scoring method proposed by Pan et al.28 In this method, the score from 0 to 5 (0 no involvement; 1, <5% involvement; 2, 5%–25% involvement; 3, 26%–50% involvement; 4, 51%–75% involvement; and 5, >75% involvement) was calculated for each of the 5 lobes and the resulting global CT score (0 to 25) was the sum of each individual lobar score.28 In the study of Francone et al27, CT score significantly correlated with CRP (r = 0.6204) and D‑dimer (r = 0.6625) levels. A CT score greater than or equal to 18 was associated with an increased mortality risk and was found to be predictive of death both in univariate analysis (hazard ratio [HR], 8.33; 95% CI, 3.19–21.73; P <0.001) and in multivariable analysis (HR, 3.74; 95% CI, 1.10–12.77; P = 0.03). In our study, the correlation between the radiological parameters of lung involvement and CRP was slightly weaker (r, 0.44–0.48), while the correlation between the radiological parameters of lung involvement and D‑dimer was much weaker (r, 0.11–0.19). We also confirmed that the radiological parameters of lung involvement greater than or equal to the established cutoff points proved to be strong predictors of in‑hospital death, in particular the parameters related to consolidation volume, that is, ACV greater than or equal to the cutoff of 246 cm3 (OR, 4.08) and PCV greater than or equal to the cutoff of 8.2% (OR, 4.05). Higher values of OR for the parameters related to consolidation volume, as compared with absolute volume, and ground glass volume, may be due to a larger volume of inactive pulmonary parenchyma and a higher risk of progression to fibrosis.
Wang,29 who investigated a group of 27 patients with COVID‑19, collected their admission CRP levels and measured the diameter of the largest lung lesion on CT scans. In the subgroups depending on clinical symptoms (mild, moderate, severe, and critical), the mean values were, respectively, 1.52 mg/l, 16.76 mg/l, 54.15 mg/l, and 105 mg/l for CRP, and 1.23 cm, 2.94 cm, 9.15 cm, and 17 cm for the lesion diameter. In our study, we also observed a positive correlation between the radiological parameters of lung involvement and CRP (r, 0.44–0.48), with median CRP values in subsequent severity subgroups of 7.7 mg/l, 15.9 mg/l, 41.8 mg/l, and 79.4 mg/l, respectively.
On the other hand, Carubbi et al30 evaluated clinical data of 61 patients with COVID‑19, including laboratory tests and the extension of pulmonary involvement in HRCT, using 2 semiquantitative scoring systems. In score A, every lobe was scored on a scale of 0 to 3 (0: no lesion, 1: <one‑third of the lobe volume involved, 2: >one‑third and <two‑thirds of the lobe volume involved, 3: >two‑thirds of the lobe volume involved). In score B, every lobe was assessed for its degree of involvement and classified as none (0%), score 0; minimal (1%–25%), score 1; mild (26%–50%), score 2; moderate (55%–75%), score 3; or severe (76%–100%), score 4. An overall lung total severity score was reached by summing up the 5 lobe scores (score A range of possible scores, 0–15; score B range of possible scores, 0–20). Among the markers of inflammation analyzed, Carubbi et al30 found the highest correlation coefficients between CT scores and CRP (score A, r = 0.532; score B, r = 0.473), ferritin (score A, r = 0.529; score B, r = 0.548), LDH (score A, r = 0.518; score B, r = 0.564). This is in line with our results, as we found the highest correlation coefficients between radiological parameters and CRP (r, 0.44–0.48), ferritin (r, 0.34–0.41), and LDH (r, 0.47–0.52). Interestingly, Carubbi et al30 demonstrated that ferritin levels above the 25th percentile are associated with severe pulmonary involvement as detected on a CT scan but not with the disease outcome.
The main innovation of our work is the use of AI‑automated HRCT analysis. It means that the assessment of the degree of lung involvement is not a time‑consuming task performed manually by radiologists using different available scoring systems, but it is performed automatically with results available within minutes after a CT scan.
Work on the development of this technology has already been carried out in several centers, but the published results concern a much smaller group of patients than in our study.11-13,31
Liu et al12 used YITU CT software to analyze HRCT images of 134 patients with COVID‑19, of whom 19 (14.2%) developed severe form of the disease. The exams were performed on the day of admission and 4 days after the admission. AI assessment included the percentage volume of ground glass, the percentage volume of semi‑consolidation, and the percentage volume of consolidation in both lungs.
Liu et al12 found that CT features, adjusted for age and sex, on day 4 and in terms of changes from day 0 to day 4, outperformed Acute Physiology and Chronic Health Evaluation, neutrophil‑to‑lymphocyte ratio, and D‑dimer in the prediction of severe illness. The HR for PGV was 1.39 (95% CI, 1.05–1.84; P = 0.02) and for PCV it was 1.67 (95% CI, 1.17–2.38; P = 0.005). It cannot be directly compared to our results because of a different end point (severe illness in the study by Liu and in‑hospital death in our study), and because of a different study protocol (2 CT exams in Liu’s research and a single CT in our work).
Pang et al31 also used YITU CT software to perform an automatic HRCT image analysis in 140 patients with COVID‑19, including the assessment of the percentage volume of inflammation, the percentage volume of ground glass, and the percentage volume of consolidation.
In their study, percentage inflammation volume with a cutoff value of 22.6% was the most effective in predicting critical illness (defined as a composite of admission to the ICU, respiratory failure that required mechanical ventilation, shock, or death), with an AUC of 0.868, sensitivity of 81.3%, and specificity of 80.6%. Percentage inflammation volume showed a moderately positive correlation with neutrophil count (r = 0.535), erythrocyte sedimentation rate (r = 0.567), D‑dimer (r = 0.444), hsCRP (r = 0.495), aspartate aminotransferase (r = 0.410), LDH (r = 0.644), and urea nitrogen (r = 0.439), and a moderately negative correlation with lymphocyte count (r = −0.535). The above results of the correlation analysis are similar to those obtained by us.
Another use of YITU CT software was presented by Ding et al.13 In their study including 156 COVID‑19 patients, of whom in 39 the disease was clinically assessed as critical, 7 quantitative CT parameters, representing the lung volume percentages at different density intervals, were automatically calculated using AI. The density interval from –200 to 60 Hounsfield units showed the best performance in prediction of the critical disease (AUC = 0.808; 71.79% sensitivity and 84.62% specificity for the cutoff value of 5.93%). We also had the possibility of obtaining volume percentages at different density intervals, calculated by AI, but they were not included in our study.
YITU CT software was also used in our previous work10 comparing the results of an automatic assessment of HRCT by AI in 3 subgroups: pneumonia in the course of COVID‑19, bronchopneumonia, and atypical pneumonia. We concluded that a partial overlap, particularly between COVID‑19 pneumonia and atypical pneumonia, may limit the usefulness of the automatic analysis in differentiating the etiology of the disease.
Stasiow et al,32 in a study including 128 patients with COVID‑19 pneumonia, used another AI software SyngoVia VB30A CT Pneumonia Analysis (Siemens Healthcare, Erlangen, Germany) to automatically calculate the percentage changes in the amount of the affected lung tissue with a division into individual lobes of both lungs. The percentage of lung tissue involvement, chest CT score, and total opacity score were found to be independent predictors of a hospitalization in the ICU, a need for artificial ventilation, and death.
Especially after taking into account the demonstrated radiological parameters of lung involvement as strong predictors of in‑hospital death, such an automatic analysis can and should become a method used in everyday practice.
Our study has several weaknesses. A retrospective design is an important limitation, although we prospectively collected data using a COVID‑19 registry. We also cannot assess the accuracy of the measurement of inflammation volume by the AI system because we did not use a different independent assessment (manual segmentation or another AI system). The criteria for the classification of pneumonia into severity subgroups by AI were not available to the user. Moreover, in some patients, inflammatory changes in the lungs could be caused not only by COVID‑19, but also by co‑infections of a different etiology. Furthermore, the software was unable to distinguish between inflammatory consolidations and pulmonary changes due to other factors, such as pulmonary embolism.
The delay between hospital admission and HRCT (the median time interval, 4 days) could potentially affect the results, in particular due to the implemented treatment.
However, the majority of HRCT exams in our study were performed to determine the severity of lung involvement, before treatment modification depending on the imaging results.
In summary, automatic analysis of HRCT images by AI may be a valuable method for predicting the severity of COVID‑19 pneumonia. Radiological parameters of lung involvement due to inflammation correlate with laboratory markers of inflammation, and especially ACV and PCV are strong predictors of in‑hospital death from COVID‑19. Automatic classification into pneumonia severity groups based on CT enables the prediction of the severity of clinical disorders.
- Li M, Lei P, Zeng B, et al. Coronavirus disease (COVID‑19): spectrum of CT findings and temporal progression of the disease. Acad Radiol. 2020; 27: 603‑608. | Crossref
- American College of Radiology. ACR Recommendations for the use of chest radiography and computed tomography (CT) for suspected COVID‑19 infection. March 11, 2020. https://www.acr.org/Advocacy‑and‑Economics/ACR‑Position‑Statements/Recommendations‑for‑Chest‑Radiography‑and‑CT‑for‑Suspected‑COVID19‑Infection. Accessed October 17, 2021.
- Rodrigues J, Hare S, Edey A, et al. An update on COVID‑19 for the radiologist ‑ a British Society of Thoracic Imaging statement. Clin Radiol. 2020; 75: 323‑325. | Crossref
- Schiebler M, Bluemke D. Seeing is believing: COVID‑19 vaccination leads to less pneumonia at chest CT. Radiology. 2022; 303: 693‑695. | Crossref
- Terlecki M, Wojciechowska W, Klocek M, et al. Association between cardiovascular disease, cardiovascular drug therapy, and in‑hospital outcomes in patients with COVID‑19: data from a large single‑center registry in Poland. Kardiol Pol. 2021; 79: 773‑780. | Crossref
ARTICLE INFORMATION