Ultrasound- and biomarker-based assessment of hepatic steatosis in patients with severe obesity
Key words: biomarkers, fatty liver disease, hepatorenal index, obesity, ultrasound


 CC BY-NC-SA 4.0
Ultrasound- and biomarker-based assessment of hepatic steatosis in patients with severe obesity
Introduction: Nonalcoholic fatty liver disease (NAFLD) is a common liver abnormality, but its noninvasive diagnosis in patients with severe obesity remains difficult.
Objectives: Our aim was to investigate the usefulness of the ultrasound‑based hepatorenal index (HRI) technique and 2 biomarker‑based methods, including the hepatic steatosis index (HSI) and NAFLD logit score for the diagnosis of NAFLD in patients referred for bariatric surgery.
Patients and methods: A total of 162 patients, including 106 with NAFLD, admitted for bariatric surgery participated in the study. Fat fraction level and the presence of NAFLD were determined using surgical liver biopsy. Each patient underwent liver ultrasound examination and blood tests to determine the HRI, HSI, and NAFLD logit score.
Results: For the NAFLD diagnosis, the HRI, HSI, and NAFLD logit score techniques achieved areas under the receiver operating characteristic curves of 0.879, 0.577, and 0.825, respectively. The Spearman correlation coefficients between the liver fat fraction values and the HRI, HSI, and NAFLD logit score were equal to 0.695, 0.215, and 0.595, respectively. The optimal cutoff values for the NAFLD diagnosis for the HRI, HSI, and NAFLD logit score were equal to 1.12, 56.1, and 0.59, respectively, and significantly differed from the cutoff values reported for the general population in the literature.
Conclusions: Our study confirmed the usefulness of only 2 out of 3 techniques, the HRI and the NAFLD logit score for the diagnosis of NAFLD in patients with severe obesity. The methods designed for the general population require different cutoff values to achieve accurate performance in patients with severe obesity.
What's new?
Nonalcoholic fatty liver disease (NAFLD) is among the most common liver abnormalities. Various methods based on ultrasound imaging and clinical biomarkers have been proposed for the noninvasive diagnosis of the FLD in the general population. However, the usefulness of these methods for the patients with severe obesity has not been adequately investigated yet. In this work, we compare the FLD classification performance of the ultrasound hepatorenal index technique, the hepatic steatosis index, and the NAFLD logit score technique in patients with severe obesity. Our results demonstrate that the investigated methods require adjustments in order to work well in the patients with severe obesity. Our study also indicates that the ultrasound hepatorenal index method outperforms the biomarker‑based techniques.
Introduction
The increasing prevalence of obesity has become a major public health concern.1,2 Obesity is defined as a body mass index (BMI) greater than or equal to 30 kg/m2, and it is regarded as a major preventable risk factor for morbidity and mortality.3,4 Complications resulting from obesity may account for 5% to 15% of all deaths.5
Nonalcoholic fatty liver disease (NAFLD) is a common liver disease present in a large percent of people with obesity.6-8 NAFLD is related to various health complications, from simple hepatic steatosis and nonalcoholic steatohepatitis (NASH), to cirrhosis, hepatocellular carcinoma, and even death.8-11 The patients with severe obesity referred for bariatric surgery belong to a high‑risk group for NAFLD.12 Severe obesity is recognized in patients with BMI equal to or greater than 40 kg/m2 or in patients with BMI greater than 35 and at least 1 serious obesity‑related health condition.13 Obesity status should be considered when designing effective treatments for the prevention of hepatic steatosis.14 Nowadays, the continuous expansion of the treatment options for patients with liver diseases requires accurate initial characterization of the liver structure and function, especially in the presence of NAFLD.15 This is particularly important in patients with severe obesity. A definitive diagnosis of NAFLD is based on a histopathological analysis. However, in clinical practice, liver biopsy with histological assessment of the liver tissue is rarely performed due to its invasive nature, potential complications, and high cost. Other methods of screening for FLD, such as computed tomography and magnetic resonance imaging, have limited availability for large populations.10 Accordingly, an approach incorporating a feasible, safe, and widely available screening technique for NAFLD diagnosis would be important. Ultrasound imaging is usually preferred for screening due to its safety, availability, and relatively low cost. However, when using traditional imaging criteria, the accuracy of ultrasound‑based diagnosis of NAFLD in patients with severe obesity is limited, mostly because it is difficult to acquire high‑quality images.16 In recent years, to improve the ultrasound quantitative assessment of the liver fat, the hepatorenal index (HRI) approach has been developed and applied for the patients assessed for liver steatosis.17-24 The goal of the HRI approach is to compare the echogenicity of the liver and the echogenicity of the kidney cortex. Normal liver and renal tissues show similar echogenicity in healthy individuals. However, brightness of the liver is higher than that of the kidney in the presence of liver steatosis. Therefore, HRI proportionally increases with the liver fat accumulation.
Recently, several laboratory biomarkers have been proposed to improve NAFLD diagnosis in the general population,25 including hepatic steatosis index (HSI)26 and NAFLD logit score.27 However, these methods have been developed and validated using data collected from the general population, and their usefulness for accurate NAFLD diagnosis in patients with severe obesity needs to be investigated.
In this work, we compare the HRI, HSI, and NAFLD logit score methods for the diagnosis of hepatic steatosis in the patients with severe obesity and NAFLD confirmed by liver biopsy during bariatric surgery.
Patients and methods
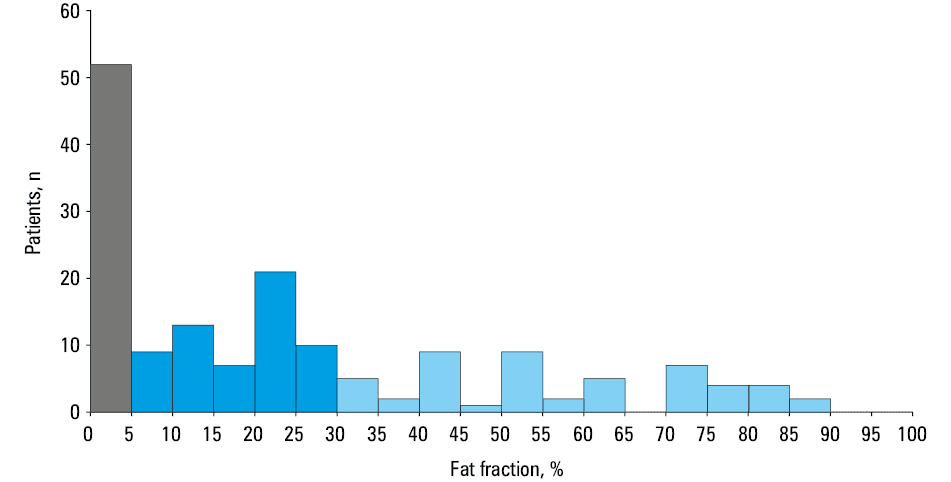
Data were collected retrospectively from 162 patients admitted for bariatric surgery (laparoscopic sleeve gastrectomy) between 2016 and 2019, in a tertiary care university hospital. The study was approved by the local institutional review board (KB/117/2016). No secondary causes of hepatic steatosis other than obesity (such as alcohol abuse, viral infections, or hepatotoxic drugs) were present in our patients according to their medical history and clinical evaluation. The patients investigated in our study had no reported history of kidney diseases. All the patients provided their informed consent for the examinations. No specific diet was required as a preparation for the surgery. Each patient underwent a wedge liver biopsy during the bariatric surgery, implemented as a routine procedure in our surgical clinic. During the biopsy, tissue samples were extracted from the subcapsular part of the left lobe of the liver. The liver fat fraction was defined based on the percentage of hepatocytes with fatty infiltration, determined by an experienced pathologist. The fatty liver was defined if more than 5% of the hepatocytes had steatosis. FLD was diagnosed in 106 patients (Figure 1). Clinical characteristics of the patients were analyzed, including age, sex, weight, body surface area, BMI, and diagnosis of hypertension, as well as diabetes mellitus (DM).
All blood tests and ultrasound examinations were performed within 24–48 hours before the bariatric surgery. The following 15 biomarkers were determined: aspartate aminotransferase (AST), alanine aminotransferase (ALT), γ-glutamyl transpeptidase, glucose, C‑peptide, total cholesterol, low‑density lipoprotein cholesterol, high‑density lipoprotein cholesterol (HDL‑C), triglyceride (TG), white blood cell count (WBC), hemoglobin A1c (HbA1c), insulin and homeostatic model assessment for insulin resistance, serum creatinine, and estimated glomerular filtration rate (eGFR) calculated with the Salazar–Corcoran formula dedicated for the obese patients.28
The HSI parameter was calculated with the following formula26:
The NAFLD logit score, ranging from 0 to 1, was estimated with the following equation27:
The ultrasound images, displaying liver / kidney views, were acquired during preoperative cardiac echocardiographic evaluation up to 2 days before the bariatric surgery with an ultrasound scanner (GE Vivid E9, GE Healthcare, Horten, Norway), equipped with a 2.5 MHz sector probe. Figure 2 shows examples of the ultrasound images of the livers with various steatosis levels. A single physician determined the HRI values for each ultrasound image, without knowing the biopsy results. Two regions of interest corresponding to the uniform parts of the liver and the kidney cortex were identified and used to calculate the HRI, defined as the ratio of the average liver and kidney ultrasound image brightness levels (Figure 3).


Statistical analysis
Continuous variables were described using median and interquartile range (IQR). A comparison of the continuous variables between the patients with and without NAFLD was performed with the Wilcoxon rank sum test at the significance level of 0.05. Nominal variables were presented as the number of cases in each category (percentage) and compared using the Fisher exact test. Additionally, the Spearman correlation coefficients were calculated for each continuous variable and the liver fat fraction level. For diagnostic performance assessment, we first determined the regular performance of these techniques for the diagnosis of cases with the fat fraction higher than 5%. Then, we additionally assessed the performance of the techniques in the patients with the fat fraction higher than 30%, representing moderate and severe steatosis that may be more clinically significant than mild steatosis.29-31
For each diagnostic method, we determined the receiver operating characteristic curve (ROC) and the area under the ROC curve (AUC). Accuracy, sensitivity, and specificity were calculated for the cutoff value that was the closest to the upper left corner of the ROC curve (optimal cutoff), as well as for the cutoff values corresponding to the sensitivity and specificity levels of 90%.32 Standard errors of the metrics were calculated using bootstrapping. AUC values obtained for the selected techniques were compared with the DeLong test at the significance level of 0.05.33 All calculations were performed using Matlab’s Statistics and Machine Learning Toolbox (MathWorks, Natick, Massachusetts, United States).
Results
Characteristics of the patients and the results of the laboratory tests are presented in Table 1. Median values of 13 biomarkers significantly differed between the NAFLD patients and the control group. Table 2 shows that the median values for the NAFLD patients were significantly higher for the HRI, HSI, and NAFLD logit score techniques. Diagnostic performance of the HRI, HSI, and NAFLD logit score technique is summarized in Table 3. In the case of the NAFLD diagnosis (fat fraction >5%), the HRI technique and the NAFLD logit score achieved AUC values of 0.879 and 0.825, respectively. Compared with these 2 methods, the HSI technique achieved significantly lower AUC value of 0.599 (DeLong test P <0.001). Additionally, Table 3 illustrates the diagnostic performance for the patients with moderate and high fat fraction (above 30%). In this case, the HRI and NAFLD logit score techniques achieved similar AUC values of around 0.82. In comparison, the AUC value for the HSI method was significantly lower and equal to 0.577 (DeLong test P <0.001). Moreover, Table 3 presents classification metrics calculated for various cutoff values.
Parameter | Control (n = 56) | NAFLD (n = 106) | P value, differentiation | Correlation coefficient | P value, correlation |
Data are presented as median (interquartile range) for the continuous variables or number (percentage) for the nominal variables. The Spearman correlation coefficients were calculated between the continuous parameters and the liver fat fraction levels. Differences were considered significant at P <0.05.
SI conversion factors: to convert glucose to mmol/l, multiply by 0.0555; C‑peptide to nmol/l, multiply by 2.5.
Abbreviations: ALT, alanine aminotransferase; AST, aspartate aminotransferase; BMI, body mass index; BSA, body surface area; eGFR, estimated glomerular filtration rate; GGT, γ-glutamyl transpeptidase; HbA1c, hemoglobin A1c; HDL‑C, high‑density lipoprotein cholesterol; HOMA‑IR, insulin and homeostatic model assessment for insulin resistance; LDL‑C, low‑density lipoprotein cholesterol; NAFDL, nonalcoholic fatty liver disease; TC, total cholesterol; TG, triglyceride; WBC, white blood cell count | |||||
Age, y | 38 (33.5–46.5) | 41.5 (37–47) | 0.09 | 0.122 | 0.12 |
Female sex | 47 (84) | 65 (61) | 0.003 | – | – |
Weight, kg | 119 (112.5–136) | 127 (114–144) | 0.08 | 0.174 | 0.03 |
BSA, m2 | 2.36 (2.27–2.53) | 2.42 (2.27–2.67) | 0.052 | 0.185 | 0.02 |
BMI, kg/m2 | 43.30 (40.18–46.15) | 43.78 (41.58–47.53) | 0.25 | 0.104 | 0.19 |
Hypertension | 25 (45) | 74 (70) | 0.002 | – | – |
Type 2 diabetes | 6 (11) | 26 (25) | 0.04 | – | – |
AST, U/l | 23 (20–27) | 30 (23–42) | <0.001 | 0.475 | <0.001 |
ALT, U/l | 26 (20.5–37) | 39.5 (27–64) | <0.001 | 0.479 | <0.001 |
GGT, U/l | 24 (19–31) | 38 (24–65) | <0.001 | 0.449 | <0.001 |
Glucose, mg/dl | 92 (87.5–98) | 100 (90–115) | <0.001 | 0.328 | <0.001 |
C‑peptide, ng/ml | 2.93 (2.33–3.78) | 4.05 (3.14–5.37) | <0.001 | 0.383 | <0.001 |
TC, mmol/l | 4.65 (4.05–5.23) | 4.62 (3.90–5.33) | 0.57 | –0.057 | 0.47 |
LDL‑C, mmol/l | 3.28 (2.89–3.98) | 3.48 (2.89–4.16) | 0.46 | 0.056 | 0.48 |
HDL‑C, mmol/l | 1.24 (1.09–1.049) | 1.11 (0.93–1.27) | <0.001 | –0.350 | <0.001 |
TG, mmol/l | 1.32 (1.04–1.70) | 1.73 (1.45–2.62) | <0.001 | 0.341 | <0.001 |
WBC, 109/l | 7.5 (6.5–8.9) | 8.1 (6.6–9.4) | 0.36 | –0.052 | 0.51 |
HbA1c, % | 5.4 (5.2–5.6) | 5.8 (5.5–6.2) | <0.001 | 0.432 | <0.001 |
Insulin, IU/ml | 14.3 (10.9–21.4) | 22.3 (14.2–35.7) | <0.001 | 0.405 | <0.001 |
HOMA‑IR | 3.34 (2.35–4.39) | 5.67 (3.71–9.99) | <0.001 | 0.474 | <0.001 |
Creatinine, µmol/l | 67.18 (63.65–75.14) | 68.07 (63.65–78.67) | 0.99 | –0.033 | 0.68 |
eGFR, ml/min/1.73 m2 | 149 (122.1–171.6) | 153 (128.5–178.1) | 0.21 | 0.159 | 0.04 |
Method | Control (n = 56) | NAFLD (n = 106) | P value | Spearman correlation coefficient | P value |
Data are presented as median (interquartile range). Differences were considered significant at P <0.05.
Abbreviations: HRI, hepatorenal index; HSI, hepatic steatosis index; others, see Table 1 | |||||
HRI | 0.98 (0.88–1.20) | 1.44 (1.20–1.63) | <0.001 | 0.695 | <0.001 |
HSI | 54.6 (51.1–59.4) | 57.1 (53.1–61.1) | 0.04 | 0.215 | 0.006 |
NAFLD logit score | 0.46 (0.30–0.65) | 0.84 (0.65–0.96) | <0.001 | 0.595 | <0.001 |
Method | Cutoff | Accuracy | Sensitivity | Specificity | AUC |
Data are expressed with (SE).
| |||||
Diagnosis of patients with fat fraction above 5% | |||||
HRI | 1.12 | 0.820 (0.023) | 0.849 (0.026) | 0.767 (0.046) | 0.879 (0.019) |
1.03 | 0.796 (0.026) | 0.896 (0.021) | 0.607 (0.054) | ||
1.23 | 0.771 (0.025) | 0.707 (0.033) | 0.892 (0.033) | ||
HSI | 56.1 | 0.605 (0.030) | 0.613 (0.037) | 0.589 (0.053) | 0.599 (0.036) |
50.0 | 0.636 (0.029) | 0.896 (0.023) | 0.143 (0.036) | ||
62.7 | 0.425 (0.029) | 0.179 (0.028) | 0.893 (0.032) | ||
NAFLD logit score | 0.59 | 0.790 (0.023) | 0.821 (0.026) | 0.732 (0.046) | 0.825 (0.025) |
0.42 | 0.753 (0.031) | 0.896 (0.024) | 0.482 (0.061) | ||
0.80 | 0.691 (0.028) | 0.585 (0.037) | 0.893 (0.033) | ||
Diagnosis of patients with fat fraction above 30% | |||||
HRI | 1.34 | 0.783 (0.025) | 0.844 (0.044) | 0.760 (0.029) | 0.825 (0.026) |
1.14 | 0.623 (0.028) | 0.911 (0.031) | 0.512 (0.035) | ||
1.60 | 0.771 (0.023) | 0.444 (0.054) | 0.897 (0.022) | ||
HSI | 56.9 | 0.580 (0.029) | 0.622 (0.053) | 0.564 (0.034) | 0.577 (0.038) |
49.3 | 0.321 (0.023) | 0.911 (0.032) | 0.094 (0.020) | ||
64.9 | 0.673 (0.029) | 0.089 (0.034) | 0.897 (0.021) | ||
NAFLD logit score | 0.80 | 0.753 (0.031) | 0.800 (0.044) | 0.735 (0.031) | 0.825 (0.027) |
0.68 | 0.685 (0.032) | 0.911 (0.033) | 0.598 (0.040) | ||
0.93 | 0.777 (0.026) | 0.467 (0.063) | 0.897 (0.022) | ||
In Table 4 we present the HRI‑based liver steatosis classification performance reported in previous studies for the general population. In these studies, the reported HRI cutoff values ranged between 1.24 and 2.20, while the AUC values ranged between 0.92 and 0.996. In our study, the optimal HRI cutoff value in the severely obese patients was equal to 1.12. Similarly, Table 5 presents the steatosis diagnosis performance of the HSI and NAFLD logit score techniques reported in the previous studies for the general population. For the HSI, the cutoff values corresponding to approximately 90% sensitivity and 90% specificity were equal to 30 and 36, respectively. However, for our group of patients these cutoffs were much higher and equal to 49.3 and 64.9, respectively. For the NAFLD logit score, the cutoff values corresponding to approximately 90% sensitivity and 90% specificity were originally 0.19 and 0.45, while for our group of patients these cutoff values were 0.68 and 0.93, respectively. Moreover, we found that the minimal values of the HSI and NAFLD logit score for our group were equal to 45.2 and 0.133, respectively.
Reference | Cutoffa | Sensitivity | Specificity | AUC | Patients, n |
a The HRI cutoffs were selected to differentiate NAFLD cases (fat fraction >5%).
| |||||
Borges et al,22 2012 | 1.24 | 0.927 | 0.925 | 0.964 | 82 |
Marshall et al,18 2012 | 1.27 | 1 | 0.54 | 0.92 | 101 |
Martin‑Rodriguez et al,24 2014 | 1.28 | 0.947 | 0.957 | 0.991 | 121 |
Kozłowska‑Petriczko et al,21 2021 | 1.41 | 0.916 | 0.862 | 0.94 | 167 |
Webb et al,17 2009 | 1.49 | 0.91 | 0.91 | 0.992 | 111 |
Chauhan et al,20 2016 | 2.01 | 0.625 | 0.952 | 0.96 | 45 |
Mancini et al,23 2009 | 2.20 | 1 | 0.95 | 0.996 | 40 |
Discussion
In our study, we investigated the usefulness of the ultrasound‑based HRI and the laboratory‑based HSI and NAFLD logit score methods for the diagnosis of NAFLD in the patients with severe obesity. In contrast with the previous studies, which derived and validated these methods in the general population, our work was dedicated to the patients with severe obesity referred for bariatric surgery. Generally, we obtained lower NAFLD classification scores for the investigated methods, as compared with the results reported in the literature for the general population. The AUC value for the HRI technique was equal to 0.879 and was lower than the AUC values reported for the general population that ranged from 0.92 to 0.996.17-24 The poorer performance of the HRI in our work may be due to several factors. Mottin et al12 presented that ultrasound imaging can be used as a diagnostic tool in patients with severe obesity, but the overall usefulness of the ultrasound imaging can be limited due to the lack of objective criteria for the NAFLD diagnosis and various technical problems associated with the ultrasound scanning.12 It is usually more difficult to perform an ultrasound examination and to acquire high‑quality ultrasound images in the patients with severe obesity than in lean persons. The lower quality of the ultrasound images could result in worse estimation of the HRI. Moreover, in comparison with the previous studies, dedicated to the general population, our dataset was from the beginning targeted toward the patients with high values of liver fat. Inclusion of the patients with lower liver fat values could improve the classification performance of the HRI technique.
The laboratory biomarker‑based methods, the HSI and NAFLD logit score, similarly achieved worse NAFLD diagnosis performance in the obese patients than in the papers targeting the general population.26,27 The HSI method achieved AUC value of 0.599, which was much lower than the AUC value from the original work of Lee et al,26 reported as 0.812. This large difference was probably caused by the severe obesity of our patients. In the work of Lee et al,26 the average BMI values for the controls and the patients with FLD were significantly different and corresponded to a low range of BMI values of 22.9 and 25.3, respectively.26 In contrast, in our study the median BMI values for the control and NAFLD cases were similar and high, equal to 43.30 and 43.78, respectively. This issue probably influenced the performance of the HSI score.26 For the NAFLD logit score, we obtained the AUC value of 0.825, which was lower than the AUC value of 0.87 originally reported by Yip et al27 for the general population. In the patients with the fat fraction above 30%, representing moderate and severe liver steatosis, we found that the HRI and NAFLD logit score techniques achieved similar performance, with AUC values around 0.82. In contrast, the HSI method did not provide accurate results, with low AUC value of 0.577 in the patients with moderate and severe steatosis.
Our results agree with the findings reported by Parente et al,34 who investigated the usefulness of the HSI method in a small group of 32 patients qualified for bariatric surgery. Similarly, Coccia et al35 investigated the accuracy of the HSI method in a group of 90 morbidly obese patients undergoing bariatric surgery. Our study involved 162 patients and indicated that higher cutoff values were required, both for the HSI and the NAFLD logit score technique, to diagnose NAFLD in the patients with severe obesity. Lee et al26 originally reported the better performing HSI cutoff for the NAFLD classification to be equal to 36 for the general population. Parente et al34 described the optimal HSI cutoff value of 53 (AUC of 0.777) for the classification of patients with NAFLD qualified for bariatric surgery. Coccia et al35 reported the optimal HSI cutoff value of 52 (AUC of 0.76) for the pateitns with morbid obesity. In our study, the optimal cutoff was 56.9. Similarly, the diagnosis based on the NAFLD logit score technique required higher cutoff values as well. Originally, in the work of Yip et al27 the cutoff values of 0.19 and 0.45 corresponded to the sensitivity and specificity of 90% in the general population. In our study, the NAFLD logit score cutoff values corresponding to the sensitivity and specificity of 90% were 0.68 and 0.93, respectively. In the case of the HRI technique, the optimal cutoff value determined for the NAFLD diagnosis was 1.12, and was much lower than the previously reported cutoff values for the general population, ranging from 1.24 to 2.20.17-24 This discrepancy could result from several factors. First, previous studies reported different cutoff values for the HRI technique. Calculations of the HRI might be affected by the settings of the ultrasound scanner employed for the data acquisition. However, additional studies are required to address this problem. Second, the severe obesity of our patients could influence the acquisition of the ultrasound images. For example, the thick layer of tissues, including fat, between the imaging ultrasound probe and the liver / kidney regions impacts the imaging ultrasound pulse propagation. Third, FLD, commonly associated with hypertension and diabetes, is regarded as a risk factor for chronic kidney disease, which may increase renal cortex echogenicity, potentially influencing the HRI.36,37 However, the patients in our study had no reported history of chronic kidney disease and they had normal eGFR values (above 60 ml/min/1.73 m2), suggesting low probability of significant kidney disease.
Our work has several limitations. We did not implement and evaluate the fatty liver index technique, which is one of the biomarker‑based methods designed for FLD assessment in the general population.38 Fatty liver index requires determination of waist circumference, which we found impractical in the case of the patients with severe obesity, for whom it is difficult to accurately indicate the waist in a repeatable manner. Similarly, we did not implement the lipid accumulation product index for the same reasons related to the requirement for the waist circumference parameter.39 Moreover, in our study we did not consider some advanced modalities, including magnetic resonance imaging, transient elastography, or electrical bioimpedance.40,41 In the future, it would be interesting to compare these techniques with the biomarker- and ultrasound‑based methods in the FLD assessment in severe obesity.
We evaluated the usefulness of several noninvasive techniques for the NAFLD diagnosis in the patients with severe obesity referred for bariatric surgery. Ultrasound‑based HRI and laboratory‑based NAFLD logit score demonstrated good accuracy in the patients with severe obesity, but the laboratory‑based HSI score achieved low performance. We also demonstrated that the laboratory‑based diagnostic techniques designed for the general population might require higher cutoff values to achieve accurate performance in the patients with severe obesity.
- Hales CM, Fryar CD, Carroll MD, et al. Trends in obesity and severe obesity prevalence in US youth and adults by sex and age, 2007‑2008 to 2015‑2016. JAMA. 2018; 319: 1723‑1735. | Crossref
- Placzkiewicz‑Jankowska E, Czupryniak L, Gajos G, et al. Management of obesity in the times of climate change and COVID‑19: an interdisciplinary expert consensus report. Pol Arch Intern Med. 2022; 132: 16216. | Crossref
- Aune D, Sen A, Norat T, et al. Body mass index, abdominal fatness, and heart failure incidence and mortality: a systematic review and dose‑response meta‑analysis of prospective studies. Circulation. 2016; 133: 639‑649. | Crossref
- Kenchaiah S, Evans JC, Levy D, et al. Obesity and the risk of heart failure. N Engl J Med. 2002; 347: 305‑313. | Crossref
- Flegal KM, Graubard BI, Williamson DF, Gail MH. Excess deaths associated with underweight, overweight, and obesity. JAMA. 2005; 293: 1861‑1867. | Crossref
ARTICLE INFORMATION