Clinical outcomes of therapy-related acute myeloid leukemia: an over 20-year single-center retrospective analysis
Key words: allogenic hematopoietic cell transplantation, hematological neoplasm, prior cytotoxic therapy, solid tumor, therapy-related acute myeloid leukemia


 CC BY-NC-SA 4.0
Clinical outcomes of therapy-related acute myeloid leukemia: an over 20-year single-center retrospective analysis
Introduction: Therapy‑related acute myeloid leukemia (t‑AML), a life‑threatening complication of cytotoxic therapy, represents an emerging challenge of modern oncology.
Objectives: We aimed to evaluate clinical outcomes of patients with t‑AML, taking into consideration genetic changes and treatment intensity.
Patients and methods: We conducted a retrospective analysis of all consecutive AML patients from a single hematology center (hospitalized between 2000 and 2021). The diagnosis of t‑AML was established according to the 2016 World Health Organization criteria. Overall survival (OS) and progression‑free survival (PFS) were used to evaluate treatment outcomes. Retrospective identification of 17p13 deletion and TP53 mutation was conducted.
Results: Among 743 patients with AML, 60 (8.1%) were diagnosed with t‑AML (63.4% had previous solid tumors). A complex karyotype (CK) and 17p13 deletion were detected in 26.8% and 26.7% of the t‑AML cases, respectively, while FLT3‑ITD and TP53 mutations occurred in 15.4% and 12.5% of the patients with t‑AML, respectively. Median OS and PFS were 13 and 8 months, respectively. The survival outcomes were superior in the patients who underwent an allogenic hematopoietic cell transplantation (alloHCT) than in those treated with intensive chemotherapy alone (median OS, 47 vs 7 months, respectively; P = 0.01). Patients with therapy‑related acute promyelocytic leukemia did not reach the median OS, and worse survival was noted in CK than non‑CK t‑AML (median OS, 6 vs 24 months; P = 0.02). In intensively treated t‑AML, the survival was better for the patients younger than 64 years (P = 0.03). In the multivariable Cox proportional hazards regression model, alloHCT was associated with longer OS (hazard ratio, 0.19; 95% CI, 0.04–0.91; P = 0.04). Moreover, we noted a high frequency of treatment‑related complications of t‑AML.
Conclusions: Our study revealed that prognosis of t‑AML varies. Hence, the treatment strategy should include performing alloHCT as soon as possible in the patients with an adverse genetic profile.
What's new?
Our study was a comprehensive, retrospective, 20‑year analysis of clinical outcomes of therapy‑related acute myeloid leukemia (t‑AML), a high‑risk disease triggered by previous radiotherapy and / or chemotherapy implemented for the treatment of preceding solid tumors or hematological neoplasms. Molecular biology testing for 17p13 deletion and TP53 mutation was also conducted, reporting 4 novel TP53 gene mutations and noting a high frequency of cytogenetic abnormalities within t‑AML. Our work outlines that t‑AML treatment strategy should consist in performing allogenic hematopoietic cell transplantation as soon as possible.
Introduction
Therapy‑related acute myeloid leukemia (t‑AML) is a hematological neoplasm occurring as a late complication of DNA‑damaging therapy administered for prior malignancies.1,2 It accounts for 20% of all AML cases and is usually associated with a poor prognosis.3-5 Unique clinical features distinguish t‑AML from primary AML. Mutagenic damage characterizing this subtype is usually triggered by exposure to alkylating agents, topoisomerase II inhibitors, radiotherapy, antimetabolites, or antitubuline agents. Therefore, patients undergoing chemotherapy have a 4.7‑fold higher risk for t‑AML than the general population.6 Adverse cytogenetic abnormalities and a high frequency of TP53, DNMT3A, FLT3, NPM1, and NRAS gene mutations are often observed in t‑AML,7 influencing its aggressive biology.8 Disease management strategy in t‑AML should be adjusted to a patient’s medical condition, taking into account the cumulative toxicity of prior therapies. While allogenic hematopoietic cell transplantation (alloHCT) seems to be the most appropriate treatment approach in t‑AML, data concerning the effects of such therapy are limited.9,10 Even though the number of t‑AML cases is increasing worldwide, mostly as a result of a growing number of cancer survivors,3,6 comprehensive reports of treatment outcomes remain sparse in the literature.11 Hence, this study aimed to describe the clinical characteristics and treatment outcomes of patients with t‑AML, focusing primarily on the genetic profile of the disease and treatment complications. In our opinion, understanding the impact of the genetic landscape of t‑AML on the clinical outcomes remains essential for any potential improvements in the treatment strategy.
Patients and methods
We retrospectively analyzed medical records of 723 consecutive patients with AML treated at the Department of Hematology and Bone Marrow Transplantation (Poznań, Poland) to select individuals with the following characteristics: 1) a diagnosis of t‑AML according the 2016 World Health Organization criteria,1 2) age greater than or equal to 18 years, 3) hospitalization between January 2000 and July 2021. The clinical characteristics recorded in this group included age, sex, molecular and cytogenetic data, type of treatment, treatment complications (toxicity, graft versus host disease [GvHD], infectious complications), treatment response, and details on the primary malignancy (date of diagnosis, type of cytotoxic therapy, latency period). To define the genetic risk of t‑AML, we applied and evaluated the 2017 European Leukemia Net (ELN) criteria.1,12
Testing for the TP53 DNA sequence variant (exons 2–11, Sanger sequencing, reference sequences: NM_000546.6, NP_000537.3) and 17p13 deletion (fluorescence in situ hybridization) was performed using retrospectively‑collected bone marrow (BM) samples. TP53 molecular analysis was always conducted in the case of negative 17p13 deletion results. The remaining genetic and cytogenetic tests were performed at the time of t‑AML diagnosis in accordance with the applicable guidelines.
The study was approved by the local bioethical committee (1040/19) and conducted in accordance with the Declaration of Helsinki. The patients provided their written informed consent to participate in the study.
Statistical analysis
The Shapiro–Wilk test was used to assess the normality of data distribution. Data comparison was performed using the χ2 test (for qualitative variables), the t test (for quantitative variables with normal distribution), or the Mann–Whitney test (for quantitative variables with non‑normal distribution). The study end points comprised overall survival (OS) and progression‑free survival (PFS). OS was defined as the time between the diagnosis and death / last follow‑up (for alloHCT cases, the time between the procedure and death / last follow‑up). PFS was defined as the time between the diagnosis and relapse / death (for alloHCT cases, the time between the procedure and relapse / death). OS and PFS were estimated using the Kaplan–Meier method and compared using the log‑rank test. The Cox proportional hazards regression model was used for the analysis of prognostic factors. Factors demonstrating significance in the univariable analysis were included in the multivariable analyses, with hazards ratios [HRs] and 95% CIs calculated. A P value lower than 0.05 was considered significant. Statistical analyses were performed using the MedCalc Software v. 19.5.3 (MedCalc Software Ltd., Ostend, Belgium).
Results
Clinical characteristics of therapy‑related acute myeloid leukemia
Among the 743 patients with AML hospitalized during the study period, 60 individuals (8.1%) were diagnosed with t‑AML (median age, 57 years). The median age for women and men was 55 and 58.5 years, respectively (P = 0.25). Most of the patients (93.3%) were diagnosed after 2005.
Solid tumors (STs) preceded t‑AML in 63.4% of cases, and hematological neoplasms (HNs) in 36.6%. Breast cancer was the most frequent representative of STs (47.4%), while Hodgkin lymphoma (31.8%) was the most frequently noted type of HN. In 56.7% of the patients, t‑AML was triggered by previous chemotherapy, with 54.5% of those patients having undergone autologous hematopoietic cell transplantation (Table 1). The median latency time differed according to the type of anticancer treatment, and was, respectively, 4, 5, and 4.5 years for radiotherapy, chemotherapy, and both (P = 0.37). The median latency time was shorter for STs than HNs (5 vs 7 years; P = 0.04) (Table 2). t‑AML with myelodysplasia‑related changes (t‑AML‑MRC) constituted 26.7% of all t‑AML cases (16/60) and occurred secondary to therapy‑related myelodysplastic syndromes (81.3%) or therapy‑related chronic myelomonocytic leukemia (6.2%). Infrequently, patients with t‑AML‑MRC were diagnosed due to the presence of myelodysplasia‑related changes (12.5%).
Primary malignancy | n (%) | Latency time, y, mean (SD) | Cytotoxic therapy, n | ||
CTH (autoHCT) | RTH | CTH + RTH | |||
Abbreviations: autoHCT, autologous stem cell transplantation; CTH, chemotherapy; N/A, no data; RTH, radiotherapy | |||||
Solid tumors | 38 (63.3) | 5 (3.9) | 16 | 11 | 11 |
Breast cancer | 18 (30) | 5 (3) | 6 | 5 | 7 |
Ovarian cancer | 6 (10) | 3.6 (1.1) | 6 | 0 | 0 |
Prostate cancer | 4 (6.7) | 3 (1.4) | 0 | 4 | 0 |
Osteosarcoma | 2 (3.3) | 17 (2.8) | 1 | 0 | 1 |
Testicular cancer | 2 (3.3) | 4 (2.1) | 1 | 0 | 1 |
Medulloblastoma | 1 (1.7) | 5 | 0 | 0 | 1 |
Lung cancer | 1 (1.7) | 3 | 0 | 0 | 1 |
Thyroid cancer + prostate cancer | 1 (1.7) | N/A | 0 | 1 | 0 |
Endometrial cancer | 1 (1.7) | 2 | 0 | 1 | 0 |
Carcinoid | 1 (1.7) | 3 | 1 | 0 | 0 |
Molar pregnancy | 1 (1.7) | 4 | 1 | 0 | 0 |
Hematological neoplasms | 22 (36.7) | 7 (3.8) | 18 (12) | 0 | 4 |
Hodgkin lymphoma | 7 (11.7) | 6.7 (4.8) | 4 (2) | 0 | 3 |
Non‑Hodgkin lymphoma | 6 (10) | 9 (4) | 5 (3) | 0 | 1 |
Multiple myeloma | 4 (6.7) | 8.5 (1.3) | 4 (4) | 0 | 0 |
Chronic lymphocytic leukemia | 2 (3.3) | 4 (1.4) | 2 | 0 | 0 |
Acute lymphoblastic leukemia | 1 (1.7) | 3 | 1 (1) | 0 | 0 |
T‑cell lymphoma | 1 (1.7) | 1 | 1 (1) | 0 | 0 |
Multiple myeloma + prostate cancer | 1 (1.7) | 7 | 1 (1) | 0 | 0 |
Patient characteristics | Type of primary malignancy in t‑AML | ||
Solid tumors (n = 38) | Hematological neoplasms (n = 22) | P value | |
Data are presented as median (interquartile range) or number of patients unless indicated otherwise.
a Mann–Whitney test
b χ2 test
c t test
Abbreviations: alloHCT, allogenic hematopoietic cell transplantation; BM, bone marrow; ELN, European Leukemia Network; HGB, hemoglobin; NEU, neutrophil count; PLT, platelet count; t‑MN, therapy‑related myeloid neoplasm; WBC, white blood cell count | |||
Age at t‑MN diagnosis, y | 57 (47–63) | 52.5 (42–63) | 0.76a |
Latency time, y | 5 (3–5.5) | 7 (3–10) | 0.04a |
Sex (men / women) | 11/27 | 11/11 | 0.11a |
Laboratory parameters at diagnosis | |||
BM blasts, % | 52 (28.9–79.3) | 36 (25–61) | 0.29a |
WBC, G/l | 4.7 (1.5–24.6) | 7.3 (3.3–40.9) | 0.26a |
NEU, G/l | 1.9 (0.5–4.6) | 1.3 (0.6–4.9) | 0.7a |
HGB, mmol/l, mean (SD) | 5.5 (0.8) | 5.3 (0.6) | 0.28c |
PLT, G/l | 54 (21.8–123) | 62 (22.8–102.8) | 0.83a |
Type of treatment | |||
Palliative care | 8 | 4 | 0.79b |
Intensive chemotherapy | 18 | 7 | 0.21b |
Intensive chemotherapy, alloHCT | 12 | 11 | 0.19b |
Outcomes of the first induction therapy | |||
Complete remission | 13 | 9 | 0.44b |
Lack of complete remission | 11 | 7 | 0.87b |
PLT recovery (>50 G/l), d | 22 (15–30) | 25.5 (20–29) | 0.33a |
No PLT recovery, n | 4 | 1 | – |
NEU recovery (0.5 G/l), d | 22 (15–32.5) | 25 (21–27.3) | 0.48a |
No NEU recovery, n | 1 | 1 | – |
2017 ELN genetic risk category12 | |||
Favorable | 3 | 1 | 0.81b |
Intermediate | 11 | 3 | 0.36b |
Adverse | 18 | 10 | 0.34b |
Cytogenetic and molecular characteristics of therapy‑related acute myeloid leukemia
Cytogenetic abnormalities were observed in 82.9% of the patients with t‑AML, the most common ones being a complex karyotype (CK) and 17p13 deletion, with a frequency of 26.8% and 26.7%, respectively. Furthermore, FLT3‑ITD and TP53 mutations were respectively found in 15.4% and 12.5% of cases.
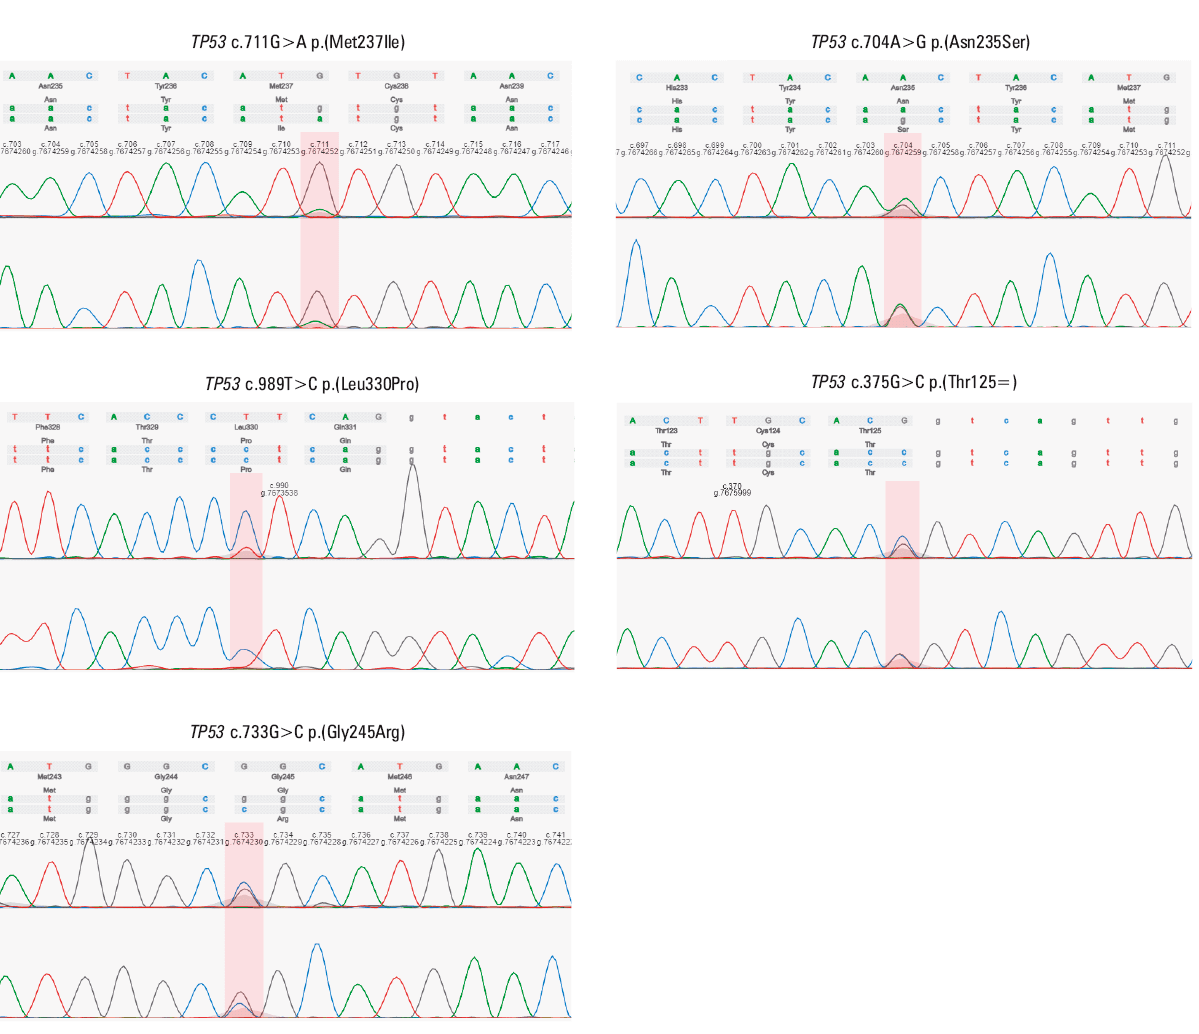
A total of 5 TP53 DNA sequence variants, namely, c.711G>A p.(Met237Ile), c.704A>G p.(Asn235Ser), c.375G>C p.(Thr125=), c.733G>C p.(Gly245Arg), and c.989T>C p.(Leu330Pro) were detected in 4 patients with t‑AML (Figure 1, Table 3). Importantly, only 1 variant, c.711G>A p.(Met237Ile), was previously described in AML according to the Catalogue of Somatic Mutations In Cancer (COSMIC) database.13 In 75% of the patients with t‑AML, a TP53 DNA sequence variant co‑occurred with CK (Table 3). Additionally, based on the analysis of TP53 mutation and the presence of 17p13 deletion, the majority of the patients with t‑AML (60.9%) were categorized into the adverse genetic risk group, according to the 2017 ELN risk stratification criteria12 (Table 4).
ID | TP53 DNA sequence variant | 17p13 deletion (% of cells) | Primary malignancy | Cytotoxic therapy | Latency time, y | Cytogenetics | Molecular markers | 2017 ELN risk category12 | t‑AML treatment | Age, y | Sex | OS, mo | Alive |
a With all‑trans retinoic acid and arsenic trioxide
| |||||||||||||
5 | c.711G>A p.(Met237Ile) | Negative | CLL | CTH | 5 | Complex karyotype | No | Adverse | CTH | 58 | Woman | 2 | No |
40 | c.704A>G p.(Asn235Ser) | Negative | Multiple myeloma | CTH, autoHCT | 9 | Normal karyotype | No | Adverse | CTH, alloHCT | 66 | Woman | 13 | No |
49 | c.989T>C p.(Leu330Pro) | Negative | Breast cancer | CTH | 3 | Complex karyotype | No | Adverse | CTH | 34 | Woman | 4 | No |
4 | c.375G>C p.(Thr125=)
c.733G>C p.(Gly245Arg) | Negative | CLL | CTH | 3 | Complex karyotype | No | Adverse | Palliative | 59 | Man | 1 | No |
37 | Negative | Positive (16) | Breast cancer | CTH, RTH | 14 | Normal karyotype | No | Adverse | CTH | 63 | Woman | 5 | No |
1 | Negative | Positive (6) | Testicular cancer | CTH | 5 | Unanalyzable | PMR‑RARA, FLT3‑ITD | Adverse | Palliative | 26 | Man | 1 | No |
44 | Not tested | Positive (12) | NHL | CTH, autoHCT | 13 | Complex karyotype | No | Adverse | CTH, alloHCT | 51 | Woman | 140 | No |
34 | Negative | Positive (6) | Prostate cancer | RTH | N/A | 8 trisomy | Not tested | Adverse | Palliative | 72 | Man | 3 | No |
18 | Not tested | Positive (8) | Hodgkin lymphoma | CTH, autoHCT | 6 | Unanalyzable | Not tested | Adverse | CTH, alloHCT | 51 | Man | 5 | No |
33 | Not tested | Positive (20) | Breast cancer | CTH, RTH | 2 | Inversion (16) | Not tested | Adverse | CTH, alloHCT | 39 | Woman | 151 | Yes |
2 | Not tested | Positive (10) | Breast cancer | RTH | 5 | Complex karyotype | Not tested | Adverse | CTH, alloHCT | 55 | Woman | 47 | Yes |
38 | Negative | Positive (6) | Breast cancer | CTH, RTH | 5 | Unanalyzable | No | Adverse | CTH, alloHCT | 46 | Woman | 9 | No |
50 | Negative | Positive (6) | Breast cancer | CTH | 5 | t(15;17), del(7) | PMR‑RARA | Adverse | CTHa | 55 | Woman | 61 | Yes |
13 | Not tested | Positive (12) | Ovarian cancer | CTH | 5 | Unanalyzable | Not tested | Adverse | Palliative | 58 | Woman | 4 | No |
55 | Not tested | Positive (49) | Multiple myeloma | CTH, autoHCT | 10 | Complex karyotype | No | Adverse | CTH, alloHCT | 63 | Woman | 24 | Yes |
7 | Negative | Positive (7) | Hodgkin lymphoma | CTH, RTH | 2 | Unanalyzable | PML‑RARA | Adverse | CTHa | 27 | Woman | 52 | Yes |
Cytogenetic or molecular marker | n / N (%) |
a Defined as ≥3 cytogenetic abnormalities
b Number of patients analyzed using FISH
c Defined by 2017 ELN12 as ≥3 chromosome abnormalities in the absence of the WHO‑designated recurring translocations or inversions
d Defined as ≥2 autosomal monosomies or 1 autosomal monosomy and 1 structural abnormality
| |
Cytogenetic assessment | |
Metaphases not analyzable | 9/50 (18) |
Metaphases analyzable | 41/50 (82) |
Normal karyotype | 7/41 (17.1) |
Cytogenetic abnormalities | 34/41 (82.9) |
Complex karyotypea | 11/41 (26.8) |
Deletion of chromosome 17p13 | 12/45 (26.7); 45b |
Complex karyotypec | 10/41 (24.4) |
t(v;11q23.3); KMT2A rearranged | 8/41 (19.5); 13b |
t(8;21); RUNX1‑RUNX1T1 | 7/41 (17.1); 17b |
Deletion of chromosome 5 | 5/41 (12.2) |
t(15;17); PML‑RARA | 3/41 (7.3); 10b |
Deletion of chromosome 7 | 3/41 (7.3) |
t(9;11); KMT2A‑MLLT3 | 3/41 (7.3); 13b |
Monosomal karyotyped | 2/41 (4.9) |
inv(16) or t(16;16); CBFB‑MYH11 | 2/41 (4.9); 9b |
t(9;22); BCR‑ABL1 | 1/41 (2.4); 12b |
DNA sequence variants | |
FLT3‑ITD (cDNA) | 4/26 (15.4) |
TP53 | 4/32 (12.5) |
FLT3‑TKD (D835) (cDNA) | 2/26 (7.7) |
NPM1 | 1/22 (4.5) |
C‑KIT | 1/1 |
2017 ELN genetic risk stratification12 | |
Favorable | 4/46 (8.7) |
Intermediate | 14/46 (30.4) |
Adverse | 28/46 (60.9) |
In the t‑AML‑MRC subgroup with cytogenetics and molecular biology analysis performed (n = 14), 84.6% and 15.4% of the patients were classified into adverse and intermediate risk categories, respectively, according to the 2017 ELN criteria.12 17p13 deletion occurred in 21.4% of the t‑AML‑MRC patients (3/14), while the frequency of FLT3‑ITD and TP53 mutation was 40% and 20%, respectively.
Treatment of patients with therapy‑related acute myeloid leukemia
Only medically fit patients (80%) were eligible for intensive treatment, which comprised induction therapy (cytarabine with daunorubicin), consolidation therapy (high‑dose cytarabine), and eventually alloHCT. At the time of the analysis, only 2 FLT3-positive patients received targeted therapy with midostaurin (n = 1) and gilteritinib (n = 1). Palliative care consisted of hydroxyurea, 6‑mercaptopurine or metothrexate, and supportive care. The median age of patients undergoing intensive treatment and palliative care was 52.5 and 64.5 years, respectively (P = 0.002). Treatment of therapy‑related acute promyelocytic leukemia (t‑APL) consisted of all‑trans retinoic acid (ATRA) and arsenic trioxide (ATO) or idarubicine, without alloHCT (n = 2). Only 1 patient with t‑APL received palliative care.
Among the t‑AML patients receiving intensive treatment, 47.9% underwent alloHCT (17 women, 6 men, with a median age of 51 years [range, 25–67]). The median time between the diagnosis and alloHCT was 8 months (range, 4–21). Among the alloHCT recipients, 52.2% had a medical history of ST, and 47.8% of HN, with the median time between the diagnosis and alloHCT of 10 and 7 months in each group, respectively (P = 0.14). The patients obtained transplants from unrelated human leukocyte antigen (HLA)-matched donors (60.9%), HLA identical sibling donors (30.4%), or underwent haploidentical alloHCT (8.7%). Stem cells were sourced from peripheral blood (87.0%), BM (8.7%), or umbilical cord blood (4.3%). In 56.5% of the patients, alloHCT was performed during the first complete remission (CR1), and in 43.5% it was performed after CR1 (CR2, CR3, or active disease). Reduced‑intensity conditioning (RIC) was used in 87% of the patients, whereas myeloablative conditioning (MAC) in 13%. The majority of t‑AML alloHCT recipients (58.8%) were classified as adverse‑risk and 41.2% as intermediate‑risk according to the 2017 ELN criteria.12
Survival of the patients with therapy‑related acute myeloid leukemia
The median duration of follow‑up was 52 months, and the total median OS was 13 months. Among the intensively‑treated patients with t‑AML, the median OS and PFS were 15 and 8 months, respectively (Supplementary material, Figure S1A and S1B).
The intensively‑treated t‑AML patients were divided into t‑APL, t‑AML‑MRC, and t‑AML subgroups. The survival outcomes were significantly worse for the t‑AML‑MRC group than for the t‑AML and t‑APL groups. Moreover, t‑APL was characterized by comparably high survival rates (P <0.001; Supplementary material, Figure S1C).
Next, we compared the treatment outcomes in t‑AML, excluding the patients with t‑APL. The outcomes of the t‑AML patients undergoing palliative care (median OS, 2 months) remained poor, while the benefit of intensive treatment (median OS, 7 months) was pronounced in the t‑AML alloHCT recipients, who had a median OS of 47 months (Supplementary material, Figure S1D).
With respect to cytogenetics, the presence of CK in t‑AML resulted in lower survival rates, with the median OS of 6 months, as compared with 24 months in non‑CK t‑AML (P = 0.02; Supplementary material, Figure S1E). Survival rates did not differ across the genetic risk subgroups classified according to the 2017 ELN criteria12 (P = 0.52; Supplementary material, Figure S1F).
Moreover, among the intensively‑treated patients with t‑AML, the survival outcomes were better in the individuals under 64 years of age than in the older patients (P = 0.03; Supplementary material, Figure S1G). The benefit of intensive treatment was especially pronounced in the t‑AML patients who achieved CR after induction therapy (P = 0.1; Supplementary material, Figure S1H).
Regarding previous oncological history, the survival rates did not differ between the subgroups divided according to the type of the primary malignancy (ST vs HN; Supplementary material, Figure S1I). The survival outcomes were significantly worse for the t‑AML patients with a history of ovarian / endometrial cancer than in those with previous HN (P = 0.04) (Supplementary material, Figure S1J). The survival rates did not differ between the t‑AML subgroups divided according to the type of the primary cytotoxic therapy (chemotherapy, radiotherapy, and both radiotherapy and chemotherapy) (Supplementary material, Figure S1K).
Among the t‑AML patients who underwent alloHCT (median follow‑up, 70 months), the median OS and PFS were 47 and 30 months, respectively (Supplementary material, Figures S1L and S1M). We observed a tendency toward superior survival outcomes in the patients transplanted when they were in CR, and for those receiving MAC (Supplementary material, Figures S1N and S1O).
In the univariable Cox proportional hazards regression model, factors such as treatment with intensive chemotherapy and alloHCT, age below 64 years, female sex, achieving CR after the first induction therapy and the absence of CK were associated with better OS (Table 4). In the multivariable analysis, treatment with alloHCT was associated with better OS, while higher neutrophil count (at the time of t‑AML diagnosis) was associated with worse OS (Table 5).
Factor | Univariable | Multivariable | ||||
HR (95% CI) | P value | AHR (95% CI) | P value | |||
Sex | Men | 1 (ref) | – | 1 (ref) | – | |
Women | 0.51 (0.28–0.93) | 0.03 | 0.80 (0.29–2.14) | 0.07 | ||
Latency time, y | 1.00 (0.92–1.07) | 0.91 | 0.99 (0.88–1.13) | 0.93 | ||
Age at t‑AML diagnosis | ≥64 y | 1 (ref) | – | 1 (ref) | – | |
<64 y | 0.40 (0.20–0.78) | 0.008 | 0.62 (0.18–2.11) | 0.45 | ||
t‑AML treatment | Palliative | 1 (ref) | – | 1 (ref) | – | |
Intensive CTH | 0.33 (0.15–0.72) | 0.006 | 0.39 (0.13–1.16) | 0.24 | ||
AlloHCT | 0.15 (0.06–0.34) | <0.001 | 0.19 (0.04–0.91) | 0.04 | ||
Type of previous malignancy | Solid tumor | 1 (ref) | – | 1 (ref) | – | |
Hematological neoplasm | 0.69 (0.36–1.29) | 0.24 | 1.20 (0.42–3.47) | 0.72 | ||
Type of previous cytotoxic therapy | RTH | 1 (ref) | – | 1 (ref) | – | |
CTH | 1.17 (0.54–2.54) | 0.69 | 2.05 (0.59–7.03) | 0.25 | ||
RTH + CTH | 1.14 (0.47–2.74) | 0.76 | 1.91 (0.57–6.42) | 0.3 | ||
Laboratory parameters at diagnosis | BM blasts, % | 1.01 (0.99–1.02) | 0.43 | 1.01 (0.99–1.03) | 0.29 | |
WBC, G/l | 1.00 (0.99–1.01) | 0.29 | 1.01 (0.99–1.02) | 0.09 | ||
NEU, G/l | 0.99 (0.97–1.01) | 0.47 | 1.25 (1.05–1.47) | 0.01 | ||
HGB, mmol/l | 0.83 (0.52–1.31) | 0.42 | 0.70 (0.29–1.68) | 0.43 | ||
PLT, G/l | 0.99 (0.99–1.00) | 0.80 | 1.00 (0.99–1.00) | 0.34 | ||
2017 ELN genetic risk category12 | Favorable | 1.90 (0.39–9.16) | 0.42 | 1.71 (0.59–4.88) | 0.11 | |
Intermediate | 1 (ref) | – | 1 (ref) | – | ||
Adverse | 1.48 (0.69–3.16) | 0.31 | 1.71 (0.59–4.89) | 0.31 | ||
Cytogenetic abnormalities | Complex FLT3‑ITD | 2.81 (1.15–6.85) | 0.02 | 2.55 (0.86–7.61) | 0.09 | |
Non‑complex karyotype | 1 (ref) | – | 1 (ref) | – | ||
Response to treatment with the first induction | Complete remission | 0.44 (0.23–0.84) | 0.01 | 0.59 (0.24–1.48) | 0.26 | |
Lack of complete remission | 1 (ref) | – | 1 (ref) | – | ||
PLT recovery (>50 G/l), d | 1.02 (0.99–1.05) | 0.14 | 1.03 (0.97–1.10) | 0.29 | ||
NEU recovery (>0.5 G/l), d | 1.02 (0.99–1.05) | 0.19 | 1.01 (0.95–1.08) | 0.79 | ||
Intensively treated t‑AML | t‑AML (excluding t‑APL) | 1 (ref) | – | 1 (ref) | – | |
t‑AML‑MRC | 1.83 (0.92–3.66) | 0.08 | 0.69 (0.22–2.19) | 0.52 | ||
Treatment complications in therapy‑related acute myeloid leukemia
The most frequent organ complications during intensive chemotherapy were hepatotoxicity (55.2%), renal toxicity (39.5%), and cardiotoxicity (31.6%). Among the alloHCT recipients, renal toxicity (78.2%), hepatotoxicity (69.6%), and cardiotoxicity (34.8%) occurred the most often (Table 6).
Intensive chemotherapy (n = 48) | AlloHCT (n = 23) | ||
Complication | n (%) | Complication | n (%) |
a Grade 1–5 according the Common Terminology Criteria for Adverse Events version 5.0
Abbreviations: see Table 2 | |||
Hepatotoxicitya | 21 (55.2) | Renal toxicitya (total) | 18 (78.2) |
Renal toxicitya | 15 (39.5) | Renal toxicity 0–30 days after alloHCT | 11 (47.8) |
Cardiotoxicitya | 12 (31.6) | Renal toxicity 30–100 days after alloHCT | 13 (56.5) |
Neurotoxicity | 4 (10.5) | Hepatotoxicitya (total) | 16 (69.6) |
Iatrogenic adverse events | 3 (7.9) | Hepatotoxicity 0–30 days after alloHCT | 14 (60.9) |
Skina | 3 (7.9) | Hepatotoxicity 30–100 days after alloHCT | 13 (56.5) |
Bleeding (1 intracranial) | 3 (7.9) | Cardiotoxicitya | 8 (34.8) |
Tumor lysis syndrome | 2 (5.3) | Hemorrhagic cystitis | 2 (8.7) |
Deep vein thrombosis | 2 (5.3) | Pulmonary fibrosis | 1 (4.3) |
Psychiatrica | 2 (5.3) | Toxic epidermal necrolysis | 1 (4.3) |
Ophtalmica | 1 (2.6) | ||
Disseminated intravascular coagulation | 1 (2.6) | ||
No data | 10 (20.8) | ||
While infection‑related complications were observed in all the patients with t‑AML, mostly during neutropenia, they were analyzed separately for those undergoing intensive treatment or alloHCT. After intensive chemotherapy, fever of unknown origin (FUO) occurred in 37.5% of the patients. Microbiologically documented infections were confirmed in 69% of the patients, with bacterial blood stream infections (BSI) in 67.5%, viral infections in 5%, and invasive fungal infections (IFI) in 22.5%. In the subgroup of alloHCT recipients, in the pre‑engraftment period, FUO was observed in 52.2% of the patients, bacterial BSI in 39.1%, and IFI in 8.7%. In the post‑engraftment period, viral infections were most commonly detected (34.8%), while IFI occurred in 21.7% of the patients (Table 7).
Type of infections | Intensive CTH (n = 46) | AlloHCT (n = 23) | ||
≤30 days | >30 days | Total | ||
Data are shown as number (percentage) of patients.
| ||||
Fever of unknown origin | 15 (37.5) | 12 (52.2) | – | 12 (52.2) |
Bacterial infections | 27 (67.5) | 9 (39.1) | 4 (17.4) | 9 (39.1) |
Gram‑negative | 12 (30) | 4 (17.4) | 2 (8.7) | 5 (21.7) |
Escherichia coli | 3 (7.5) | – | – | – |
Klebsiella pneumoniae | 2 (5) | 3 (13) | 1 (4.3) | 3 (13) |
Enterobacter cloacae | 1 (2.5) | – | – | – |
Pseudomonas aeruginosa | 1 (2.5) | – | – | – |
Acinetobacter junii | 1 (2.5) | – | – | – |
Enterobacter faecium | – | – | 1 (4.3) | 1 (4.3) |
Stenotrophomonas maltophilia | 1 (2.5) | – | – | – |
Acinetobacter ursingii | 1 (2.5) | – | – | – |
Acinetobacter Iwofii | – | 1 (4.3) | – | 1 (4.3) |
Ochrobactrum anthropi | 1 (2.5) | – | – | – |
Morganeli morgani | 1 (2.5) | – | – | – |
Gram‑positive | 22 (55) | 5 (21.7) | 3 (13) | 7 (30.4) |
Staphylococcus epidermidis | 9 (22.5) | 1 (4.3) | 1 (4.3) | 2 (8.7) |
Staphylococcus aureus | 2 (5) | 1 (4.3) | – | 1 (4.3) |
Staphylococcus hominis | 2 (5) | 1 (4.3) | – | 1 (4.3) |
Enterococcus faecium | 5 (12.5) | 2 (8.7) | – | 2 (8.7) |
Staphylococcus haemolyticus | 3 (7.5) | – | – | – |
Enterococcus faecalis | 1 (2.5) | – | – | – |
Corynebacterium spp | 2 (5) | – | – | – |
Streptococcus mitis | 1 (2.5) | – | 1 (4.3) | 1 (4.3) |
Staphylococcus capitis | 1 (2.5) | – | – | – |
Streptococcus oralis | 1 (2.5) | – | 1 (4.3) | 1 (4.3) |
Cutibacterium acnes | 1 (2.5) | – | – | – |
Rothia mucilaginosa | 1 (2.5) | – | – | – |
Bacillus cereus | 1 (2.5) | – | – | – |
Cellulomonas | 1 (2.5) | – | – | – |
Viral infections | 2 (5) | – | 8 (34.8) | 8 (34.8) |
Cytomegalovirus | 1 (2.5) | – | 6 (26.1) | 6 (26.1) |
Epstein‑Bar virus | 1 (2.5) | – | 2 (8.7) | 2 (8.7) |
Fungal infections | 9 (22.5) | 2 (8.7) | 5 (21.7) | 5 (21.7) |
Candida albicans | 1 (2.5) | – | – | – |
Candida inconspicua | 1 (2.5) | – | – | – |
Candida tropicalis | 1 (2.5) | – | – | – |
Geotrichum capitatum | – | – | 1 (4.3) | 1 (4.3) |
Pneumocystis jiroveci | 1 (2.5) | – | – | – |
Serum galactomannan | 5 (12.5) | 2 (8.7) | 4 (17.4) | 4 (17.4) |
Data unavailable | 6 (15) | – | – | – |
Among the alloHCT recipients, GvHD occurred in 4 patients (acute GvHD in 2 patients and chronic GvHD in 2 patients).
Progression of t‑AML (48.5%), infections (24.2%; 2 cases of IFI), primary malignancy progression (9.1%), and toxicity (15.2%) were the most prevalent causes of death (33/48) among the intensively treated patients with t‑AML. Among the alloHCT recipients, the main causes of death (15/23) comprised t‑AML progression (46.7%), infections (13.3%; 1 case of IFI), primary malignancy progression (13.3%), organ toxicity (13.3%), and acute GvHD (6.7%).
Discussion
In this work, we present a comprehensive analysis of t‑AML, which holds a significant value as compared with registry studies which, while performed in larger cohorts of patients with t‑AML, often lack detailed treatment data.
The Kaplan–Meier survival analysis revealed longer OS in the t‑AML patients undergoing alloHCT and intensive chemotherapy, those who achieved CR after induction therapy, the individuals younger than 64 years, and those with t‑APL. In turn, worse OS was observed in the patients with CK t‑AML. Among the alloHCT recipients, we noted a tendency toward longer OS when the procedure was performed during CR and with the use of MAC.
In the univariable Cox proportional hazard regression model, t‑AML treatment with alloHCT, intensive chemotherapy, CR after induction therapy, age under 64 years, and female sex were the factors associated with better OS. On the other hand, the presence of CK was linked to worse OS. In the multivariable analyses, treatment with alloHCT remained an independent prognostic factor for better OS. In turn, higher neutrophil count at the diagnosis was an independent prognosticator of an unfavorable outcome.
The frequency of t‑AML in our report was 8.1%, and was comparable to previously reported numbers.3,5,14 The majority of t‑AML cases were preceded by ST, which corresponded to a higher ST incidence worldwide in comparison with HN.3,6,14 Moreover, the most common primary malignancies in t‑AML were breast cancer and lymphomas, which is in line with other available reports.3,16 High incidence of breast and gynecological tumors as the primary malignancy reflected the female predominance in t‑AML. The growing use of adjuvant therapy for the treatment of early‑stage breast cancer, the most frequent malignancy affecting women in Poland between 2000 and 2021, could be the factor contributing to the increase in the number of t‑AML cases.17 On the other hand, the large proportion of lymphomas as the primary malignancy corresponded to the large number of autologous hematopoietic cell transplant procedures performed to reduce lymphoproliferation and mitigate its leukemogenic effect. We observed a tendency toward better OS rates in the cases of t‑AML preceded by HN, which might have reflected the active hemato‑oncological surveillance allowing for prompt diagnosis and faster initiation of treatment. The median latency time in t‑AML was shorter when the disease had been preceded by ST than HN, which is in accordance with previous reports.11,18 Higher neutrophil count at the diagnosis represented an unfavorable predictor of survival, which is consistent with an earlier study.19
Moreover, the type and dose of cytotoxic therapy influences the latency time in t‑AML.3,20,21 We noted the shortest latency period after prior radiotherapy, which is known to evoke BM environment damage disturbing hematopoiesis.3,22 We reported the shortest 2‑year OS after prior combined cytotoxic therapy, which probably reflects the highest cumulative dose. Interestingly, despite the known effect of cytotoxic chemotherapy on the development of therapy‑related myeloid neoplasms (t‑MNs), some data suggested an association between the BRCA DNA sequence variants and an increased risk of de novo leukemia development. This mechanism involved inactivation of the error‑free repair process for double‑stranded DNA within the BRCA1 / BRCA2 protein pathway in breast cancer survivors.23 Some studies report that modern ST therapies using poly (ADP‑ribose) polymerase inhibitors (PARPi; eg, olaparib) have been associated with a higher risk of t‑MNs.25 On the other hand, there is an ongoing phase 2 clinical trial based on the use of PARPi for the treatment of t‑AML (NCT03953898).
Even though 17p13 deletion was detected in all t‑APL patients in our study (with a lack of TP53 mutation), their treatment using ATO / ATRA remained highly efficient. Interestingly, ATO inactivates TP53 functions through the 26S proteasome pathway,25 and has been found to amplify wild‑type TP53 functions and provoke upregulation of its target genes, thus promoting apoptosis.26 Interestingly, t‑AML cases after successful APL treatment were reported.27
Genomic heterogeneity of t‑AML is associated with previous cytotoxic exposure, age of the patients, and the presence of clonal hematopoiesis prior to toxic exposure.28 It should be noted that, over the period between 2000 and 2021, the diagnostic strategy in t‑AML has evolved, with immunoflow cytometry, cytogenetic, and molecular biology examinations introduced in our center in 2008. Cytogenetic abnormalities (82.9%) and CK (26.8%) were detected in proportions of patients comparable with those reported in previous reports on t‑AML,3,4,7,19,29-32with overrepresentation of 11q23 translocations as well as adverse cytogenetics, including complex and monosomal karyotypes, and with underrepresentation of intermediate‑risk karyotypes (P <0.001).
Moreover, we found a similar frequency of FLT3‑ITD mutations (15.4%) but lower TP53 (12.5%) and NPM1 (4.5%) mutation frequency, as compared with other authors.3,7,33,34 Surprisingly, we detected 17p13 deletion more often (26.7%) than other studies.3 Nevertheless, the real number of molecular abnormalities could have only been determined through a comprehensive retrospective molecular analysis.
After the retrospective molecular analysis of 17p13 deletion and TP53 mutation, the 2017 ELN risk stratification category12 changed to adverse in 10 out of 46 cases, with the vast majority of the t‑AML patients (60.9%) being classified as adverse‑risk. Overall, 17p13 deletion or TP53 mutation was detected in 32.6% of the t‑AML patients in our study. Therefore, in the case of a clinical diagnosis of t‑AML, we strongly emphasize the need for testing for those abnormalities. When analyzing the results, in the absence of t‑AML–specific genetic stratification tool, we recommend adhering to the 2017 ELN criteria.12 Interestingly, c.704A>G p.(Asn235Ser), c.375G>C p.(Thr125=), c.733 G>C p.(Gly245Arg), and c.989T>C p.(Leu330Pro) TP53 DNA sequence variants detected in our study represented novel mutations in AML according to the COSMIC database.13
Targeted therapies were implemented in 2 patients with FLT3-positive t‑AML. Midostaurin was added to the induction chemotherapy (resulting in CR), while gilteritinib was implemented in refractory t‑AML (CR was not achieved). The number of t‑AML patients receiving targeted therapy was insufficient to conclude on the effectiveness of such treatment in our study.
There are several ongoing clinical trials on the use of molecular targeted therapies in ultra‑high‑risk TP53-mutant AML patients.35 Eprenetapopt (APR‑246) is a promising molecule destabilizing the individual TP53 point mutation, and the results of a phase 3 study on the effectiveness of this agent in combination with azacitidine (NCT03745716) are pending publication.36
Among the patients with t‑AML‑MRC, we reported a higher frequency of adverse risk category according to the 2017 ELN classification12 and a higher frequency of FLT3‑ITD mutation than in the individuals with t‑AML. Furthermore, in line with other reports, we observed a tendency toward worse treatment outcomes among the t‑AML‑MRC patients,37 which may be explained by the presence of additional, distinct secondary‑type mutations.38
AlloHCT in t‑AML significantly extended OS rates as compared with standard chemotherapy, which is in line with previous reports.39,40 An anti‑leukemic effect of alloHCT in t‑AML was pre‑eminently visible when the procedure was performed during CR, which confirmed observations of other groups.41,42 However, we reported higher OS and PFS rates after alloHCT than other authors,11,41 which indicated that not all t‑AML cases were characterized by poor prognosis.11 Older t‑AML patients undergoing alloHCT, with a higher comorbidity index score, represent preferable candidates for RIC regimens, which decrease toxicities related to the procedure.11,43 In our report, RIC was performed in the vast majority of the patients with t‑AML, which was a major difference as compared with other studies.41,42,44 Moreover, we observed a tendency toward longer OS rates after MAC (limited number of patients), which was consistent with the European Society for Blood and Marrow Transplantation data.45 Hence, the treatment strategy in t‑AML should be based on performing alloHCT as soon as possible in the patients in CR, and with the use of intensive conditioning regimens. On the other hand, the use of alloHCT should be questioned in t‑AML patients who are in an active disease stage.
The main cause of death in our study was t‑AML progression, which corresponds to the findings of other authors.41 Nonetheless, prolonged depletion of hematopoietic reserves resulting from previous cytotoxic treatment predisposed the patients to severe treatment‑related complications.13 In the t‑AML patients undergoing intensive chemotherapy, hepatotoxicity, renal toxicity, and cardiotoxicity were the most frequent causes of death. At the same time, after alloHCT, organ toxicity rates were higher, which reflected cumulative toxicity resulting from previous cytotoxic therapies. Organ toxicity resulting from alloHCT is mostly triggered by the use of MAC and calcineurin inhibitors, infections, and specific organ complications.31,44 Furthermore, primary malignancy progression was the cause of death in every tenth case of t‑AML.
We demonstrated a high frequency of infectious complications after intensive chemotherapy in t‑AML. However, it should be noted that prophylaxis and treatment strategies against fungal, bacterial, and viral infections evolved within the study period. After intensive chemotherapy, during neutropenia, gram‑positive bacteria (GPB) BSIs were the most common, which is in agreement with the results of other authors.46 Gram‑negative bacteria (GNB) in neutropenia were detected more frequently after alloHCT, which is in line with the recently observed shift toward GNB predominance after alloHCT.47 However, after intensive chemotherapy, GPB BSIs during neutropenia were more common. The t‑AML patients after alloHCT developed drug‑induced T cell dysfunction, which corresponds to a higher frequency of viral reactivations. Furthermore, prolonged neutropenia in t‑AML patients increases the risk of developing IFI.47 In our study, IFI was confirmed in 9.5% of the t‑AML cases after intensive chemotherapy, and in 4.3% alloHCT recipients, with the numbers being notably lower than in other studies.48,49 As infections represented the most common non–relapse‑related cause of death, improvements in their prophylaxis and treatment remain essential to improve t‑AML outcomes.3,50
We have identified several limitations of our study: 1) comprehensive information on the type and dose of cytotoxic agents was not registered, 2) t‑AML therapeutic strategies and known treatment complications changed over the 2 decades during which the study was conducted, 3) only a limited number of patients were subjected to a comprehensive molecular characterization within the study period.
To summarize, our study reveals that 1) not every t‑AML subtype is associated with a poor prognosis, 2) the treatment strategy in t‑AML should be based on performing alloHCT as soon as possible, 3) t‑AML is characterized by a high frequency of CK, predisposing to inferior OS, 4) molecular testing for the TP53 DNA sequence variant or 17p13 deletion allows for proper t‑AML stratification using the 2017 ELN criteria12 and creates an opportunity for therapeutic approaches targeting the TP53 mutation, 5) further improvements in the management of toxicity- and infection‑related t‑AML complications remain essential to improve its outcomes.
- Arber DA, Orazi A, Hasserjian R, et al. The 2016 revision to the World Health Organization classification of myeloid neoplasms and acute leukemia. Blood. 2016; 127: 2391‑2405. | Crossref
- Godley LA, Njiaju UO, Green M, et al. Treatment of therapy‑related myeloid neoplasms with high‑dose cytarabine / mitoxantrone followed by hematopoietic stem cell transplant. Leuk Lymphoma. 2010; 51: 995‑1006. | Crossref
- Kayser S, Döhner K, Krauter J, et al. The impact of therapy‑related acute myeloid leukemia (AML) on outcome in 2853 adult patients with newly diagnosed AML. Blood. 2011; 117: 2137‑2145. | Crossref
- Schoch C, Kern W, Schnittger S, et al. Karyotype is an independent prognostic parameter in therapy‑related acute myeloid leukemia (t‑AML): an analysis of 93 patients with t‑AML in comparison to 1091 patients with de novo AML. Leukemia. 2004; 18: 120‑125. | Crossref
- Hulegårdh E, Nilsson C, Lazarevic V, et al. Characterization and prognostic features of secondary acute myeloid leukemia in a population‑based setting: a report from the Swedish Acute Leukemia Registry. Am J Hematol. 2015; 90: 208‑214. | Crossref
SUPPLEMENTARY MATERIAL
ARTICLE INFORMATION