Associations of ANGPTL6, DOCK6, FABP1, and PCSK9 single-nucleotide variants with hypercholesterolemia in the Polish population: a cross-sectional study
Key words: ANGPTL6, FABP1, hypercholesterolemia, nucleotide variants, PCSK9


 CC BY-NC-SA 4.0
Associations of ANGPTL6, DOCK6, FABP1, and PCSK9 single-nucleotide variants with hypercholesterolemia in the Polish population: a cross-sectional study
Introduction: Hypercholesterolemia is a chronic noncommunicable disease predisposing to cardiovascular diseases. Genome‑wide association studies have shown that more than 500 common nucleotide variants are associated with dyslipidemia.
Objectives: We evaluated associations between selected nucleotide variants in ANGPTL6, DOCK6, FABP1, and PCSK9 genes and hypercholesterolemia in the Polish adult population sample.
Patients and methods: The study included 109 patients with hypercholesterolemia and 251 individuals with no diagnosed lipid disorder. Genotyping of ANGPTL6 rs8112063, DOCK6 rs737337 and rs17699089, FABP1 rs2241883 and rs2919872, and PCSK9 rs562556 and rs11206510 was carried out using high‑resolution melting curve analysis. Serum concentrations of FABP1, PCSK9, ANGPTL6, and ANGPTL8 were determined in 51 individuals by enzyme‑linked immunosorbent assay.
Results: Carriers of the FABP1 rs2919872 CC genotype were over 2.5‑fold less likely to be diagnosed with hypercholesterolemia than carriers of the T allele (odds ratio [OR], 0.386; 95% CI, 0.203–0.735; P = 0.003; Pcorr = 0.006). There were no associations between rs2919872 and serum lipid concentrations. Carriers of the ANGPTL6 rs8112063 C allele had an almost 2‑fold higher risk of developing hypercholesterolemia than carriers of the T allele (OR, 1.820; 95% CI, 1.053–3.144; P = 0.03; Pcorr = 0.046). Moreover, the carriers of the ANGPTL6 rs8112063 C allele had higher serum concentrations of high‑density lipoprotein cholesterol than those with TT genotype (P = 0.009). There were no significant associations between the other tested variants and hypercholesterolemia.
Conclusions: FABP1 rs2919872 and ANGPTL6 rs8112063 are associated with a risk of hypercholesterolemia in the Polish population.
What's new?
Growing evidence suggests that nucleotide variants in the genes associated with lipid metabolism play a role in susceptibility to hypercholesterolemia. We found out that the FABP1 rs2919872 and ANGPTL6 rs8112063 gene variants are associated with hypercholesterolemia in the Polish population. Moreover, rs2919872 remained a significant risk factor for hypercholesterolemia after the adjustment for age, sex, and body weight. We also noted a significant gene‑gene interaction among FABP1 rs2241883, FABP1 rs2919872, PCSK9 rs11206510, and ANGPTL6 rs8112063 variants related to hypercholesterolemia. ANGPTL6 rs8112063, FABP1 rs2241883, and PCSK9 rs562556 and rs11206510 were associated with lipid levels in the study group.
Introduction
Hypercholesterolemia is a chronic noncommunicable disease caused by an imbalance in the plasma lipid profiles due to a fat metabolism disorder.1 It is a well‑known risk factor for atherosclerosis, which is closely associated with cardiovascular diseases (CVD), such as coronary artery disease (CAD), myocardial infarction (MI), cerebral stroke, or peripheral artery disease.2 The prevalence of hypercholesterolemia is estimated at about 60% in the adult Polish population and has remained stable in the last decades, contributing to increased cardiovascular mortality.2,3
There are many genetic, environmental, and lifestyle risk factors for hyperlipidemia. Diet high in saturated fats, obesity, sedentary lifestyle, and smoking are all modifiable risk factors for this condition.4 Genetics can also play a role in the pathogenesis of elevated cholesterol levels.4 Genome‑wide association studies (GWAS) have shown that more than 500 common single‑nucleotide variants (SNVs) are associated with dyslipidemia.5
The PCSK9 gene (OMIM * 607786) was among the first genes associated with an increased risk of familial hypercholesterolemia and response to lipid‑lowering therapy.6 It is located on the small arm of chromosome 1p32. The gene encodes a proteinase K–like serine protease named proprotein convertase subtilisin kexin 9 (PCSK9).6 To date, multiple PCSK9 variants have been reported as risk factors for hyperlipidemia and CVDs.7,8
FABP1 (OMIM * 134650) is a gene located on chromosome 2p11 and it encodes a fatty acid binding protein (FABP) involved in lipid‑mediated signal pathways and metabolic homeostasis by regulating various lipid signals.9 Nucleotide variants in FABP1 have been found to affect lipid levels in diverse populations.10,11
A family of 8 proteins structurally similar to angiopoietins has been identified as angiopoietin‑like proteins (ANGPTLs).12 ANGPTLs are characterized by pleiotropic effects due to their involvement in lipid and glucose metabolism.13 Moreover, several SNVs in the DOCK6 gene (OMIM * 614194) located near the ANGPTL8 gene (OMIM * 616223) were associated with the components of metabolic syndrome in the Arabic population.14
This study aimed to assess the association between selected nucleotide variants in the FABP1, PCSK9, ANGPTL6, and DOCK6 genes and hypercholesterolemia in the Polish adult population sample. In addition, we analyzed correlations between these genetic alterations and plasma concentrations of human liver type fatty acid binding protein (L‑FABP), PCSK9, ANGPTL6, and ANGPTL8 proteins.
Patients and methods
Study population
The study was designed as a cross‑sectional survey. The STROBE (Strengthening the Reporting of Observational studies in Epidemiology) guidelines were employed. The study protocol was approved by the ethics committee at the Poznan University of Medical Sciences (758/16) and fulfilled the requirements of the Declaration of Helsinki. The study was performed between December 2016 and January 2020. It comprised 360 individuals, of whom 109 were diagnosed with and treated for hypercholesterolemia before the study onset, and 251 had no diagnosed lipid disorder. All the study participants were over 18 years old and gave their informed written consent. The exclusion criteria included secondary causes of dyslipidemia (hypothyroidism, alcohol abuse, treatment with anticonvulsants, corticosteroid therapy), cachectic conditions causing decrease in serum lipids (neoplasms, enteropathies, liver cirrhosis, chronic kidney disease), and lack of lipid‑lowering treatment in the group with hypercholesterolemia.
The diagnosis of hypercholesterolemia was the primary outcome of the study. Hypercholesterolemia was defined as plasma low‑density lipoprotein cholesterol (LDL‑C) level above the recommended values in a given CVD risk category diagnosed by the participant’s primary‑care physician before the study enrollment. The recommended LDL‑C concentrations for patients with low or moderate CVD risk were below 115 mg/dl. In patients at high CVD risk, the recommended LDL‑C concentration was below 100 mg/dl. For persons at very high risk (>10%), the recommended LDC‑C concentration was below 70 mg/dl.15-17 Secondary outcomes included serum concentrations of total cholesterol (TC), high‑density lipoprotein (HDL), LDL, triglycerides, as well as a diagnosis of hypertension defined as systolic blood pressure (SBP) equal to or above 140 mm Hg and / or diastolic blood pressure (DBP) equal to or above 90 mm Hg, and obesity defined as a body mass index (BMI) equal to or above 30 kg/m2.
We have also assessed anthropometric data such as body weight, height, BMI, as well as SBP, and DBP on the day of the blood sample collection. The diagnosis of diabetes was based on 1 of the 3 criteria: random blood glucose measured at any time of the day equal to or above 200 mg/dl (≥11.1 mmol/l), fasting blood glucose equal to or above 126 mg/dl (≥7.0 mmol/l), or blood glucose at 120 minutes during an oral glucose tolerance test equal to or above 200 mg/dl (≥11.1 mmol/l). Coronary artery disease was defined as the presence of over 50% stenosis in at least 1 coronary artery as determined by coronary angiography or noninvasive cardiac imaging or documented MI. Patients’ sex, age, and comorbidities were self‑reported.
Blood sample collection
Blood samples were collected in the morning after a 14‑hour overnight fast. Ulnar vein blood samples were collected into EDTA tubes to obtain whole blood and into separate tubes to obtain plasma. After preparation, the blood samples were frozen immediately and stored at −80 °C.
Laboratory methods
Serum concentrations of TCH, HDL cholesterol, triglycerides, alanine transaminase, aspartate transaminase, creatinine, and uric acid were measured by enzymatic colorimetric tests in a commercial laboratory (Roche Diagnostics, Mannheim, Germany). The serum LDL‑C concentration was calculated using the Friedewald formula. In the patients with serum triglyceride concentrations equal to or above 400 mg/dl, LDL‑C was measured directly (BioSystems S.A., Reagents and Instruments, Barcelona, Spain).
Plasma concentrations of L‑FABP, PCSK9, ANGPTL6, and ANGPTL8 (betatrophin) were measured in a randomly selected group of 51 individuals using an enzyme‑linked immunosorbent assay (ELISA). The following commercial kits were used: L‑FABP ELISA Kit (Cusabio Technology LLC, Wuhan, China), Human Proprotein Convertase 9/PCSK9 Immunoassay (R&D Systems, Inc., Minneapolis, Minnesota, United States), ANGPTL6 (human) ELISA Kit (Adipogen Life Sciences, Liestal, Switzerland), Human Betatrophin ELISA Kit (EIAab, Wuhan, China). All laboratory analyses were performed according to the manufacturer’s instructions.
Genotyping
The characteristics of the analyzed SNVs are shown in Supplementary material, Table S1. DNA was extracted from blood lymphocytes using the salting‑out method. Genotyping of FABP1, PCSK9, ANGPTL6, and DOCK6 SNVs was performed using a high‑resolution melting curve (HRM) analysis with 5 × HOT FIREPol EvaGreen HRM Mix (Solis BioDyne, Tartu, Estonia) on the Light Cycler 96 system (Roche Diagnostics). For quality control, approximately 10% of the randomly chosen samples were regenotyped using the same genotyping method; the concordance rate was 100%. The samples that failed the genotyping were excluded from further statistical analysis. The conditions of HRM analyses are shown in Supplementary material, Table S2.
Statistical analysis
All the statistical analyses were performed using the R statistical software.18 Data are presented as mean with SD, median with interquartile range (IQR), or boxplot statistics. The Pearson χ2 test and the Fisher exact test were used to analyze qualitative variables. The strength of the associations was evaluated by odds ratio (OR) with 95% CI in a dominant, recessive, and additive mode of inheritance. Logistic regression including sex, age, and body weight, as well as linear regression including age and sex, were applied to select significant variables among other possible determinants of a tested phenotype. Before every other statistical analysis on quantitative variables, data were checked for normal distribution (the Shapiro–Wilk test) and homoscedasticity (the Levene test). The t test and ANOVA were used to analyze normally distributed and homoscedastic data sets. Not normally distributed data sets were compared using the Mann–Whitney test, the Kruskal–Wallis test, and the Dunn test. The Spearman rank test was used to show correlations between selected variables. P values below 0.05 in 2‑tailed tests were chosen as statistically significant to facilitate decisions on the data possibly relevant for further analyses. Correction for multiple testing regarding the primary outcome was performed using a 1000‑fold permutation independence test. Missing data were not considered in the prevalence calculations and were reported as part of the descriptive statistics.
The power to detect genetic associations was determined using the Genetic Association Study (GAS) Power Calculator under the following assumptions: case / control ratio 1.564, significance level = 0.05, prevalence = 61%.2 It was calculated that a sample size of at least 360 participants would yield at least 90% power of detecting the relative risk of 1.50 in additive and dominant mode of inheritance in all analyzed SNVs (Supplementary material, Table S3).
Haplotype frequencies were estimated using Haploview 4.2 software (Broad Institute, Cambridge, Massachusetts, United States, http://www.broad.mit.edu/mpg/haploview/). Epistatic interactions between the tested SNVs were analyzed using the OR‑based multifactor dimensionality reduction method.19 Statistical significance in both tests was assessed using the 1000‑fold permutation test.
Results
Patient characteristics
The group of 542 individuals was screened, and 412 persons met the inclusion criteria without presenting any exclusion criteria. In addition, 52 individuals were excluded due to the lack of all required measurements. The final study group comprised 360 individuals, 109 patients with hypercholesterolemia, and 251 participants who were not diagnosed with hypercholesterolemia as per the assumed criteria. The results of a preliminary analysis of the participants’ clinical characteristics are summarized in Table 1. Men comprised 51% of the study participants and were less likely to be diagnosed with hypercholesterolemia than women. The patients with hypercholesterolemia were significantly older, had lower body weight, lower height, and higher SBP than the study participants without a lipid disorder. Statins were the most popular class of lipid‑lowering drugs, used in monotherapy in 93% of hypercholesterolemic individuals. Seven patients were treated with rosuvastatin and fenofibrate and 1 with ezetimibe and simvastatin. We did not observe intergroup differences regarding obesity, arterial hypertension, diabetes, or CAD prevalence.
Parameter | All participants (n = 360) | With hypercholesterolemia (n = 109) | Without hypercholesterolemia (n = 251) | P valuea,b | |
Values are shown as median (interquartile range) for nonparametric variables, and as net number and percentage for qualitative variables.
a Comparison of participants with vs without hypercholesterolemia
b χ2 test for qualitative variables and the Mann–Whitney test for quantitative variables
c Fisher test
SI conversion factors: to convert ALT and AST to μkat/l, multiply by 0.0167; cholesterol to mmol/l, by 0.0259; glucose to mmol/l, by 0.0555; triglycerides to mmol/l, by 0.0113.
Abbreviations: ALT, alanine aminotransferase; AST, aspartate aminotransferase; BMI, body mass index; DBP, diastolic blood pressure; HDL, high‑density lipoprotein; LDL, low‑density lipoprotein; SBP, systolic blood pressure; TG, triglycerides | |||||
Male sex | 183 (51) | 36 (33) | 147 (58.6) | 0.008 | |
Age, y | 59 (50–65) | 60 (55–67) | 58 (46–65) | 0.004 | |
Weight, kg | 78.4 (67.2–89) | 77.2 (66–86) | 80.9 (68.1–91) | 0.03 | |
Height, cm | 167.5 (160–176) | 164 (160–172) | 170 (162–178) | <0.001 | |
BMI, kg/m2 | 27.5 (25–30.5) | 27.7 (25–30.8) | 27.5 (25–30.3) | 0.54 | |
Glucose, mg/dl | 93 (84.5–101) | 93 (83–102) | 92.5 (85–101) | 0.84 | |
SBP, mm Hg | 135 (124–149.2) | 139 (129–154) | 133 (123–148) | 0.02 | |
DBP, mm Hg | 81 (73–89) | 83 (74–91) | 81 (73–88) | 0.11 | |
Obesity | 108 (30) | 37 (33.9) | 71 (28.3) | 0.43 | |
Hypercholesterolemia | 109 (30.3) | 109 (100) | – | N/A | |
Arterial hypertension | 126 (35.0) | 50 (45.9) | 76 (30.3) | 0.05 | |
Diabetes | 4 (1.1) | 1 (0.9) | 3 (1.2) | >0.99c | |
Coronary artery disease | 1 (0.3) | 0 | 1 (0.4) | >0.99c | |
AST, U/l | 27 (23–31) | 27 (24–30) | 27 (23–31) | 0.60 | |
ALT, U/l | 28 (22–37) | 26 (21–37) | 28 (22–37) | 0.31 | |
Total cholesterol, mg/dl | 202 (177–229) | 208 (182–240) | 200.5 (176–220) | 0.02 | |
HDL cholesterol, mg/dl | 61 (52–72.8) | 63 (54–78.3) | 60 (51–70) | 0.05 | |
LDL cholesterol, mg/dl | 106 (84–130) | 111 (79–149) | 103.7 (84–114) | 0.36 | |
TG, mg/dl | 138 (92–198.5) | 140.5 (99–200.5) | 130.5 (89–195.8) | 0.35 | |
Lipid‑lowering therapy | |||||
Only statin | Any type | 101 (28) | 101 (93) | – | N/A |
Atorvastatin | 57 (16) | 57 (52) | |||
Simvastatin | 39 (11) | 39 (36) | |||
Rosuvastatin | 5 (1) | 5 (5) | |||
Rosuvastatin and fenofibrate | 7 (2) | 7 (6) | – | N/A | |
Ezetimibe and simvastatin | 1 (0.3) | 1 (1) | – | N/A | |
FABP1 and tested phenotypes
Carriers of the FABP1 rs2919872 CC genotype were over 2.5‑fold less likely to be diagnosed with hypercholesterolemia than carriers of the T allele (P = 0.003; Pcorr = 0.006) (Table 2). The association remained significant after adjustment for age, sex, and body weight (P = 0.005) (Table 2). Moreover, the FABP1 rs2919872 C allele was associated with decreased risk of arterial hypertension in the dominant mode of inheritance (P = 0.03; Pcorr = 0.03) (Table 2). The quantitative analyses revealed no significant associations between FABP1 rs2919872 and lipid levels in the study participants (Supplementary material, Table S4).
Parameter | TT (n = 99) | CT (n = 184) | CC (n = 76) | Mode of inheritance | OR (95% CI) | P valuea | Adjusted OR (95% CI)b | Adjusted P valuea |
a Pearson χ2 test
b Adjusted for age, sex, and body weight
c Adjusted for age and body weight
d Adjusted for age and sex
Abbreviations: FABP1, Fatty Acid‑Binding Protein 1; OR, odds ratio | ||||||||
Male sex, n (%)c | 45 (24.7) | 96 (52.7) | 41 (22.5) | Dominant | 1.337 (0.841–2.133) | 0.22 | 1.258 (0.730–2.177) | 0.41 |
Recessive | 1.179 (0.711–1.967) | 0.52 | 1.469 (0.818–2.658) | 0.20 | ||||
Additive | 1.406 (0.773–2.570) | 0.27 | 1.446 (0.735–2.868) | 0.29 | ||||
Hypercholesterolemia, n (%) | 31 (28.4) | 65 (59.6) | 13 (11.9) | Dominant | 0.904 (0.553–1.477) | 0.69 | 0.950 (0.566–1.612) | 0.85 |
Recessive | 0.386 (0.203–0.735) | 0.003 | 0.389 (0.193–0.733) | 0.005 | ||||
Additive | 0.727 (0.530–0.999) | 0.049 | 0.731 (0.518–1.026) | 0.07 | ||||
Hypertension, n (%) | 44 (34.9) | 59 (46.8) | 23 (18.3) | Dominant | 0.598 (0.375–0.955) | 0.03 | 0.456 (0.270–0.763) | 0.003 |
Recessive | 0.786 (0.459–1.346) | 0.38 | 0.752 (0.418–1.323) | 0.33 | ||||
Additive | 0.746 (0.550–1.013) | 0.06 | 0.649 (0.459–0.910) | 0.01 | ||||
Obesity, n (%)d | 27 (25.0) | 57 (52.8) | 24 (22.2) | Dominant | 1.207 (0.721–2.018) | 0.47 | 1.162 (0.695–1.979) | 0.57 |
Recessive | 1.093 (0.632–1.889) | 0.75 | 1.065 (0.605–1.836) | 0.82 | ||||
Additive | 1.110 (0.806–1.527) | 0.52 | 1.087 (0.781–1.511) | 0.62 | ||||
There were no significant associations between the FABP1 rs2241883 SNV and the diagnosis of hypercholesterolemia. However, among the individuals without diagnosed lipid disorder and in the entire study group, the carriers of the FABP1 rs2241883 CC genotype had lower triglyceride serum concentrations than those with TT genotype (Supplementary material, Table S5).
ANGPTL6 and tested phenotypes
Carriers of the ANGPTL6 rs8112063 C allele had an almost 2‑fold higher risk of developing hypercholesterolemia than carriers of the T allele in the dominant mode of inheritance (P = 0.03; Pcorr = 0.046) (Table 3). The association did not remain significant after adjustment for age, sex, and body weight (P = 0.09). However, the carriers of the ANGPTL6 rs8112063 C allele had higher serum concentrations of HDL‑C than those with TT genotype in analyses including all study participants and those with hypercholesterolemia (Supplementary material, Table S6). The association between the rs8112063 C allele and HDL‑C concentration did not remain significant in a multivariable analysis including age and sex (Supplementary material, Table S7). No associations were found between the ANGPTL6 rs8112063 SNV and serum lipids in the individuals without a lipid disorder.
Parameter | TT (n = 97) | CT (n = 192) | CC (n = 71) | Mode of inheritance | OR (95% CI) | P valuea | Adjusted OR (95% CI)b | Adjusted P valuea |
a Pearson χ2 test
b Adjusted for age, sex, and body weight
c Adjusted for age and body weight
d Adjusted for age and sex
Abbreviations: ANGPTL6, Angiopoietin Like 6; others, see Table 2 | ||||||||
Male sex, n (%)c | 58 (31.7) | 92 (50.3) | 33 (18.0) | Dominant | 0.609 (0.378–0.974) | 0.04 | 0.638 (0.366–1.105) | 0.11 |
Recessive | 0.804 (0.477–1.353) | 0.41 | 0.840 (0.457–1.536) | 0.57 | ||||
Additive | 0.584 (0.313–1.081) | 0.09 | 0.610 (0.285–1.284) | 0.20 | ||||
Hypercholesterolemia, n (%) | 21 (19.3) | 63 (56.9) | 25 (22.9) | Dominant | 1.820 (1.053–3.144) | 0.03 | 1.622 (0.935–2.901) | 0.09 |
Recessive | 1.326 (0.766–2.297) | 0.31 | 1.294 (0.724–2.277) | 0.38 | ||||
Additive | 1.368 (0.995–1.882) | 0.05 | 1.334 (0.942–1.897) | 0.11 | ||||
Hypertension, n (%) | 30 (23.8) | 65 (51.6) | 31 (24.6) | Dominant | 1.284 (0.780–2.113) | 0.33 | 1.149 (0.681–1.963) | 0.61 |
Recessive | 1.583 (0.932–2.687) | 0.09 | 1.760 (1.000–3.094) | 0.05 | ||||
Additive | 1.281 (0.942–1.741) | 0.11 | 1.300 (0.924–1.837) | 0.13 | ||||
Obesity, n (%)d | 30 (27.8) | 61 (56.5) | 17 (15.7) | Dominant | 0.942 (0.568–1.561) | 0.82 | 0.889 (0.534–1.499) | 0.66 |
Recessive | 0.685 (0.376–1.247) | 0.21 | 0.682 (0.364–1.228) | 0.22 | ||||
Additive | 0.871 (0.632–1.199) | 0.40 | 0.837 (0.594–1.175) | 0.31 | ||||
PCSK9 and tested phenotypes
The analyzed PCSK9 nucleotide variants did not show any association with hypercholesterolemia diagnosis (Supplementary material, Tables S8 and S9). The GG genotype of PCSK9 rs562556 was associated with higher LDL‑C serum concentrations in individuals with and without hypercholesterolemia and with elevated TCH in the entire study population (Supplementary material, Table S10). Among the patients with hypercholesterolemia, carriers of the C allele of PCSK9 rs11206510 had lower TCH and LDL‑C concentrations than those with the TT genotype (Supplementary material, Table S11).
DOCK6 and tested phenotypes
There were no significant associations between the DOCK6 rs737337 and rs17699089 SNVs and the diagnosis of hypercholesterolemia or serum levels of circulating lipids.
Haplotype analyses
Haplotype analyses of FABP1, PCSK9, and DOCK6 nucleotide variants did not reveal any significance concerning the tested phenotypes.
Gene‑gene interactions related to hypercholesterolemia
A significant gene‑gene interaction was noted among FABP1 rs2241883, FABP1 rs2919872, PCSK9 rs11206510, and ANGPTL6 rs8112063 variants in relation to hypercholesterolemia (testing balance accuracy, 0.54; P = 0.02) (Table 4).
Number of risk genes | Models | Testing balanced accuracy | CVC | OR‑MDR | 95% CI | P valuea |
a Significance of accuracy, empirical P value based on 1000 permutations
| ||||||
2 | FABP1 rs2241883_DOCK6 rs737337 | 0.62 | 5/10 | 1.795 | 0.842–3.826 | 0.96 |
3 | FABP1 rs2241883_DOCK6 rs737337_ ANGPTL8 rs17699089 | 0.58 | 3/10 | 4.569 | 0.419–49.858 | 0.97 |
4 | FABP1 rs2241883_ FABP1 rs2919872_ PCSK9 rs11206510_ ANGPTL6 rs8112063 | 0.54 | 3/10 | 0.143 | 0.019–1.063 | 0.02 |
Protein plasma concentrations
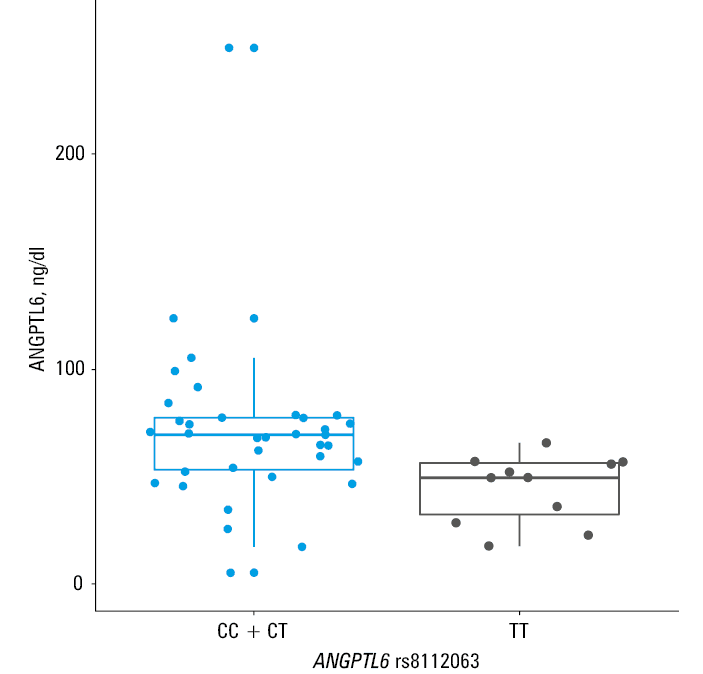
Carriers of the ANGPTL6 rs8112063 C allele had higher ANGPTL6 plasma concentrations as compared with carriers of the T allele in the dominant mode of inheritance (median [IQR], 69.4 [53.2–77.3] vs 49.5 [32.3–56.3] ng/dl; P = 0.003) (Figure 1). However, plasma ANGPTL6 concentrations did not correlate with serum lipid concentrations in the study group. Moreover, there were no associations between FABP1 rs2241883 and rs2919872, PCSK9 rs562556 and rs11206510, DOCK6 rs737337, and rs17699089 SNVs and plasma concentrations of their respective protein products.
Discussion
Hypercholesterolemia, a significant risk factor for CVDs, which in turn belong to the leading causes of death worldwide, contributes substantially to the health care costs related to cardiovascular events in developed countries.20,21 The researchers’ efforts focus on developing new preventive and therapeutic strategies to minimize the burden of lipid disorders. Many studies have demonstrated significant relationships between plasma proteins associated with lipid metabolism, such as apoprotein E, LDL receptor, or PCSK9, and the prevalence of dyslipidemia.7,22,23 However, the research on other genes encoding other proteins involved in lipid metabolism is limited.
The present study is the first to evaluate the associations between the ANGPTL6, DOCK6, FABP1, and PCSK9 nucleotide variants and hypercholesterolemia in the Polish population sample. Additional analysis of the plasma concentrations of ANGPTL6, ANGPTL8, L‑FABP, and PCSK9 enabled a better insight into how the tested genetic alterations could influence lipid metabolism.
Our study showed that the FABP1 rs2919872 and ANGPTL6 rs8112063 variants were associated with the diagnosis of hypercholesterolemia in the adult Polish population sample. Moreover, rs2919872, a common nucleotide variant in the 2KB upstream region of FABP1, remained a significant risk factor for hypercholesterolemia after age, sex, and body weight adjustment.
The L‑FABP, also known as fatty acid‑binding protein 1 (FABP1), is a member of the FABP family that is found in the cytosol of liver parenchymal cells and that plays a role in the incorporation of fatty acids into triglycerides.24 Serum levels of L‑FABP positively correlate with circulating triglyceride concentrations.11 Interestingly, Peng et al25 found that the carriers of the AA rs2919872 genotype had lower L‑FABP serum concentrations and serum triglyceride levels than those with the G allele in Chinese Han individuals. However, our analysis showed no significant associations between rs2919872 and serum concentrations of lipids or with plasma concentrations of L‑FABP. Moreover, rs2919872 is an intergenic variant near FABP1 and the Threonine Synthase Like 2 (THNSL2) gene.26 THNSL2 is expressed primarily in adipose tissue.27 Its polymorphic variants have been found to be associated with visceral fat accumulation and metabolic syndrome.27,28 To date, no papers have been published on the associations of rs2919872 with the phenotypes related to THNSL2. Our analysis also revealed no associations between rs2919872 and obesity.
The most widely studied FABP nucleotide variant, rs2241883, also known as T94A, is located in the exon of the human FABP1 gene and leads to a substitution resulting in a codon change in mRNA from ACT to GCT with a subsequent threonine‑to‑alanine substitution (T94A).29 In our study, the rs2241883 TT genotype corresponded with higher triglyceride serum concentrations in individuals without hypercholesterolemia and in all study participants (Supplementary material, Table S5). Concordantly, several research papers have reported that the TT genotype of T94A is associated with higher serum lipid levels and an increased risk of atherothrombotic cerebral infarction.30,31 On the other hand, other studies suggested that the rs2241883 CC genotype is associated with an increased risk of dyslipidemia and metabolic syndrome.10,32
Angiopoietin‑like proteins regulate energy and glucose homeostasis and share similarities with angiopoietins, such as a coiled‑coil domain and angiogenic effects.33 Studies involving animal models suggest that ANGPTL6 might be involved in the development of obesity and could be related to insulin resistance.34 In addition, the French MONICA study suggested that the C allele of rs8112063 could be a risk factor for metabolic syndrome.35 Our study showed that hypercholesterolemic patients have a higher frequency of ANGPTL6 rs8112063 C allele than those without a lipid disorder (Table 3). To our knowledge, no prior studies reported a relationship between ANGPTL6 rs8112063 and lipid disorders. A paper by Namkung et al36 revealed that individuals with metabolic syndrome have higher circulating ANGPTL6 levels than healthy people. On the other hand, patients with type 2 diabetes had lower ANGPTL6 concentrations than healthy individuals in a prospective cohort study by Fan et al.37 Interestingly, we observed that men were more likely than women to be the carriers of the C allele of rs8112063. Sex could be a confounding factor in the relationship between the studied ANGPTL6 SNV and hypercholesterolemia, given that men were less likely to be hypercholesterolemic in our study (Table 1). To our knowledge, this is the first study to report an association between rs8112063 and sex. We did not observe any further associations between ANGPTL6 plasma concentrations and hypercholesterolemia, obesity, or diabetes. However, the carriers of the rs8112063 C allele had higher ANGPTL6 circulating concentrations than those with the TT genotype (Figure 1). Moreover, the carriers of the rs8112063 C allele had higher serum concentrations of HDL‑C than those with the TT genotype (Supplementary material, Table S6). However, the association between ANGPLT6 rs8112063 and serum HDL‑C concentrations lost its significance after adjustment for sex and age (Supplementary material, Table S7).
PCSK9, the ninth member of the subtilisin family of kexin‑like proconvertases, is mainly expressed in the liver, kidney, and intestine and is involved in the lipid metabolism through degradation of the LDL receptors.38,39 PCSK9 is a highly polymorphic gene, and its variants have been associated with familial hypercholesterolemia, response to statin therapy, accelerated atherosclerosis, and MI.39-42 PCSK9 rs562556 is a variant in exon 9, located within the linker domain between the catalytic domain and the C‑terminal domain, which was initially reported as a gain‑of‑function mutation.43 Gain‑of‑function mutations interfere with the recycling of LDL receptor to the cell surface, reducing LDL‑C uptakes and increasing LDL‑C levels.44 However, the results of newer studies, including individuals from diverse ethnic backgrounds, suggested a protective effect on lipid profile resulting in lower serum LDL‑C.44,45 Surprisingly, we did not observe any significant direct associations between the tested PCSK9 nucleotide variants and the diagnosis of hypercholesterolemia in the Polish population sample (Supplementary material, Tables S8 and S9). Nevertheless, a gene‑gene interaction analysis revealed an epistatic interaction between the SNVs in the genes associated with lipid disorders in univariate analyses, namely FABP1 rs2241883, FABP1 rs2919872, and ANGPTL6 rs8112063 and PCSK9 rs11206510 related to the diagnosis of hypercholesterolemia (Table 4). Previous studies, including white individuals, reported reduced LDL‑C and TCH levels in people with the C allele of PCSK9 rs11206510, whereas analyses including Asian participants revealed opposite results.7,46 Conversely, we observed an association between the rare alleles of PCSK9, rs11206510 and rs562556, and increased circulating levels of TCH and LDL‑C (Supplementary material, Tables S10 and S11).
Study limitations
Our study has several limitations. A primary obstacle is a relatively small number of individuals diagnosed with hypercholesterolemia. In our power calculations, we assumed a prevalence of hypercholesterolemia of over 60% based on the previous studies in the Polish population.2,47 Individuals with hypercholesterolemia comprised only one‑third of our study population, which could lead to underpowered tests.
The surprisingly low prevalence of hypercholesterolemia in our study might be explained by the fact that we had only included patients with a previously diagnosed lipid disorder and who were on a lipid‑lowering therapy in the hypercholesterolemic group. This fact could limit the generalizability of our study, given that over 50% of patients might be unaware of an existing lipid disorder, and only about 20% of individuals with a lipid disorder receive hypolipemic treatment.47,48
Furthermore, the serum LDL‑C concentration was calculated using the Friedewald formula in the patients with serum triglyceride concentrations below 400 mg/dl, which are derived from TCH, HDL‑C, and triglyceride concentrations. The Friedewald formula assumes a fixed ratio of triglyceride levels to very LDL‑C (TG:VLDL‑C) of 5:1.49 Applying a factor of 5 to individual patients is problematic given the variance in the TG:VLDL‑C ratio across the range of triglyceride and non–HDL‑C levels and could potentially contribute to decreased accuracy and precision of the derived LDL‑C concentration, especially among patients with serum triglyceride concentrations between 200 and 400 mg/dl.50
Moreover, the investigation was conducted in a specific population comprising Polish adults, and the findings should be used with caution when extrapolated to other ethnicities. Therefore, further investigations of putative causal variants of lipid disorders in large cohorts encompassing diverse ethnicities are necessary. Finally, plasma concentrations of protein products of the tested nucleotide variants were evaluated only in 51 individuals. However, the patients in whom the ELISA analysis of the tested proteins was performed were chosen randomly, increasing the reliability of the results.
Conclusions
In summary, the results of our study demonstrate for the first time that rs2919872, a common gene alteration in the promoter region of FABP1, and rs8112063, an intronic variant in ANGPTL6, are associated with hypercholesterolemia in the Polish population sample. Especially the rs8112063 nucleotide variant of ANGPTL6 might be important in regulating the expression of ANGPTL6 and influencing the HDL‑C levels. Therefore, further research on ANGPTL6 and FABP1 could potentially contribute to advances in preventing and treating lipid disorders.
- Zhao XN, Sun Q, Cao YQ, et al. Association between apolipoprotein gene polymorphisms and hyperlipidemia: a meta‑analysis. BMC Genomic Data. 2021; 22: 14. | Crossref
- Zdrojewski T, Solnica B, Cybulska B, et al. Prevalence of lipid abnormalities in Poland. The NATPOL 2011 survey. Kardiol Pol. 2016; 74: 213‑223. | Crossref
- Fihel A, Pechholdová M. Between ‘pioneers’ of the cardiovascular revolution and its ‘late followers’: mortality changes in the Czech Republic and Poland since 1968. Eur J Popul Rev Eur Démographie. 2017; 33: 651‑678. | Crossref
- Karr S. Epidemiology and management of hyperlipidemia. Am J Manag Care. 2017; 23 (9 Suppl): S139‑S148.
- Tam CHT, Lim CKP, Luk AOY, et al. Development of genome‑wide polygenic risk scores for lipid traits and clinical applications for dyslipidemia, subclinical atherosclerosis, and diabetes cardiovascular complications among East Asians. Genome Med. 2021; 13: 29. | Crossref
SUPPLEMENTARY MATERIAL
ARTICLE INFORMATION