A deep learning model to identify the fluid overload status in critically ill patients based on chest X-ray images
Key words: chest X-ray, critical illness, deep learning, fluid overload


 CC BY-NC-SA 4.0
A deep learning model to identify the fluid overload status in critically ill patients based on chest X-ray images
Introduction: Recent studies have highlighted adverse outcomes of fluid overload in critically ill patients. Therefore, its early recognition is essential for the management of these patients.
Objectives: Our aim was to propose a deep learning (DL) model using data from noninvasive chest X‑ray (CXR) imaging associated with the fluid overload status.
Patients and methods: We collected data from the Medical Information Mart for Intensive Care IV (MIMIC‑IV, v. 1.0) and MIMIC Chest X‑Ray (v. 2.0.0) databases for modeling, and from our hospital database for testing. The extravascular lung water index (ELWI) greater than 10 ml/kg and the global end‑diastolic volume index (GEDI) greater than 700 ml/m2 were used as threshold values for the fluid overload status. A DL model with a transfer learning strategy was proposed to predict the fluid overload status based on CXR images, and compared with clinical and semantic label models. Additionally, a visualization technique was adopted to determine the important areas of features in the input images.
Results: The DL model showed a relatively strong performance for predicting the ELWI (area under the curve [AUC] = 0.896; 95% CI, 0.819–0.972 and AUC = 0.718; 95% CI, 0.594–0.822, respectively) and the GEDI status (AUC = 0.814; 95% CI, 0.699–0.930 and AUC = 0.649; 95% CI, 0.510–0.787, respectively) in both the primary and the test cohort. The performance was better than that of the clinical and semantic label models.
Conclusions: As CXR is routinely used in the intensive care unit, a simple, fast, low‑cost, and noninvasive DL model based on this modality can be regarded as an effective supplementary tool for identifying fluid overload, and should be widely adopted in the clinical setting, especially when invasive hemodynamic monitoring is not available.
What's new?
In the present study we established a deep learning (DL) model based on chest X‑ray (CXR) images to predict the fluid overload status in critically ill patients. Validated by an independent external test dataset, the DL model shows a relatively strong generalization performance. Additionally, as compared with previously reported CXR scores or our CXR label models, the DL model has certain advantages and the potential for clinical application. As CXR is routinely used in the intensive care unit, our DL model can be useful for identifying the fluid overload status, especially in the cases where invasive hemodynamic monitoring is unavailable. The present study is the first to combine data from the new MIMIC‑IV database and the MIMIC‑CXR database, providing a feasible ground for future research.
Introduction
Fluid therapy for restoration and maintenance of tissue perfusion is a routine component of management of almost all critically ill patients.1 Early and adequate fluid resuscitation by intravenous injection is considered crucial for the stabilization of tissue hypoperfusion, especially in patients with septic shock.2 However, there is accumulating evidence that fluid overload is associated with increased mortality and can also lead to progressive organ dysfunction.3-5 Therefore, early recognition of the fluid overload status is essential for the management of critically ill patients. Although determination of the actual extent of fluid overload in such patients is challenging, several methods of fluid overload quantification are worth taking into consideration, that is, clinical evaluation, cumulative fluid balance (FB), chest X‑ray (CXR), ultrasound examination, bioimpedance vector analysis, and invasive hemodynamic monitoring.3,6
The pulse indicator continuous cardiac output (PiCCO) system is an “all‑inclusive” hemodynamic monitoring procedure for the assessment of fluid load using transpulmonary thermodilution technology.7 Extravascular lung water index (ELWI) is a measure of the volume of water accumulated in the lungs outside the pulmonary vascular system,7 whereas global end‑diastolic volume index (GEDI), reflecting the blood volume in the 4 chambers of the heart, is a quantitative volumetric variable that directly measures cardiac preload.7 ELWI and GEDI have been shown to be reliable indicators of the volume status, and to have a number of advantages over traditional pressure preload parameters.7-10 However, the difficulty associated with repeated invasive procedures, complications during and after catheterization, unreliable measurements in the presence of some specific cardiopulmonary diseases, and high testing costs limit the availability of the PiCCO monitoring. Therefore, a noninvasive and readily available method to predict the volume status of critically ill patients is required.
CXR is one of the most accessible and repeatable examinations under routine conditions in the intensive care unit (ICU). Preliminary discrimination of patients with or without fluid overload during a CXR evaluation remains clinically important for ICU clinicians. Previous studies11-18 have explored the predictive values of chest radiography for ELWI and GEDI using subjective and objective CXR scores in critically ill patients. However, the predictive performance of most CXR scoring systems was not satisfactory. In recent decades, artificial intelligence and deep learning (DL) have been widely used for research on medical imaging and have provided new prospects in the fields of medical diagnosis, treatment, and prognosis analysis.19 Using a DL strategy, CXR was employed to diagnose a wide spectrum of diseases from simply “abnormal findings” to more specific diagnoses, such as pneumonia, pneumothorax, and tuberculosis.20 Nevertheless, there have been no previous studies on the applicability of DL for predicting the fluid overload status based on chest radiographs. Therefore, we proposed a DL model to explore the CXR imaging information associated with the fluid overload status based on the ELWI and GEDI values, and compared it with clinical and semantic label models.
Patients and methods
Data source
The data of the primary cohort were extracted from the Medical Information Mart for Intensive Care IV (MIMIC‑IV, v. 1.0)21,22 and MIMIC Chest X‑Ray (MIMIC‑CXR, v. 2.0.0) databases.22-24 MIMIC‑IV is a relational database containing real critical care data of patients admitted to the Beth Israel Deaconess Medical Center between 2008 and 2019.21,22 The MIMIC‑CXR database is a large, publicly available dataset of chest radiographs with free‑text radiology reports that contains 377 110 images corresponding to 227 835 radiographic studies.22-24 One of the study investigators (WZho) was allowed to download data from the databases, having completed the “Data or Specimens Only Research” course (record identity, 25222342).
Patient records and CXR images for the external test dataset were obtained from the First Affiliated Hospital of Wenzhou Medical University after approval from that institution’s ethics committee (202302090921).
Informed consent of the study patients was not required because the present study did not use any protected health‑related information or impacted clinical care.
Study design
A flowchart of the study process is shown in Figure 1. Patients with available PiCCO monitoring parameters assessed in the period between 24 hours before and 24 hours after the CXR examination were enrolled in the study. We excluded patients aged 16 years or younger, as well as those with repeated admissions to the ICU, the length of hospital stay shorter than 24 hours, CXR examinations performed outside the ICU, incomplete clinical data for further analysis, and comorbidities that interfered with the results of PiCCO monitoring, including pulmonary embolism, acquired or congenital absence of the lung, aortic aneurysm, congenital heart disease (eg, atrial or ventricular septal defect, tetralogy of Fallot, patent ductus arteriosus, and valvular regurgitation). The external test dataset was collected between July 1, 2017, and June 30, 2021, according to the same inclusion and exclusion criteria.
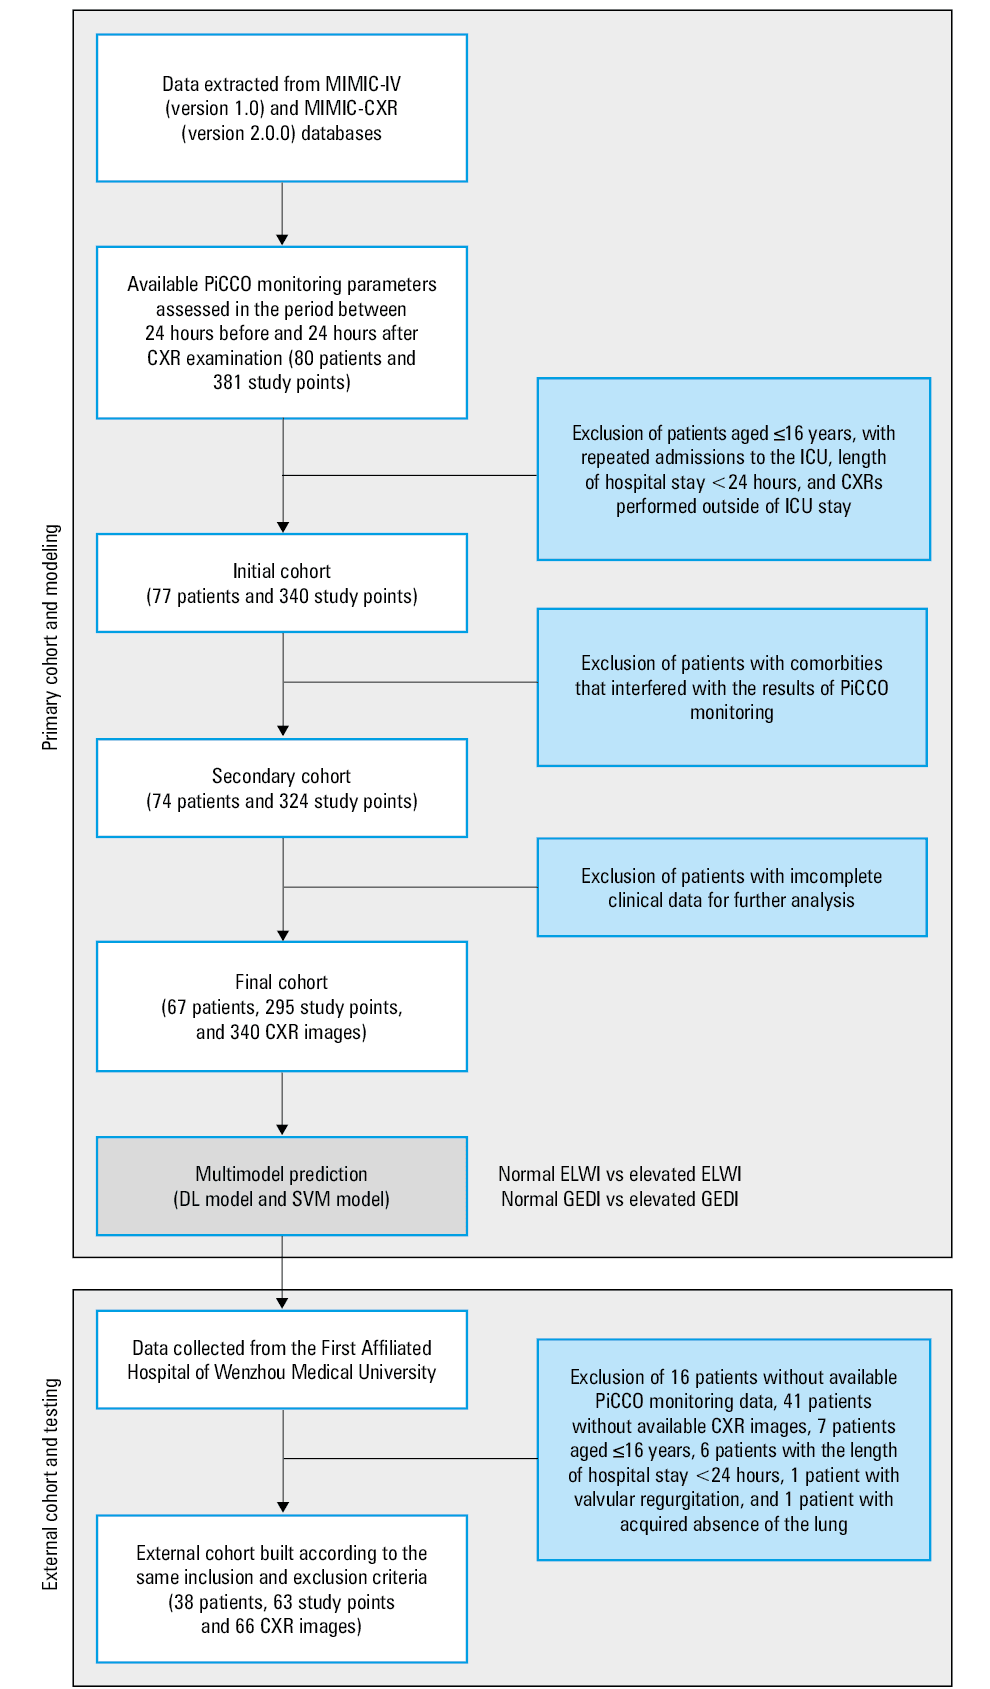
Abbreviations: CXR, chest X‑ray; DL, deep learning; ELWI, extravascular lung water index; GEDI, global end‑diastolic volume index; ICU, intensive care unit; MIMIC‑CXR, Medical Information Mart for Intensive Care‑Chest X‑Ray; MIMIC‑IV, Medical Information Mart for Intensive Care IV; PiCCO, pulse indicator continuous cardiac output; SVM, support vector machine
Data extraction
The data were extracted from MIMIC‑IV and the electronic medical records system of our hospital; detailed information is presented in Tables 1 and 2. The Sequential Organ Failure Assessment (SOFA) score was calculated based on the predefined criteria.25 FB was calculated based on the following formula: FB = (total fluid in − total fluid out) / admission weight.3 All CXR images in the MIMIC‑CXR dataset have been assigned specific semantic labels by CheXpert with binary mapping to 0 or 1 (Uncertain‑Zeros model and Uncertain‑Ones model).26 Of note, CheXpert is a large dataset that contains a labeler to automatically detect the presence of 14 observations in radiology reports, capturing uncertainties inherent in the interpretation of radiographs.26 CXR labels of the external test dataset were obtained by consulting the radiology reports. If a label was uncertain, 2 radiologists re‑read the CXR images to determine the final label by consensus.
Characteristics | MIMIC‑CXR dataset (n = 67) | External test dataset (n = 38) | |
Data are presented as medians (interquartile ranges) or numbers (percentages).
Abbreviations: see Figure 1 | |||
Sex | Male | 38 (56.7) | 24 (63.2) |
Female | 29 (43.4) | 14 (36.8) | |
Admission age, y | ≤30 | 5 (7.5) | 0 |
>30 and ≤60 | 28 (41.8) | 18 (47.4) | |
>60 | 34 (50.7) | 20 (52.6) | |
Race or ethnicity | White | 43 (64.2) | 0 |
Black | 4 (6) | 0 | |
Hispanic | 1 (1.5) | 0 | |
Other | 19 (28.4) | 38 (100) | |
Admission weight, kg | 80 (71.1–95) | 59 (53–70) | |
Comorbidities | Congestive heart failure | 12 (17.9) | 7 (18.4) |
Chronic pulmonary disease | 25 (37.3) | 1 (2.6) | |
Chronic renal disease | 3 (4.5) | 4 (10.5) | |
Length of stay, d | Hospital | 19.11 (7.27–29.77) | 13.85 (6.78–26.58) |
ICU | 9.75 (4.94–15.72) | 7.94 (6.35–12.47) | |
Characteristics | MIMIC‑CXR dataset (n = 295) | External test dataset (n = 63) | |
Data are presented as medians (interquartile ranges) or numbers (percentages).
a CXR labels in the MIMIC‑CXR dataset were assigned by CheXpert with binary mapping to 0 or 1 (Uncertain‑Zeros model and Uncertain‑Ones model).
SI conversion factors: to convert glucose to mmol/l, multiply by 0.0555.
| |||
Fluid balance, ml/kg | 69.27 (20.97–137.03) | 45.53 (5.76–78.40) | |
SOFA score | 7 (5–10) | 10 (7–12) | |
CVP, mm Hg | 13 (9–16) | 12 (8–15) | |
Physical examination results | Bilateral lung crackles / wheezing | 106 (35.9) | 42 (66.7) |
General / lower extremity edema | 199 (67.5) | 17 (27) | |
Vital signs | Heart rate, bpm | 95.51 (82.06–106.07) | 113 (97–136) |
Mean blood pressure, mm Hg | 79.36 (72.19–89.13) | 88 (80–100) | |
Respiratory rate, breaths/min | 22.16 (19.02–25.38) | 25 (20–30) | |
SpO2, % | 97.58 (96.05–98.84) | 98 (96–100) | |
Glucose, mg/dl | 130.07 (115.91–150.09) | 167.4 (136.8–234.0) | |
PiCCO monitoring parameters | CO, l/min | 6.53 (5.38–8.20) | 5.54 (4.12–7.3) |
CI, l/min/m2 | 3.48 (2.94–4.20) | 3.13 (2.46–4.18) | |
SVRI, dynes s cm-5/m2 | 1637.5 (1240.38–2001) | 2021 (1531–2654) | |
ELWI, ml/kg | 10.33 (8.4–15.67) | 11.9 (9.9–15.5) | |
Normal ELWI (≤10 ml/kg) | 139 (47.1) | 17 (27) | |
Elevated ELWI (>10 ml/kg) | 156 (52.9) | 46 (73) | |
GEDI, ml/m2 | 762.33 (607.67–981.78) | 775 (653–903) | |
Normal GEDI (≤700 ml/m2) | 116 (39.3) | 20 (31.7) | |
Elevated GEDI (>700 ml/m2) | 179 (60.7) | 43 (68.3) | |
CXR labels (Uncertain‑Zeros)a | Cardiomegaly | 59 (20) | 19 (30.2) |
Lung edema | 70 (23.7) | 26 (41.3) | |
Pleural effusion | 135 (45.8) | 5 (7.9) | |
CXR labels (Uncertain‑Ones)a | Cardiomegaly | 74 (25.1) | – |
Lung edema | 91 (30.8) | – | |
Pleural effusion | 142 (48.1) | – | |
We artificially set the examination time of each CXR as a study point. The mean values of PiCCO monitoring parameters and vital statistics assessed in the period between 24 hours before and 24 hours after the corresponding study point were regarded as baseline data. We evaluated the SOFA score, central venous pressure (CVP), and physical examinations assessed or performed at the time point closest to the corresponding study point and within 24 hours before and after the corresponding study point. The same principle applied to the measurement of FB.
Pulse indicator continuous cardiac output monitoring parameters
The PiCCO monitoring parameters recorded were cardiac output, cardiac index, systemic vascular resistance index, ELWI, and GEDI. ELWI greater than 10 ml/kg and GEDI greater than 700 ml/m2 were regarded as threshold values for the fluid overload status.
Chest X‑ray image acquisition and preprocessing
All frontal CXR images were directly obtained from the MIMIC‑CXR‑JPG database (v. 2.0.0), which is wholly derived from MIMIC‑CXR, providing JPG files converted from DICOM images.22,23,27 To help prevent the network from overfitting and memorizing the exact details of the training images, a data augmentation method with randomized operations including reflection (X or Y axis), rotation (−180 ° to +180 °), rescaling ( × 0.5 to × 2), horizontal translation (−50 pixels to +50 pixels), and vertical translation (−50 pixels to +50 pixels) was used. Before entering the network for training and validation, all images were converted to an RGB format, resized to match the size of the network, and normalized.
Development, testing, and visualization of the deep learning model
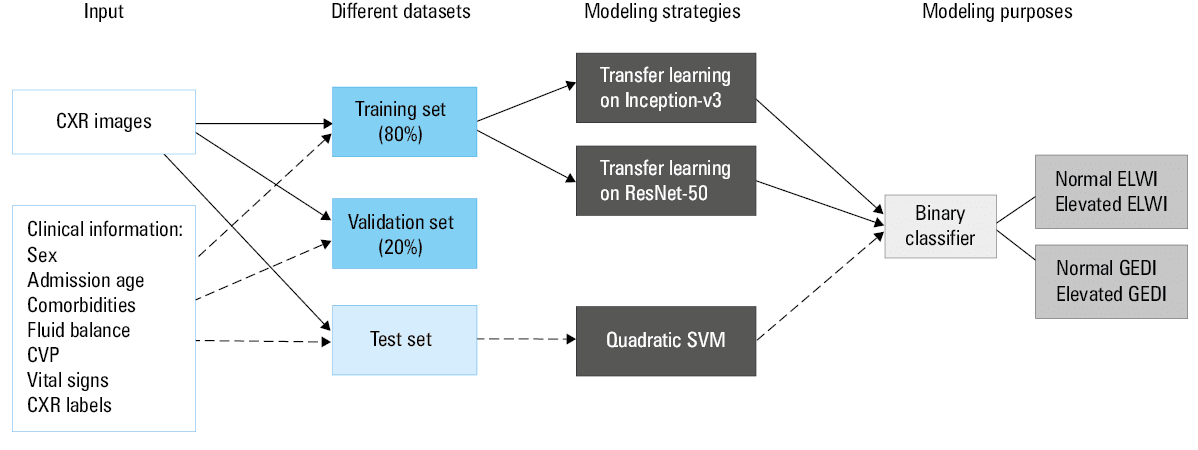
The pipeline of the DL method with CXR images for predicting the ELWI and GEDI status is shown in Figure 2. The CXR images in the MIMIC‑CXR dataset were randomly divided into training (80%) and validation (20%) sets during modeling, and those from our hospital were used as a test set. The validation set was used to monitor model performance and protect against overfitting when training. We used 2 pretrained networks, ResNet‑50 and Inception‑v3, convolutional neural networks 50 and 48 layers deep, respectively, to learn the natural image features from the ImageNet dataset.28,29 This transfer learning strategy is suitable for use with sparse datasets as it enlarges the training data. The detailed steps of transfer learning involve loading the data and pretrained network, replacing the last 3 layers with a new, fully connected layer, softmax layer, and classification output layer, fine‑tuning for our new classification problem by specifying the options of the new fully connected layer, specifying training hyperparameters, and training a new network. In addition, the optimization of stochastic gradient descent with momentum was used to train the weights with an initial learning rate of 0.0001, minibatch size of 16, drop factor of 0.1, drop period of 10, and momentum of 0.9. To avoid overfitting and improve generalization, we adopted a strategy of multiple training networks (5 models), and each network was tested on the test dataset, with performance calculated for the average output. The final prediction score (Scorefinal) was then calculated using the following formulas weighted by the combined performance of ResNet‑50 and Inception‑v3:
Abbreviations: CVP, central venous pressure; others, see Figure 1
ScoreResNet‑50 or Inception‑v3 = (Scoremodel‑1 + Scoremodel‑2 + Scoremodel‑3 + Scoremodel‑4 + Scoremodel‑5)/5;
Scorefinal = α1 × ScoreResNet‑50 + α2 × ScoreInception‑v3;
α1 = AUCResNet‑50 / (AUCResNet‑50 + AUCInception‑v3), and α2 = 1.000–α1;
Here, AUCResNet‑50 and AUCInception‑v3 represent the area under the receiver operating characteristic curve (AUC) values of ResNet‑50 and Inception‑v3, respectively.
The DL network is very complex and its decisions are not intuitive with regard to interpretation. To further explain the prediction process of the DL network, we adopted a visualization method, that is, the locally interpretable model‑agnostic explanations (LIME) technique, to determine the important areas of features in the input images.30 Red areas on the LIME map had greater importance for classification decisions, while blue areas were less important.
Statistical analysis
The numerical variables were expressed as medians with interquartile ranges. Categorical variables were expressed as frequencies with percentages. The variables clinically associated with fluid overload were considered for establishing the clinical model and the semantic label model (a detailed list of variables is shown in Supplementary material, Tables S1 and S2). As shown in Figure 2, the quadratic support vector machine (SVM) method was used for further modeling and testing. Similarly, the average score calculated from 5 SVM models was regarded as the final prediction output. The performances of all models were presented with the receiver operating characteristic (ROC) curve, sensitivity, specificity, and accuracy. We set the cutoff value of score / probability for the ROC curve to 0.5. The Hanley and McNeil test was used to evaluate the differences in the AUC values among the different models.31 Additionally, cumulative frequency and decision curve were used to expansively interpret the predictive performance of the DL model.
A 2‑sided P value below 0.05 was considered significant. Statistical analyses were performed using the SPSS software, version 22.0 (SPSS, Chicago, Illinois, United States) and the MedCalc software, version 19.0.5 (MedCalc, Ostend, Belgium). The DL model was implemented using the MATLAB software, version R2020b (MathWorks, Natick, Massachusetts, United States).
Results
Baseline characteristics
Baseline characteristics of the study patients and study points are summarized in Tables 1 and 2, respectively. According to the threshold values of the parameters reflecting the fluid overload status, the patients were divided into groups with normal and elevated ELWI and GEDI.
Development and testing of the deep learning model
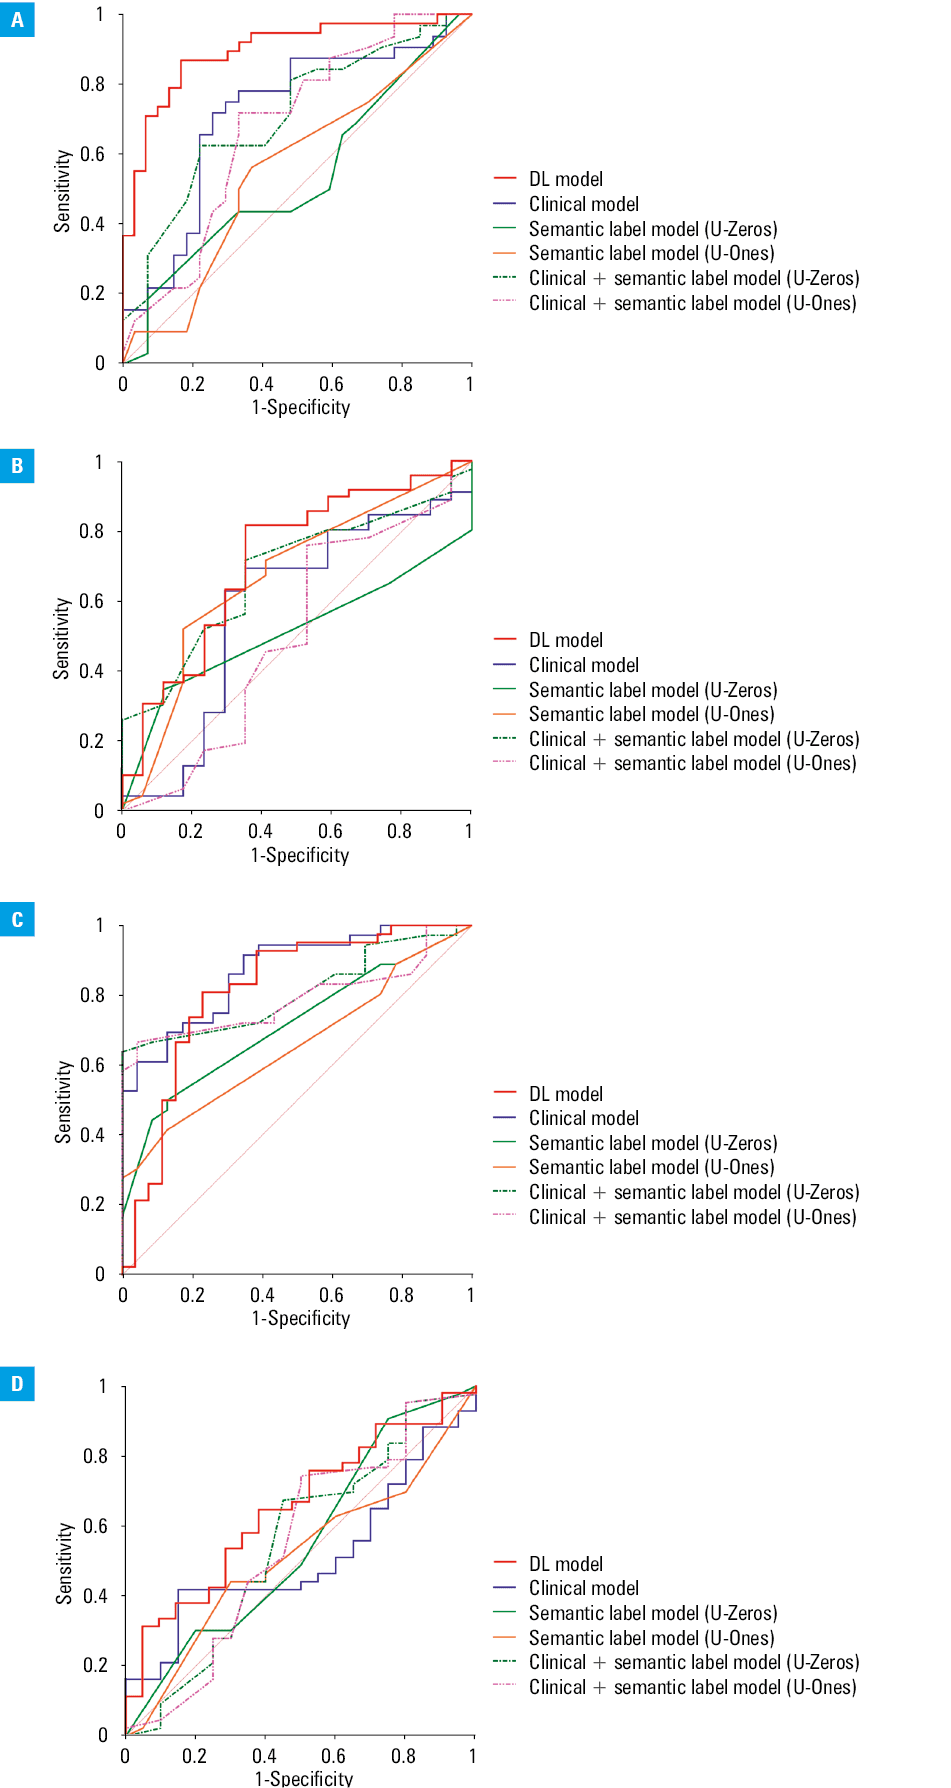
In the primary cohort, a total of 340 CXR images (272 images for training and 68 images for validation) were used to transfer learning on our binary classification problems and build the predictive DL models. Subsequently, 66 CXR images from our hospital were used to test independently the generalization performance of the DL models. As shown in Table 3, for both the validation and independent test datasets, the DL models showed encouraging average performance for predicting the ELWI (AUC = 0.896; 95% CI, 0.819–0.972 and AUC = 0.718; 95% CI, 0.594–0.822, respectively) and the GEDI status (AUC = 0.814; 95% CI, 0.699–0.930 and AUC = 0.649; 95% CI, 0.510–0.787, respectively). The ROC curves of the DL models in the 2 datasets are plotted in Figure 3.
Models | Cohorts | ELWI | GEDI | ||||||
Sensitivity | Specificity | Accuracy | AUC | Sensitivity | Specificity | Accuracy | AUC | ||
The results are expressed as ratios with 95% CIs.
a CXR labels in the MIMIC‑CXR dataset were assigned by CheXpert with binary mapping to 0 or 1 (Uncertain‑Zeros model and Uncertain‑Ones model).
Abbreviations: AUC, area under the receiver operating characteristic curve; others, see Figure 1 | |||||||||
Clinical model | Primary | 0.844 (0.665–0.941) | 0.519 (0.324–0.708) | 0.695 (0.560–0.805) | 0.716 (0.579–0.854) | 0.861 (0.697–0.948) | 0.652 (0.428–0.828) | 0.780 (0.650–0.873) | 0.871 (0.783–0.959) |
Test | 0.587 (0.433–0.727) | 0.294 (0.114–0.560) | 0.508 (0.380–0.635) | 0.583 (0.407–0.759) | 0.651 (0.490–0.786) | 0.250 (0.096–0.494) | 0.524 (0.395–0.650) | 0.515 (0.368–0.663) | |
Semantic label model (Uncertain‑Zeros)a | Primary | 0.656 (0.468–0.808) | 0.370 (0.201–0.575) | 0.525 (0.392–0.655) | 0.532 (0.398–0.664) | 0.889 (0.730–0.964) | 0.217 (0.083–0.442) | 0.627 (0.491–0.747) | 0.713 (0.581–0.823) |
Test | 0.804 (0.656–0.901) | 0 (0–0.229) | 0.587 (0.456–0.708) | 0.512 (0.383–0.640) | 0.977 (0.862–0.999) | 0.050 (0.003–0.269) | 0.683 (0.552–0.791) | 0.552 (0.421–0.677) | |
Semantic label model (Uncertain‑Ones)a | Primary | 0.563 (0.379–0.732) | 0.630 (0.425–0.799) | 0.593 (0.458–0.717) | 0.556 (0.420–0.685) | 0.889 (0.730–0.964) | 0.217 (0.083–0.442) | 0.627 (0.491–0.747) | 0.658 (0.523–0.777) |
Test | 0.674 (0.519–0.800) | 0.588 (0.335–0.806) | 0.651 (0.520–0.764) | 0.672 (0.542–0.785) | 0.977 (0.862–0.999) | 0.050 (0.003–0.269) | 0.683 (0.552–0.791) | 0.515 (0.385–0.642) | |
Clinical + semantic label model (Uncertain‑Zeros)a | Primary | 0.625 (0.438–0.783) | 0.778 (0.573–0.906) | 0.695 (0.560–0.805) | 0.709 (0.577–0.820) | 0.750 (0.575–0.873) | 0.565 (0.349–0.761) | 0.678 (0.542–0.790) | 0.810 (0.687–0.900) |
Test | 0.435 (0.293–0.588) | 0.353 (0.153–0.614) | 0.413 (0.292–0.544) | 0.682 (0.552–0.793) | 0.721 (0.561–0.842) | 0.300 (0.128–0.543) | 0.587 (0.456–0.708) | 0.554 (0.423–0.679) | |
Clinical + semantic label model (Uncertain‑Ones)a | Primary | 0.719 (0.530–0.856) | 0.667 (0.460–0.828) | 0.695 (0.560–0.805) | 0.675 (0.541–0.792) | 0.750 (0.575–0.873) | 0.565 (0.349–0.761) | 0.678 (0.542–0.790) | 0.792 (0.667–0.887) |
Test | 0.500 (0.351–0.649) | 0.529 (0.285–0.761) | 0.508 (0.380–0.635) | 0.505 (0.376–0.634) | 0.721 (0.561–0.842) | 0.300 (0.128–0.543) | 0.587 (0.456–0.708) | 0.552 (0.421–0.677) | |
DL model | Primary | 0.842 (0.681–0.934) | 0.833 (0.646–0.937) | 0.838 (0.725–0.913) | 0.896 (0.819–0.972) | 0.833 (0.680–0.925) | 0.692 (0.481–0.849) | 0.779 (0.659–0.867) | 0.814 (0.699–0.930) |
Test | 0.796 (0.652–0.893) | 0.647 (0.386–0.847) | 0.758 (0.634–0.851) | 0.718 (0.594–0.822) | 0.644 (0.487–0.777) | 0.619 (0.387–0.810) | 0.636 (0.508–0.749) | 0.649 (0.510–0.787) | |
Abbreviations: ROC, receiver operating characteristic; U, uncertain; others, see Figure 1
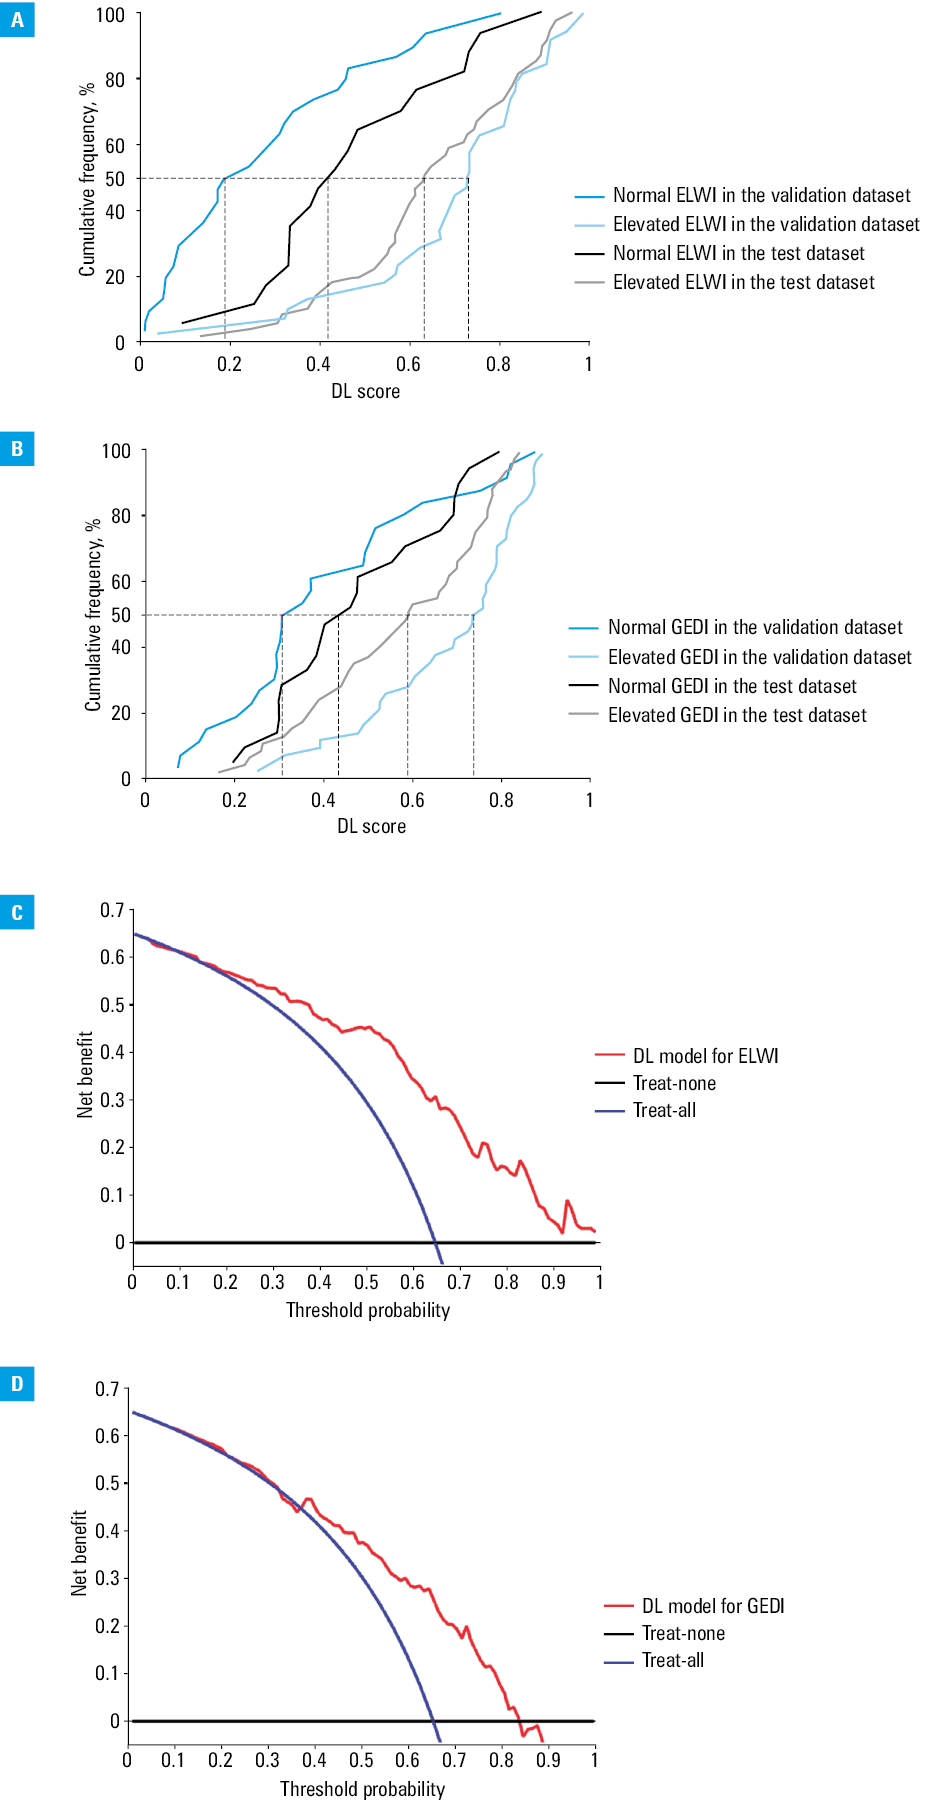
In addition, Figure 4A and 4B shows that the cumulative frequency curves of the DL scores revealed significant differences between the normal and elevated ELWI groups (P <0.001 in the validation dataset and P = 0.005 in the test dataset) as well as between the normal and elevated GEDI groups (P <0.001 in the validation dataset and P = 0.05 in the test dataset) in the 2 datasets.
Abbreviations: see Figure 1
The decision curves of the DL models showed that when threshold probability was greater than 15.2% for predicting the ELWI status or between 36.8% and 83.2% for predicting the GEDI status, the DL models showed greater benefits than either treat‑all or treat‑none strategies (Figure 4C and 4D). More importantly, the decision curves revealed an advantage of a maximum of 0.6 to 0.7 net benefit for the DL model with a broad range of threshold probability.
Comparison of the deep learning model with clinical and semantic label models
The clinical model and the semantic label model were built for comparison with the DL model. Sex, age on admission, comorbidities (congestive heart failure, chronic pulmonary disease, and chronic renal disease), FB, CVP, and physical examination results (bilateral lung crackles / wheeze and general or lower extremity edema) were included as covariates in the clinical model. Three radiographic features (cardiomegaly, lung edema, and pleural effusion) related to fluid overload were incorporated into the semantic model. Moreover, the combined model trained by both clinical and semantic factors involved variables statistically significant in the univariable analysis when modeling, which are indicated in bold in Supplementary material, Tables S1 and S2.
As shown in Table 3 and Figure 3, the absolute values of AUC in the DL models were significantly higher than those in the clinical models for predicting the ELWI and the GEDI status. A similar improvement over the semantic model and the combined model was also observed in the 2 datasets. A detailed comparison of AUCs is presented in Supplementary material, Table S3.
Visualization of the deep learning model
To better understand the predictive principle of the DL network, we adopted the image interpretability technique to produce a smooth heatmap of the important areas by calculating the importance of rectangular features and upsampling the resulting map. Figure 5 shows the simplified heat map of the DL model, as well as the corresponding prediction score and semantic labels. There may be several unreliable important areas on the heat map that interfered with the final DL score. However, the heat map still mainly focused on the lung and heart fields. Similarly, when clinicians read CXR images to evaluate the fluid overload status, they also focus on radiographic features of the lung and heart fields. As shown in Figure 5, the patients with lung edema or pleural effusion are often more likely to have fluid overload. However, the results of our study showed that the performance of the DL model was superior to that of the cardiopulmonary semantic features identified on CXR images for predicting the fluid overload status, which was attributed to better discrimination of image details by the DL network.
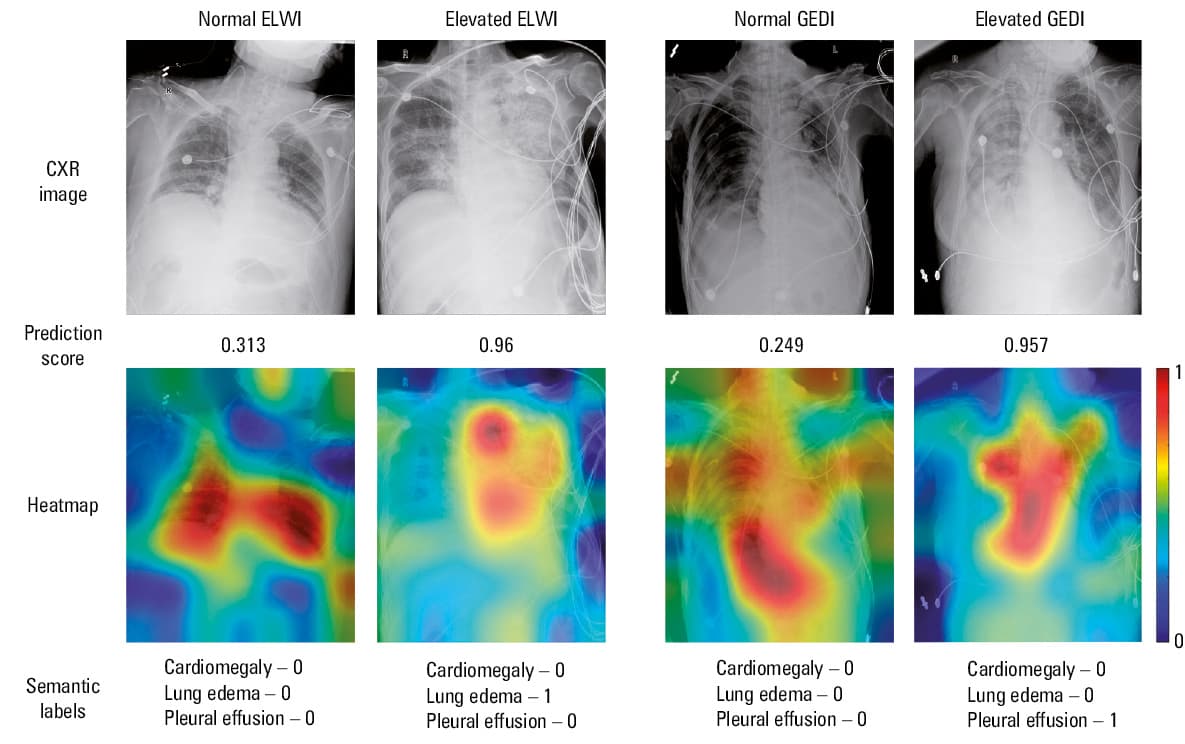
Abbreviations: see Figure 1
Discussion
Fluid overload is an almost universal finding in critically ill patients due to the emphasis on the importance of early fluid resuscitation and the difficulty for most clinicians in accurately controlling the fluid intake to meet only the actual demand.3,6,32 Moreover, recent studies have highlighted the adverse outcomes of fluid overload, while a restrictive fluid strategy has been shown to significantly reduce the duration of ventilation and short‑term mortality in critically ill patients.3-6,33 Therefore, early recognition of fluid overload has become a primary component of the management of critically ill patients. As a substitute for pulmonary artery catheterization, with accurate assessment of the constant and dynamic hemodynamic statuses, PiCCO monitoring has been used extensively in the management of critically ill patients.34 Furthermore, the parameters obtained from the PiCCO system, especially ELWI and GEDI, are considered effective and precise for quantitative evaluation of the fluid status of critically ill patients.7,33 ELWI is a marker reflecting the volume of water accumulated in the lungs outside the pulmonary vascular system, corresponding to the sum of interstitial, intracellular, alveolar, and lymphatic fluid, not including pleural effusion.7,33 ELWI, assessed using transpulmonary thermodilution technology, was shown to be closely associated with the gold standard gravimetric measurement in experimental animal studies.35-37 GEDI is used to assess the sum of intracardiac blood volume using transpulmonary thermodilution technology.7 Similarly to ELWI, GEDI has been shown to be a reliable indicator of cardiac preload and fluid responsiveness in animal models.38,39 Recent studies have confirmed that ELWI- and GEDI‑guided fluid management can improve clinical outcomes in critically ill patients, including lower cumulative FB, improved short‑term mortality, and shorter duration of mechanical ventilation and ICU stay.7,33,40,41 On the basis of the clinical decision tree, elevated ELWI (>10 ml/kg) and GEDI (>700 ml/m2) values indicate an increase in the risk of further fluid overload, and fluid removal should be initiated at the post‑shock phase. However, limitations of the transpulmonary thermodilution technology may lead to unreliable measurements of ELWI and GEDI in the cases of pulmonary vascular occlusion, lung resection, heterogeneous lung injury, and application of positive end‑expiratory pressure.7,33 We eliminated these interferences as much as possible in this study by excluding patients with related comorbidities. In addition, the difficulty of repeated invasive procedures, complications during and after catheterization, and high testing costs may limit the feasibility of PiCCO monitoring in the clinical setting, especially in developing countries / territories. Therefore, we hypothesized that a low‑cost DL method combined with repeatable and noninvasive CXR instead of routine PiCCO monitoring may be useful for predicting the fluid overload status in critically ill patients.
With the rapid development of ultrasound and computed tomography technologies, the clinical role of CXR has been gradually diminishing. However, as most ICU patients are at high risk of adverse events during transportation, the preliminary information that can be provided by portable CXR is still important to ICU clinicians. Most studies on the correlation between ELWI and CXR were performed in the 20th century. Early reports confirmed a positive correlation between the CXR score and the ELWI value using the double indicator dilution technique in critically ill patients.11-13,42 Similarly, recent studies have shown that a standardized CXR score can improve diagnostic accuracy for predicting the severity of pulmonary edema represented by ELWI using the new transpulmonary thermodilution method.17,18 Nevertheless, several studies have shown the opposite, namely, that CXR does not correlate with ELWI or GEDI assessments of lung water and volume status.15,16 The correlations between CXR findings and ELWI values drawn from prior studies were inconsistent, with correlation coefficients ranging from 0.35 to 0.83.11-13,18 Similarly, the predictive performance of the semantic label model in our study was also not satisfactory. These discrepancies may be due to the fact that the CXR score and CXR label methods focus mainly on the low‑order visual features of CXR images via subjective judgments of radiologists, which can lead to over- or underestimation of the ELWI and GEDI values.
Several previous studies using the MIMIC‑CXR database for modeling reported a DL model of CXR developed for accurately and automatically detecting pulmonary edema, atelectasis, consolidation, cardiomegaly, pneumothorax, and pleural effusion.43-45 As compared with previously reported CXR scores or our CXR label models, the DL model of CXR has certain advantages and the potential for clinical application. First, feature extraction by traditional machine learning mainly relies on manual extraction, which is only effective for simple tasks, whereas the DL algorithm can automatically extract abstract features. Moreover, fine‑tuning a network with transfer learning is usually much easier and faster than training a network with randomly initialized weights from scratch, which is useful even with scarce training data. Second, the DL algorithm has significant superiority in terms of recognition capabilities of high‑order visual features for image details, and the identified important areas are visually displayed on a smooth heatmap. Third, a simple, fast, low‑cost, and noninvasive DL strategy can be used as an effective supplementary tool for CXR reports. Therefore, it should be developed for clinical application, especially in the settings where invasive hemodynamic monitoring is unavailable.
This study has several strengths. Through combining data from the new MIMIC‑IV database and the MIMIC‑CXR database, it provided a feasible idea for future research. A multimodel comparative analysis was performed by including patient records, clinical examinations, CXR labels, and CXR images. We used 2 completely independent datasets from different ethnic backgrounds for modeling and testing. Due to the differences in the distribution of the 2 datasets, that is, “data mismatch,” it was difficult for the training model to fit the test dataset well. However, from another perspective, this strategy also further verified the true strength and generalization performance of the DL model. The calculation strategy for averaging 2 mature neural networks and multiple training values increased the credibility of the results.
Nevertheless, this study also has limitations. First, to reduce the size of image storage and facilitate the smooth progress of our research, the DICOM format had to be replaced by the JPG format, which inevitably caused a loss of image information. During the conversion in the MIMIC‑CXR‑JPG database, a set of standardization processes has been implemented to preserve the image quality as much as possible. Second, due to the insufficient application of PiCCO monitoring in the MIMIC‑IV database and our hospital, the small sample size may have led to overfitting of the training model. Data augmentation can enlarge the training samples to some extent, but further collection of more raw data is still preferable. Third, as the Note module is temporarily unavailable in MIMIC‑IV (v. 1.0), data from lung ultrasound and echocardiography, which have been shown to be effective methods of fluid overload quantification, were not included in the comparative analysis. Therefore, further studies are warranted to supplement the results of our study.
Conclusions
In this study, a DL model based on CXR images was established to predict the fluid overload status in critically ill patients. Validated by an independent external test dataset, the DL model showed a relatively strong generalization performance, which was better than that of the clinical and semantic label models. As CXR is routinely used in the ICU, a simple, fast, low‑cost, and noninvasive DL model could constitute an effective supplementary tool for identifying the fluid overload status. Such a model would be particularly beneficial in the settings where invasive hemodynamic monitoring is unavailable.
- Vincent JL. Fluid management in the critically ill. Kidney Int. 2019; 96: 52‑57. | Crossref
- Levy MM, Evans LE, Rhodes A. The surviving sepsis campaign bundle: 2018 update. Crit Care Med. 2018; 46: 997‑1000. | Crossref
- Claure‑Del Granado R, Mehta RL. Fluid overload in the ICU: evaluation and management. BMC Nephrol. 2016; 17: 109. | Crossref
- Messmer AS, Zingg C, Müller M, et al. Fluid overload and mortality in adult critical care patients‑a systematic review and meta‑analysis of observational studies. Crit Care Med. 2020; 48: 1862‑1870. | Crossref
- Vaara ST, Korhonen AM, Kaukonen KM, et al. Fluid overload is associated with an increased risk for 90‑day mortality in critically ill patients with renal replacement therapy: data from the prospective FINNAKI study. Crit Care. 2012; 16: R197. | Crossref
SUPPLEMENTARY MATERIAL
ARTICLE INFORMATION