The influence of elevated heart rate assessed by automated office blood pressure measurement on the risk of cardiovascular events
Key words: arterial hypertension, blood pressure measurement, cardiovascular risk factor, heart rate


 CC BY-NC-SA 4.0
The influence of elevated heart rate assessed by automated office blood pressure measurement on the risk of cardiovascular events
Introduction: The predictive value of heart rate (HR) assessed using an automated office blood pressure measurement (AOBPM) remains unknown.
Objectives: This study aimed to determine the impact of AOBPM HR on the risk of cardiovascular events in hypertensive patients with and without prior cardiovascular disease (CVD).
Patients and methods: Data of 9361 participants of the Systolic Blood Pressure Intervention Trial (median follow‑up, 3.26 years) were used to perform a post hoc analysis based on baseline AOBPM HR levels (<50, 50–60, 60–70, 70–80, and >80 bpm). Clinical composite end point (CE) was defined as myocardial infarction (MI), acute coronary syndrome other than MI, heart failure exacerbation, stroke, or cardiovascular death. Cardiovascular‑related and all‑cause mortalities were also evaluated.
Results: A total of 1877 participants with and 7484 individuals without CVD were included. Those with higher baseline HR were less frequently men and more often smokers, had higher body mass index and estimated glomerular filtration rate, lower baseline systolic blood pressure, and higher diastolic blood pressure. No differences were observed in the CE frequency, its components, and all‑cause death between the baseline HR groups. Elevated HR (>70 bpm) was associated with a higher risk of CE, MI, and cardiovascular death in a multivariable Cox model. Moreover, the model determining the MI risk showed a J‑shaped relationship with HR and a significant interaction term (P = 0.049) between HR and CVD history.
Conclusions: High AOBPM HR is associated with a higher risk of cardiovascular events and mortality, whereas low HR may result in higher MI risk in patients with previous CVD.
What's new?
We showed that heart rate (HR) above 70 bpm assessed using an automated office blood pressure measurement (AOBPM) is associated with an increased risk of cardiovascular events in individuals with and without a prior diagnosis of cardiovascular disease. When AOBPM is used to estimate HR, an increased risk of cardiovascular events is observed at lower HR values than currently suggested. Although high HR is related to elevated risk of cardiovascular events, the risk for myocardial infarction may be increased in patients with prior cardiovascular disease and low HR values.
Introduction
Elevated heart rate (HR) is associated with increased cardiovascular morbidity and mortality in the general population and patients previously diagnosed with cardiovascular disease (CVD).1-3 A post hoc analysis of data from the LIFE (Losartan Intervention For End point) study revealed that a 10 bpm increase in HR results in a 16% increase in the risk of cardiovascular death and 25% higher risk of all‑cause mortality.4 In the post hoc analysis of the VALUE (Valsartan Antihypertensive Long‑term Use Evaluation) trial, participants with HR in the highest quintile had a higher risk for heart failure (HF), sudden cardiac death, myocardial infarction (MI), stroke, and all‑cause mortality by 1.93 (95% CI, 1.45–2.55), 1.49 (95% CI, 0.97–2.28), 1.38 (95% CI, 1.03–1.85), 1.49 (95% CI, 1.1–2.00), and 1.98 (95% CI, 1.64–2.38), respectively, as compared with participants with HR in the lowest quintile.5 In both LIFE and VALUE studies, HR was measured using an electrocardiogram (ECG).
Although ECG most accurately determines HR, some trials also assessed the relationship between HR and cardiovascular events, when HR was considered to be equivalent to the pulse rate obtained during blood pressure (BP) measurements.6
Additionally, HR obtained during office BP measurement (OBPM) or 24‑hour ambulatory BP monitoring (ABPM) is associated with cardiovascular outcomes. Based on a large dataset from the Spanish Ambulatory Blood Pressure Registry, Böhm et al7 inferred that increased HR measured during OBPM is associated with an elevated risk for all‑cause and cardiovascular death. Similarly, elevated HR recorded using ABPM over 24 hours, activity, and night‑time rest periods were factors associated with increased risk of all‑cause death or cardiovascular death.7 Interestingly, the authors found that office HR was higher than the mean 24‑hour HR; however, no relevant difference between the office and mean day HR was observed.
Some data also indicated that HR measured during home BP monitoring (HBPM) in participants without significant arrhythmias is associated with an increased risk of cardiovascular events.8 Using data from the Ohasama study, Hozawa et al8 showed that increased HR measured during HBPM is associated with higher cardiovascular mortality independently from HBPM values.
Current evidence supporting the use of HR measured during automated office blood pressure measurements (AOBPM) to predict cardiovascular events is lacking. AOBPM is an increasingly used and promising method for BP evaluation.9,10 Due to multiple, unattended BP measurements and less susceptibility to white‑coat effects, AOBPM is believed to provide lower BP levels than traditional OBPM.11 To our knowledge, HR assessed using AOBPM has not yet been compared with the values obtained using other measurement methods; however, the assumption that AOBPM provides the same values might not be justified. Therefore, this study aimed to examine the impact of HR assessment with AOBPM on the risk of cardiovascular events in participants with and without prior CVD diagnosis.
Patients and methods
Data source
The study is a post hoc analysis of data obtained from the SPRINT (Systolic Blood Pressure Intervention Trial), a randomized, multicenter trial, showing that lowering of systolic BP (SBP) to the intensive target (<120 mm Hg) in comparison with the standard goal (<140 mm Hg) is associated with reduced risks of cardiovascular events (hazard ratio, 0.75; 95% CI, 0.64–0.89; P <0.001). The study methodology and results are widely described and published elsewhere.12
Only individuals at a high risk for cardiovascular events were eligible to participate in the SPRINT. The SPRINT participants were older than 50 years, had BP of 130–180 mm Hg, and cardiovascular or chronic kidney disease history or the Framingham risk score for 10‑year cardiovascular risk above 15%. The individuals with a history of a stroke or diabetes were not enrolled.
Among the 9361 study participants, 1877 (20.1%) previously had clinical or subclinical CVD. In the SPRINT study, prior clinical CVD was recognized when a participant had a history of at least 1 of the following: previous MI, percutaneous coronary intervention, coronary artery bypass grafting, carotid endarterectomy, carotid stenting, peripheral artery disease with revascularization, acute coronary syndrome with or without resting ECG changes, ECG changes on a graded exercise test, positive cardiac imaging study, at least a 50% diameter stenosis of a coronary, carotid, or lower extremity artery, and abdominal aortic aneurysm of at least 5 cm in diameter with or without repair. Subclinical CVD was identified if coronary artery calcium score was at least 400 Agatston units within the past 2 years, ankle‑brachial index was equal to or below 0.90 within the past 2 years, or left ventricular hypertrophy was diagnosed based on ECG (computer reading), echocardiogram report, or other cardiac imaging procedure reports within the past 2 years.
The median follow‑up period for the SPRINT participants was 3.26 years.
Our analysis was approved by the Ethics Committee at the Medical University of Warsaw (AKBE/115/2019).
Heart rate measurement
Both HR and BP during the SPRINT were measured using an automated office system (Model 907, Omron Healthcare, Kyoto, Japan), 3 times per visit at 1‑minute intervals and after 5 minutes of rest. The mean of 3 measurements was calculated.
The first available (randomization visit) HR, SBP, and diastolic blood pressure (DBP) measurements were identified as baseline values. Mean in‑trial indices were computed as a mean of each parameter measurement available during the trial. The analysis was performed in association with HR, defined as below 50, 50–60, 60–70, 70–80, and above 80 bpm.
Study outcome
The clinical composite end point (CE) was identified as the primary outcome in the SPRINT and defined as MI, acute coronary syndrome other than MI, exacerbation of HF, stroke, or cardiovascular death. MI and cardiovascular death risk were also evaluated. Other individual CE and all‑cause death components were also analyzed.
Statistical analysis
All continuous variables were expressed as mean (SD) or median and interquartile range (IQR), depending on the distribution. All discrete variables were expressed as number and percentage. The t test, the Wilcoxon test, analysis of variances, the Kruskal–Wallis or χ2 test were employed for within‑group comparison, depending on the number of compared groups and variable characteristics. The Cox proportional models supported by restricted cubic splines were used to establish a nonlinear relationship between HR and the measured outcome of risk events. The interaction term representing the cubic spline was incorporated into the Cox model including also age, sex, SBP, current smoking status, allocation to the study treatment arm, black race, statin use, aspirin use, total cholesterol concentration, glucose concentration, and the estimated glomerular filtration rate. The number of spline knots was selected based on the lowest Akaike Information Criterion. In order to prepare the plots presenting the relationship between the hazard ratio and HR, we assumed that for HR equal to 65 bpm the risk is 1. The analysis was performed using R 4.1.0 (R Foundation for Statistical Computing, Vienna, Austria) for environmental statistical computing. Survival, survminer, and RMS packages were used.
Data availability statement
Access to the SPRINT data was granted by the National Heart Lung and Blood Institute (NHLBI) for the current analysis (Accession number: HLB02021921a). Nevertheless, this manuscript does not necessarily reflect the opinions or views of the SPRINT Research Group or NHLBI. The SPRINT data are available upon reasonable request from NHLBI via Biologic Specimen and Data Repository Information Coordinating Centre. The authors have no right to share the data.
Results
Comparison of participants with and without prior cardiovascular disease
Among the 9361 SPRINT participants, 1877 had prior CVD. They were older and more commonly men, smokers, and had a history of chronic kidney disease more often than those without CVD diagnosis at baseline.
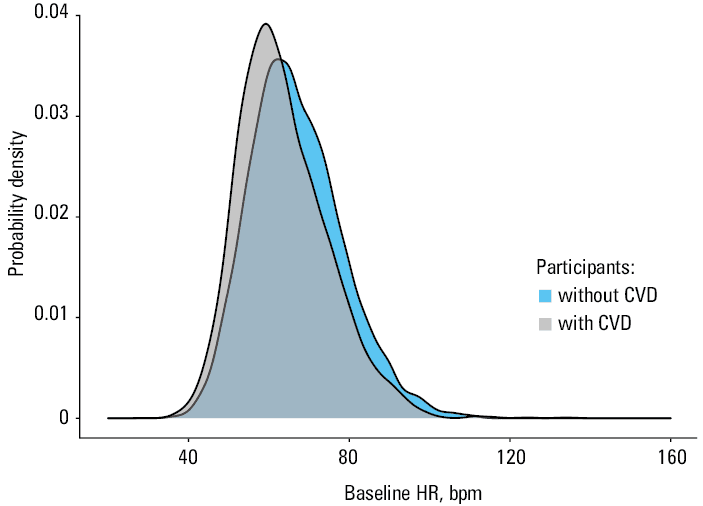
The participants with a history of CVD also had lower baseline HR, SBP, and DBP than those without prior CVD diagnosis. During the trial, CE events were more than twice more common in the participants with than without a CVD history (10.9% vs 4.8%). All individual components of CE were also more commonly recorded when CVD was present at baseline. The participants with prior CVD had also lower in‑trial HR and DBP than those without prior CVD diagnosis, whereas in‑trial SBP was similar in both groups. More individuals with prior CVD diagnosis than without CVD received treatment with β-blockers at baseline (60.4% vs 29.3%; P <0.001). There was no difference in the use of nondihydropyridine calcium channel blockers (eg, diltiazem or verapamil) between the groups (5.1 vs 5.2%; P = 0.76, respectively). Only 1 person received digoxin at the study beginning and had prior CVD. In Figure 1 the distribution of baseline HR in the participants with and without a history of CVD disease is presented. Lower values and closer to the central value distribution of baseline HR in the participants with prior CVD (Figure 1) are probably associated with extensive use of HR lowering drugs (β-blockers) in this group.
A detailed comparison of the SPRINT participants based on a history of CVD is presented in Table 1.
Parameter | Participants without CVD (n = 7484) | Participants with CVD (n = 1877) | P value | |
Data are presented as mean (SD), median (interquartile range), or number (percentage) of patients.
SI conversion factors: to convert glucose to mmol/l, multiply by 0.0555; HDL and total cholesterol to mmol/l, by 0.0259; triglycerides to mmol/l, by 0.113, creatinine to µmol/l, by 88.4.
Abbreviations: ASA, acetylsalicylic acid; BMI, body mass index; CE, composite clinical end point event; CKD, chronic kidney disease; CVD, cardiovascular disease; DBP, diastolic blood pressure; eGFR, estimated glomerular filtration rate; HDL, high‑density lipoprotein; HR, heart rate; MI, myocardial infarction; SBP, systolic blood pressure | ||||
Baseline heart rate, bpm | 66.9 (11.6) | 63.6 (11) | <0.001 | |
Age, y | 67.5 (9.4) | 69.7 (9.5) | <0.001 | |
Female sex | 2822 (37.7) | 510 (27.2) | <0.001 | |
Black race | 2482 (33.2) | 465 (24.8) | <0.001 | |
Smoking status | Current smoker | 976 (13) | 264 (14.1) | <0.001 |
Former smoker | 3047 (40.7) | 926 (49.3) | ||
Never smoker | 3440 (46) | 682 (36.3) | ||
BMI, kg/m2 | 30 (5.8) | 29.4 (5.6) | 0.001 | |
Previous CKD | 2002 (26.8) | 644 (34.3) | <0.001 | |
eGFR, ml/min/1.73 m2 | 72.5 (20.6) | 68.8 (20.4) | <0.001 | |
Creatinine, mg/dl | 1.1 (0.3) | 1.1 (0.4) | <0.001 | |
Total cholesterol, mg/dl | 194.5 (39.8) | 172.7 (41.8) | <0.001 | |
HDL cholesterol, mg/dl | 53.5 (14.7) | 50.3 (13.2) | <0.001 | |
Triglycerides, mg/dl | 107 (77–151) | 106 (77–147) | 0.42 | |
Serum glucose, mg/dl | 98.6 (13.4) | 99.5 (14.1) | 0.02 | |
On statin | 2757 (37.2) | 1297 (69.5) | <0.001 | |
On ASA | 3341 (44.8) | 1415 (75.7) | <0.001 | |
Baseline SBP, mm Hg | 140 (15.5) | 138.5 (15.8) | <0.001 | |
Baseline DBP, mm Hg | 78.9 (11.7) | 74.9 (12.3) | <0.001 | |
Mean in‑trial SBP, mm Hg | 129.5 (9.8) | 129.1 (9.9) | 0.11 | |
Mean in‑trial DBP, mm Hg | 72.8 (9.1) | 69.5 (9.4) | <0.001 | |
In‑trial HR, bpm | 68.2 (9.3) | 64.7 (8.9) | <0.001 | |
Allocation to intensive treatment arm | 3738 (49.9) | 940 (50.1) | 0.94 | |
CE | 357 (4.8) | 205 (10.9) | <0.001 | |
MI | 134 (1.8) | 79 (4.2) | <0.001 | |
Acute coronary syndrome other than MI | 37 (0.5) | 43 (2.3) | <0.001 | |
Stroke | 93 (1.2) | 39 (2.1) | 0.008 | |
Heart failure exacerbation | 101 (1.3) | 61 (3.2) | <0.001 | |
Cardiovascular death | 59 (0.8) | 43 (2.3) | <0.001 | |
All‑cause death | 246 (3.3) | 119 (6.3) | <0.001 | |
Clinical characteristics of the study group in relation to baseline heart rate
Most participants with prior CVD had baseline HR of 50 to 60 bpm and 60 to 70 bpm, whereas those without a history of CVD had baseline HR of 60 to 70 bpm and 70 to 80 bpm (Table 2).
Parameter | Baseline HR <50 bpm | Baseline HR 50–60 bpm | Baseline HR 60–70 bpm | Baseline HR 70–80 bpm | Baseline HR ≥80 bpm | P value | |
Data are presented as mean (SD), median (interquartile range), or number (percentage) of patients.
SI conversion factors: see Table 1
Abbreviations: see Table 1 | |||||||
Participants with prior CVD (n = 1877) | |||||||
N | 131 | 617 | 614 | 348 | 167 | – | |
Baseline HR, bpm | 46.1 (2.8) | 55.1 (2.8) | 64.0 (2.8) | 73.8 (2.8) | 86.2 (6.2) | <0.001 | |
Age, y | 70.9 (8.7) | 71.0 (8.8) | 70.4 (9.6) | 67.2 (9.6) | 66.2 (9.8) | <0.001 | |
Female sex | 25 (19.1) | 132 (21.4) | 182 (29.6) | 117 (33.6) | 54 (32.3) | <0.001 | |
Black race | 18 (13.7) | 118 (19.1) | 154 (25.1) | 116 (33.3) | 59 (35.3) | <0.001 | |
Smoking status | Current smoker | 9 (6.9) | 77 (12.5) | 74 (12.1) | 69 (19.8) | 35 (21) | <0.001 |
Former smoker | 76 (58) | 290 (47) | 322 (52.4) | 158 (45.4) | 80 (47.9) | ||
Never smoker | 46 (35.1) | 250 (40.5) | 215 (35) | 120 (34.5) | 51 (30.5) | ||
BMI, kg/m2 | 29.3 (4.6) | 29 (5.1) | 29.7 (5.8) | 29.7 (6.2) | 30.0 (6.2) | 0.02 | |
Previous CKD | 63 (48.1) | 217 (35.2) | 216 (35.2) | 99 (28.4) | 49 (29.3) | 0.001 | |
eGFR, ml/min/1.73 m2 | 64.3 (20) | 67.8 (19.5) | 68.5 (20.6) | 72.4 (21.4) | 69.7 (20.2) | <0.001 | |
Creatinine, mg/dl | 1.19 (0.33) | 1.14 (0.36) | 1.12 (0.36) | 1.08 (0.34) | 1.14 (0.42) | 0.03 | |
Total cholesterol, mg/dl | 163.2 (37.1) | 165.2 (35.6) | 172.3 (42.1) | 183.1 (45.6) | 187.5 (48.7) | <0.001 | |
HDL cholesterol, mg/dl | 48.5 (11.7) | 49.0 (11.8) | 50.3 (13.3) | 53.3 (15) | 50.7 (13.6) | <0.001 | |
Triglycerides, mg/dl | 100 (74.5–137) | 105 (77.2–141) | 104 (77–149) | 105 (74.5–144) | 118 (82–164) | 0.13 | |
Serum glucose, mg/dl | 100.4 (12.1) | 98.7 (12) | 99.5 (13.7) | 100 (18.5) | 100.4 (14) | 0.29 | |
On statin | 100 (76.9) | 462 (75) | 429 (70.4) | 212 (61.1) | 94 (57.7) | <0.001 | |
On ASA | 108 (83.1) | 500 (81.2) | 472 (77.3) | 226 (65.1) | 109 (65.7) | <0.001 | |
Baseline SBP, mm Hg | 140.7 (17.4) | 139.2 (16.2) | 138.5 (15.4) | 137.6 (14.7) | 136.1 (16.4) | 0.004 | |
Baseline DBP, mm Hg | 67.7 (11.7) | 72.2 (11.4) | 75.2 (11.9) | 79 (12.1) | 81.3 (12.1) | <0.001 | |
Mean in‑trial SBP, mm Hg | 129.6 (10.7) | 129.1 (9.7) | 129.2 (10.1) | 129.2 (9.7) | 128.3 (9.8) | 0.42 | |
Mean in‑trial DBP, mm Hg | 64.8 (8.6) | 67.3 (8.7) | 69.4 (9.2) | 73.1 (9.2) | 74.3 (9.3) | <0.001 | |
In‑trial HR, bpm | 54.3 (6.4) | 59.6 (5.6) | 65 (5.7) | 71.4 (6.9) | 77.6 (8.3) | <0.001 | |
Allocation to intensive treatment arm | 65 (49.6) | 315 (51.1) | 324 (52.8) | 156 (44.8) | 80 (47.9) | 0.19 | |
CE | 19 (14.5) | 61 (9.9) | 70 (11.4) | 36 (10.3) | 19 (11.4) | 0.61 | |
MI | 10 (7.6) | 31 (5) | 20 (3.3) | 10 (2.8) | 8 (4.8) | 0.10 | |
Acute coronary syndrome other than MI | 2 (1.5) | 12 (1.9) | 15 (2.4) | 9 (2.6) | 5 (3) | 0.87 | |
Stroke | 4 (3.05) | 9 (1.5) | 18 (2.9) | 5 (1.4) | 3 (1.8) | 0.31 | |
Heart failure exacerbation | 6 (4.6) | 15 (2.4) | 24 (3.9) | 12 (3.4) | 4 (2.4) | 0.50 | |
Cardiovascular death | 2 (1.5) | 11 (1.8) | 15 (2.4) | 10 (2.9) | 5 (3) | 0.73 | |
All‑cause death | 5 (3.8) | 32 (5.2) | 43 (7) | 25 (7.2) | 14 (8.4) | 0.30 | |
Participants without prior CVD (n = 7484) | |||||||
N | 335 | 1736 | 2566 | 1816 | 1031 | – | |
Baseline HR, bpm | 46.3 (2.9) | 55.3 (2.8) | 64.3 (2.8) | 74.0 (2.8) | 87.2 (7.2) | <0.001 | |
Age, y | 70.6 (8.8) | 69.5 (9.1) | 67.7 (9.1) | 66.2 (9.3) | 64.8 (9.6) | <0.001 | |
Female sex | 92 (27.5) | 607 (35) | 953 (37.1) | 748 (41.2) | 422 (40.9) | <0.001 | |
Black race | 84 (25.1) | 489 (28.2) | 797 (31.1) | 669 (36.8) | 443 (43) | <0.001 | |
Smoking status | Current smoker | 19 (5.7) | 125 (7.2) | 268 (10.4) | 301 (16.6) | 263 (25.5) | <0.001 |
Former smoker | 166 (49.6) | 793 (45.7) | 1081 (42.1) | 666 (36.7) | 341 (33.1) | ||
Never smoker | 149 (44.5) | 813 (46.8) | 1209 (47.1) | 843 (46.4) | 426 (41.3) | ||
BMI, kg/m2 | 29.2 (5.2) | 29.5 (5.6) | 29.9 (5.7) | 30.2 (5.9) | 30.65 (6.3) | <0.001 | |
Previous CKD | 107 (31.9) | 531 (30.6) | 695 (27.1) | 413 (22.7) | 256 (24.8) | <0.001 | |
eGFR, ml/min/1.73 m2 | 67.6 (18.4) | 69.9 (19.1) | 72 (20.3) | 75 (21.2) | 75.2 (22.4) | <0.001 | |
Creatinine, mg/dl | 1.13 (0.36) | 1.08 (0.33) | 1.06 (0.33) | 1.03 (0.34) | 1.05 (0.33) | <0.001 | |
Total cholesterol, mg/dl | 186.7 (38.4) | 188.6 (37.2) | 193.7 (39) | 199 (40.4) | 201.2 (43.3) | <0.001 | |
HDL cholesterol, mg/dl | 52.4 (12.5) | 53.7 (14.1) | 53.4 (14.4) | 53.5 (14.7) | 53.9 (17) | 0.35 | |
Triglycerides, mg/dl | 95 (72–133) | 101 (74–139) | 106 (76–148) | 113 (80–161) | 114 (82–164) | <0.001 | |
Serum glucose, mg/dl | 96.7 (9.9) | 97.5 (11.5) | 98.1 (12) | 99.6 (14.5) | 101 (17.5) | <0.001 | |
On statin | 133 (40.1) | 709 (41.2) | 952 (37.5) | 627 (34.7) | 336 (32.9) | <0.001 | |
On ASA | 179 (53.6) | 837 (48.4) | 1217 (47.7) | 722 (39.9) | 386 (37.5) | <0.001 | |
Baseline SBP, mm Hg | 144.4 (16.5) | 140.9 (15.7) | 139.8 (15.3) | 139.1 (14.9) | 138.9 (16.1) | <0.001 | |
Baseline DBP, mm Hg | 73.2 (11.75) | 75.2 (11.2) | 78.6 (11.1) | 81.1 (11.3) | 84.1 (11.8) | <0.001 | |
Mean in‑trial SBP, mm Hg | 131.7 (9.6) | 130.1 (9.8) | 129.2 (9.8) | 129.2 (9.8) | 129.2 (9.9) | 0.0001 | |
Mean in‑trial DBP, mm Hg | 68.7 (9.4) | 70.2 (8.9) | 72.4 (8.7) | 74.4 (8.9) | 76.6 (8.9) | <0.001 | |
In‑trial HR, bpm | 54.9 (5.9) | 60.7 (5.8) | 66.7 (5.8) | 73.1 (6.6) | 79.8 (8.4) | <0.001 | |
Allocation to intensive treatment arm | 158 (47.2) | 854 (49.2) | 1315 (51.2) | 911 (50.2) | 500 (48.5) | 0.40 | |
CE | 14 (4.2) | 92 (5.3) | 105 (4.1) | 87 (4.8) | 59 (5.7) | 0.2 | |
MI | 4 (1.2) | 37 (2.1) | 38 (1.5) | 29 (1.6) | 26 (2.5) | 0.15 | |
Acute coronary syndrome other than MI | 1 (0.3) | 10 (0.6) | 9 (0.4) | 11 (0.6) | 6 (0.6) | 0.70 | |
Stroke | 4 (1.2) | 21 (1.2) | 25 (1) | 29 (1.6) | 14 (1.4) | 0.48 | |
Heart failure exacerbation | 3 (0.9) | 24 (1.4) | 32 (1.2) | 24 (1.3) | 18 (1.7) | 0.74 | |
Cardiovascular death | 4 (1.2) | 11 (0.6) | 17 (0.7) | 19 (1) | 8 (0.8) | 0.51 | |
All‑cause death | 12 (3.6) | 56 (3.2) | 72 (2.8) | 57 (3.1) | 49 (4.8) | 0.06 | |
In the participants with and without a history of CVD, those with the higher baseline HR were younger, less likely men, more often black, more often smokers, had higher body mass index (BMI), higher estimated glomerular filtration rate (eGFR), lower creatinine concentration, and higher total cholesterol concentrations than those with the lower HR. They were also less often on statin or acetylsalicylic acid treatment, had lower baseline SBP and higher baseline DBP. No difference was observed in the in‑trial SBP, although the participants with higher HR had higher in‑trial DBP and HR. No differences were observed in CE or its components or all‑cause death between the groups based on baseline HR.
The relationship between heart rate and cardiovascular event risk
Event rates of CE, MI, and CVD death were evaluated based on the presence of CVD at baseline and baseline HR (Figure 2). In the participants both with and without CVD history, the annual event rate of CE was the highest with HR values ranging from 70 to 80 bpm. Similarly, when HF events and cardiovascular deaths were considered, the highest event rate was observed at HR of 70 to 80 bpm. The highest event rate for MI was observed in the participants with prior CVD and HR below 50 bpm. In the individuals without prior CVD, the event risk rose together with growing HR values. The event rates of acute coronary syndromes other than MI, stroke, HF exacerbation, and total death are presented in Supplementary material, Figure S1.
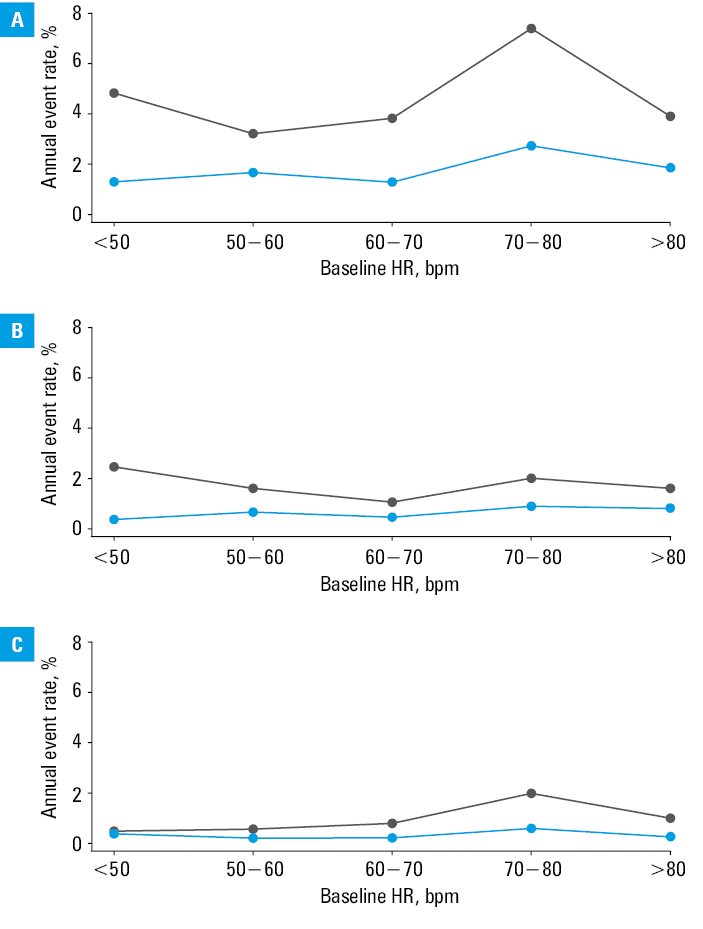
Abbreviations: see Table 1
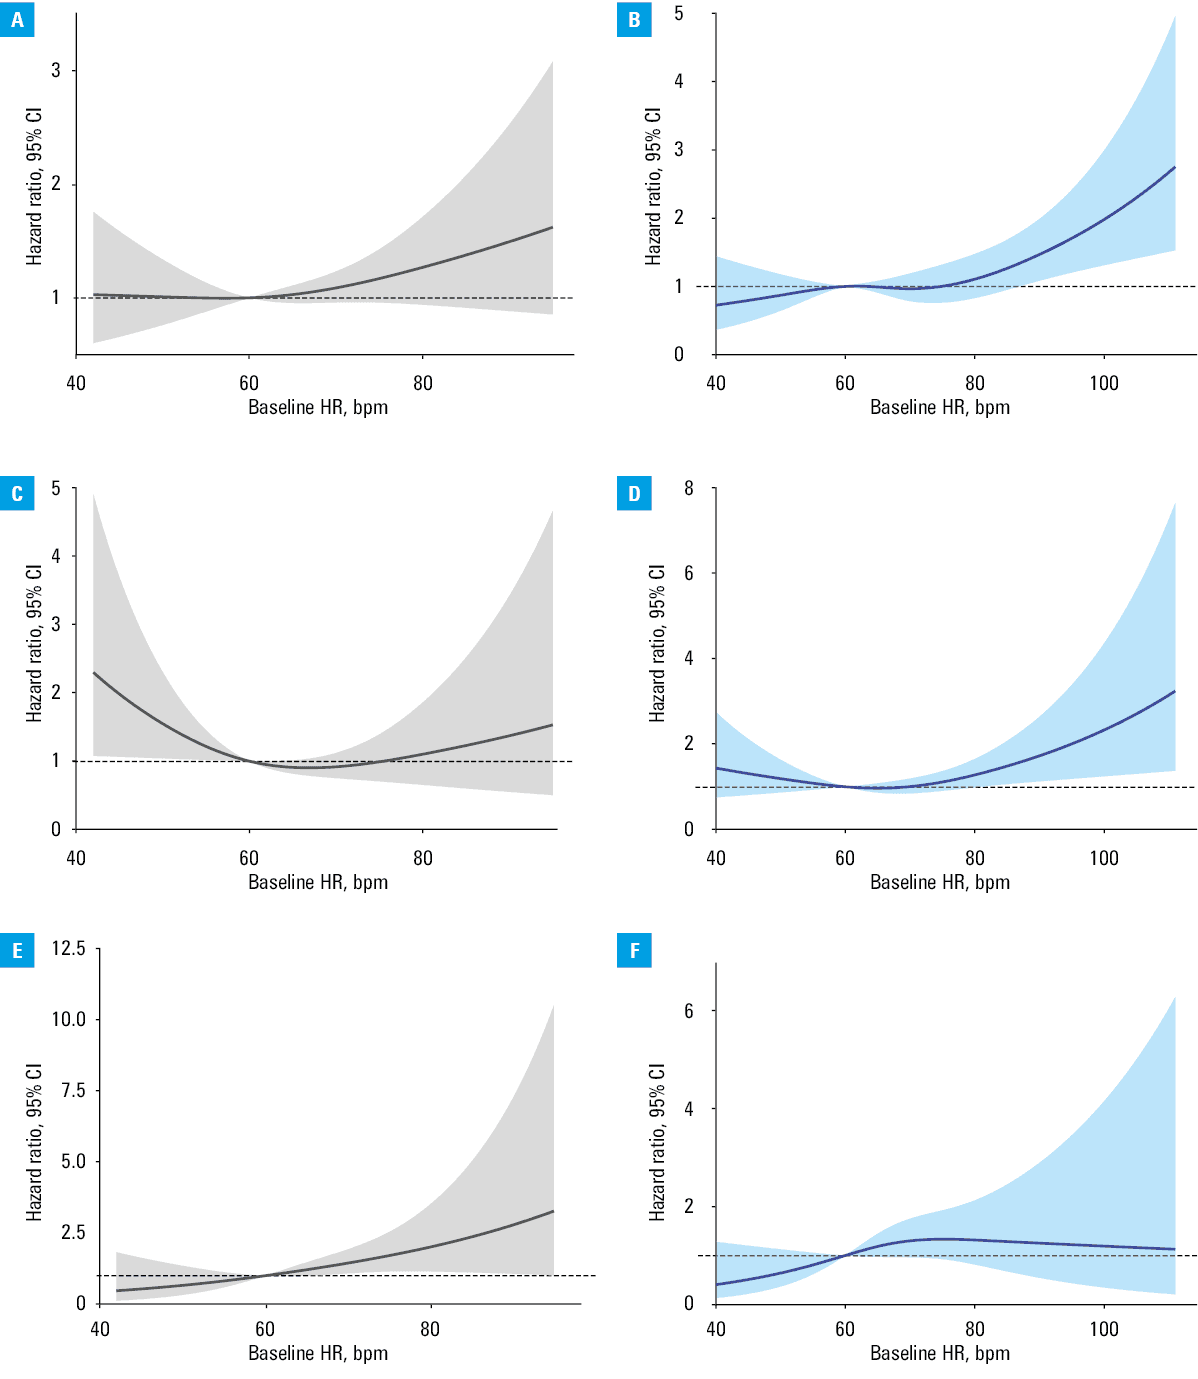
In the Cox proportional hazard model including age, sex, race, baseline SBP, baseline HR, current smoking status, allocation to intensive treatment arm, statin treatment, use of aspirin, total cholesterol, serum glucose concentration and eGFR, the interaction term between HR and CVD history was nonsignificant in relation to the CE risk (P = 0.76), stroke (P = 0.51), HF exacerbation (P = 0.37), cardiovascular death (P = 0.12), and total death (P = 0.20). However, the interaction term was significant when the risk of MI was analyzed (P = 0.049).
Figure 3 presents hazard ratio plots against baseline HR from the models including age, sex, race, baseline SBP, baseline HR, current smoking status, allocation to intensive treatment arm, statin treatment, use of aspirin, total cholesterol, serum glucose concentration, and eGFR to predict CE, MI, and CVD death. Similar plots showing the risk of acute coronary syndromes other than MI, stroke, HF exacerbation, and total death are presented in Supplementary material, Figure S2.
To depict the relationship between baseline HR and CE, MI, and cardiovascular death, 3 additional proportional hazard models were created. We assessed the impact of baseline HR higher than 70 bpm on the risk of CE and cardiovascular death in Model A and Model C, respectively (Table 3). Due to increasing risk of MI at lower baseline HR values, especially pronounced in the participants with prior CVD, Model B included also baseline HR lower than 60 bpm. All the models were adjusted for age, sex, race, renal function, history of CVD, smoking status, baseline SBP, allocation to intensive treatment arm, statin or aspirin treatment, total cholesterol, and serum glucose. In Models A and C, baseline HR above 70 bpm was associated with increased risk of CE or cardiovascular death, as compared with baseline HR up to 70 bpm (hazard ratio, 1.32; 95% CI, 1.1–1.58; P = 0.003 and hazard ratio, 1.9; 95% CI, 1.24–2.9; P = 0.003, respectively). As for the risk of MI, we showed that baseline HR lower than 60 bpm and higher than 70 bpm was associated with increased risk in comparison with HR within the range of 60 to 70 bpm, by 1.41 with 95% CI of 1.01–1.97 (P = 0.045) and by 1.42 with 95% CI of 1–2.02 (P = 0.05), respectively.
Variable | Hazard ratio (95% CI) | P value |
Clinical composite end point was defined as MI, acute coronary syndrome other than MI, heart failure exacerbation, stroke, or cardiovascular death.
a In comparison with never smokers
b In comparison with baseline HR in the range of 60–70 bpm
Abbreviations: see Table 1 | ||
Model A – prediction of CE | ||
Age, y | 1.05 (1.04–1.06) | <0.001 |
Female sex | 0.72 (0.6–0.88) | 0.001 |
Black race | 1.05 (0.86–1.28) | 0.64 |
Baseline SBP, mm Hg | 1.01 (1–1.01) | 0.01 |
Former smokera | 1.2 (1–1.45) | 0.06 |
Current smokera | 2.21 (1.69–2.87) | <0.001 |
Allocation to intensive treatment arm | 0.74 (0.62–0.87) | <0.001 |
On statin | 1.05 (0.87–1.27) | 0.59 |
On aspirin | 1.15 (0.96–1.38) | 0.13 |
Total cholesterol, mg/dl | 1 (1–1.01) | 0.01 |
Glucose, mg/dl | 1 (1–1.01) | 0.28 |
eGFR, ml/min/1.73 m2 | 0.99 (0.99–0.99) | <0.001 |
Baseline HR >70 bpm | 1.32 (1.1–1.58) | 0.003 |
History of CVD | 2.07 (1.71–2.49) | <0.001 |
Model B – prediction of MI | ||
Age, y | 1.04 (1.03–1.06) | <0.001 |
Female sex | 0.63 (0.45–0.87) | 0.005 |
Black race | 0.87 (0.62–1.22) | 0.41 |
Baseline SBP, mm Hg | 1.01 (1–1.02) | 0.04 |
Former smokera | 1.43 (1.04–1.96) | 0.03 |
Current smokera | 3.25 (2.15–4.9) | <0.001 |
Allocation to intensive treatment arm | 0.81 (0.62–1.06) | 0.13 |
On statin | 1.13 (0.83–1.53) | 0.44 |
On aspirin | 1.06 (0.78–1.42) | 0.72 |
Total cholesterol, mg/dl | 1 (1–1.01) | 0.008 |
Glucose, mg/dl | 1 (0.99–1.01) | 0.69 |
eGFR, ml/min/1.73 m2 | 0.99 (0.98–1) | 0.04 |
Baseline HR >70 bpmb | 1.42 (1–2.02) | 0.05 |
Baseline HR <60 bpmb | 1.41 (1.01–1.97) | 0.045 |
History of CVD | 2.03 (1.5–2.76) | <0.001 |
Model C – prediction of cardiovascular death | ||
Age, y | 1.05 (1.02–1.07) | <0.001 |
Female sex | 0.43 (0.26–0.72) | 0.001 |
Black race | 1.56 (0.99–2.47) | 0.06 |
Baseline SBP, mm Hg | 1.02 (1.01–1.03) | 0.004 |
Former smokera | 1.48 (0.94–2.33) | 0.09 |
Current smokera | 2.06 (1.07–3.98) | 0.03 |
Allocation to intensive treatment arm | 0.57 (0.38–0.86) | 0.007 |
On statin | 1.31 (0.84–2.07) | 0.24 |
On aspirin | 0.96 (0.62–1.48) | 0.84 |
Total cholesterol, mg/dl | 1 (1–1.01) | 0.80 |
Glucose, mg/dl | 1.01 (0.99–1.02) | 0.39 |
eGFR, ml/min/1.73 m2 | 0.98 (0.97–0.99) | <0.001 |
Baseline HR >70 bpm | 1.9 (1.24–2.9) | 0.003 |
History of CVD | 2.28 (1.47–3.53) | <0.001 |
Discussion
This is the first study to show that elevated HR assessed using AOBPM is associated with a higher risk of cardiovascular events in participants with and without prior CVD. Additionally, an elevated risk for MI is present especially in the participants with prior CVD and low HR.
The negative impact of increased HR on cardiovascular events confirms previous study results.1-3. However, it is worth paying attention to this risk factor, especially since the topic of HR control in the treatment of arterial hypertension has returned in recent years. For example, in a recent trial of 3463 patients in China, observed for 2.3 years, increased HR was found to be an independent risk factor for peripheral artery disease development.13 In another recent study,14 it was concluded that elevated HR (measured using ECG) is associated with incident HF in people with hypertension but without prior CVD (eg, HF, MI, stroke). The authors showed that HR higher than 79 bpm is associated with a higher risk of HF, but it should be noticed that even lower HR (74–79 bpm) was associated with an elevated risk for HF (by 1.65 with 95% CI of 1.07–2.55) after adjustment for age, sex, SBP, high‑density lipoprotein cholesterol, low‑density lipoprotein cholesterol, smoking status, alcohol consumption, physical exercise, presence of diabetes, use of antihypertensive agents, BMI, and eGFR. Contrary to these results, we were only able to observe an increase in HF decompensation events in the individuals with prior cardiovascular disease (Supplementary material, Figure S2). Moreover, in a recently published study from Tunisia,15 HR above 80 bpm was identified as an independent predictor of poor blood pressure control increasing the risk of cardiovascular events by 1.59 (95% CI, 1.48–1.71).The method of HR measurement was not described in the study, however, the authors did not use AOBPM to assess HR.
The effect of HR in the context of lower blood pressure target has not been explored in the randomized clinical trial design. In our previous analysis,16 also based on the SPRINT study, we showed that despite good BP control, HR among the participants treated to reach an SBP goal below 120 mm Hg remained a significant risk factor. In addition, in this subgroup, more potent relationship between the increased HR and cardiovascular events was observed than in the group with less controlled blood pressure.16 With reference to this conclusion, our finding presented here, that the risk increases even from HR of 70 bpm (not from 80 bpm, as indicated by the European Society of Cardiology [ESC] recommendations), is of particular importance to the physicians. This conclusion remains in line with the results of a meta‑analysis of 45 nonrandomized prospective cohort studies by Zhang et al.17 The authors showed that HR higher than 70 bpm is associated with unfavorable outcome regarding both cardiovascular and noncardiovascular events.
In a recent review describing the impact of elevated HR on cardiovascular risk in hypertensive participants, apart from genetic factors leading to elevated HR and BP, the authors underlined specific roles of sympathetic nervous system activity.18 HR is known to be strongly influenced by the balance between the sympathetic and parasympathetic nervous system activity. In the participants with elevated HR, higher norepinephrine concentration and increased muscle sympathetic nerve activity were found.19,20 The sympathetic overactivity is also a known risk factor for adverse cardiovascular effects, including white‑coat hypertension, masked hypertension, progression of hypertension‑mediated end‑organ damage, and other hypertension‑related conditions.18,21
We would like to emphasize that proving an association between HR measured using AOBPM and cardiovascular risk might be of special significance, because HR is lower during an unattended AOBPM due to decreased sympathetic activity.22 It may also indicate that the HR assessment using AOBPM is a more sensitive tool for predicting cardiovascular complications than HR obtained by the conventional method.
In the ESC recommendations, HR above 80 bpm is considered a cardiovascular risk modifier. In our study, an increase in cardiovascular risk was observed at lower HR values. Similar observations were found when considering the effect of HR assessed by HBPM or ABPM on cardiovascular events.8,23 This finding can also be explained by the fact that during unattended AOBPM sympathetic activity is lower than during OBPM.
Regarding the balance between the sympathetic and parasympathetic systems, sympathetic activation is decreased during night rest. Our results are of interest in the context of other studies showing that nocturnal nondipping of HR is an independent predictor of cardiovascular events.24
To the best of our knowledge, only 1 study has presented the impact of AOBPM HR on the occurrence of cardiovascular events. Wang et al25 showed that in Chinese octogenarians elevated AOBM HR is associated with all‑cause and cardiovascular mortalities. However, the trial also showed that low HR values were associated with increased risk for all‑cause and cardiovascular mortalities. The lowest risk of these end points was observed when HR remained in the range of 77 to 85 bpm.
In our trial, the risk of MI rose in the participants with low HR but only in the group with prior CVD. As proposed by Boudoulas et al,26 this phenomenon may be explained by increased central aortic pressure. In the participants with prior CVD, arterial stiffness is more pronounced and results in higher pulse wave velocity. Similarly, the pulse wave velocity reflected from the peripheral arterial circulation to the root of the aorta is higher than in the participants without CVD. Consequently, when HR is slow, the diastolic period is prolonged much more than the systolic period as compared with normal HR. Both these situations, that is, the higher velocity of reflected pulse wave and elongation of the diastolic period in comparison with the systolic period, result in the arrival of the reflected pulse wave at the root of the aorta in the systole instead of the diastole. Under such circumstances, the central aortic BP is elevated and coronary blood flow is reduced. Hence, diminished coronary blood flow may result in myocardial ischemia and infarction, especially in the participants with prior CVD diagnoses. Recently, Mthembu et al27 found that the age of participants without CVD was the most important factor influencing the effects of low HR on the reflected pulse wave velocity and central BP. In our analysis, the participants without CVD were older than those with the CVD history; however, we speculate that the CVD diagnosis may have a similar or stronger effect on the reflected pulse wave velocity than age. Fortunately, increased MI risk was observed in the participants at a very low HR, rarely seen in clinical practice.
In the patients with stable coronary disease it is recommended to maintain resting HR in the range of 55 to 60 bpm.28 These suggestion is based on the results of 2 studies. In the first study,29 data of the patients with HR below 62 bpm were used as a reference. The multivariable Cox model showed only that the risk for total mortality or cardiovascular mortality was increased when HR ranged from 71 to 76 bpm or above, in comparison with HR below 62 bpm.29 The second study30also failed to show any difference in the risk of nonsudden death from MI between the participants with HR below 60 bpm and HR in the range of 60 to 64 bpm. In fact, none of these studies investigated if (or how) low HR may be harmful. Taking into account our results, we are convinced that the lack of differences in survival may be due to increased risk of MI at lower HR values. Moreover, several studies in patients with coronary artery disease demonstrated an increased risk of unfavorable cardiovascular events when HR was low. In the post hoc analysis of the INVEST (International Verapamil‑SR/trandolapril Study), the authors showed a J‑shaped relationship between HR and the risk of composite adverse events (death, nonfatal MI, or nonfatal stroke) in patients with prior MI.31 Similarly, the data from PROVE‑IT TIMI 22 trial32 indicated that both low and high HR was associated with an increased risk of composite clinical end point defined as death from any cause, MI, unstable angina requiring rehospitalization, revascularization after 30 days, or stroke. The analysis showed nadir at 68 bpm.
Several limitations of our analysis should be pointed out. The main limitation is its post hoc design. Furthermore, premature ending of the SPRINT could influence the results of this analysis. Second, HR measurements may be affected by the fact that only approximately 50% of AOBPM were taken as unattended.33 However, the effects of the presence of an observer on HR assessed by AOBPM are unknown. We should also underline that not only HR, but also SBP and DBP values are assessed using AOBPM, and may be slightly different than the values obtained with other methods of BP estimation according to the results of other trials.34 Our analysis did not include the effects of rate‑control drug prescription. Such an analysis was not performed, because some participants could receive such a treatment temporarily as antihypertensive therapy (eg, β-blockers).35 We also did not evaluate the influence of potential arrhythmia, for example, atrial fibrillation.
Conclusions
HR estimated during AOBPM may be used to predict the cardiovascular risk. Although we have shown that the increase of cardiovascular events risk is observed at lower HR values than currently suggested, further studies are needed. Recently, it has been shown that lower HR and decreased SBP are related to better outcome in the patients with hypertension, however, there is not enough evidence supporting intentional lowering of HR in such individuals.16 Especially the method of HR lowering remains of considerable interest. Target HR remains unknown in light of the fact that in participants with prior CVD, low HR may be also recognized as a risk factor for MI. It should be underlined that AOBPM is a new method, the use of which gains more and more attention. The results obtained with AOBPM are less prone to bias related to the presence of a physician, and are thus more reliable. Additionally, HR obtained using AOBPM may effectively stratify the cardiovascular risk, as reflected by the study results. This may affect common clinical practice. However, its influence on current recommendations on target HR warrants further investigations.
- Gillum RF, Makuc DM, Feldman JJ. Pulse rate, coronary heart disease, and death: the NHANES I Epidemiologic Follow‑up Study. Am Heart J. 1991; 121: 172‑177. | Crossref
- Dyer AR, Persky V, Stamler J, et al. Heart rate as a prognostic factor for coronary heart disease and mortality: findings in three Chicago epidemiologic studies. Am J Epidemiol. 1980; 112: 736‑749. | Crossref
- Böhm M, Swedberg K, Komajda M, et al. Heart rate as a risk factor in chronic heart failure (SHIFT): the association between heart rate and outcomes in a randomised placebo‑controlled trial. Lancet. 2010; 376: 886‑894. | Crossref
- Okin PM, Kjeldsen SE, Julius S, et al. All‑cause and cardiovascular mortality in relation to changing heart rate during treatment of hypertensive patients with electrocardiographic left ventricular hypertrophy. Eur Heart J. 2010; 31: 2271‑2279. | Crossref
- Julius S, Palatini P, Kjeldsen SE, et al. Usefulness of heart rate to predict cardiac events in treated patients with high‑risk systemic hypertension. Am J Cardiol. 2012; 109: 685‑692. | Crossref
SUPPLEMENTARY MATERIAL
ARTICLE INFORMATION