Differences between the course of SARS-CoV-2 infections in the periods of the Delta and Omicron variant dominance in Poland
Key words: COVID-19, cytokine storm, Delta, Omicron


 CC BY-NC-SA 4.0
Differences between the course of SARS-CoV-2 infections in the periods of the Delta and Omicron variant dominance in Poland
Introduction: Up to now, COVID‑19 caused more than 6 million deaths worldwide. So far, 5 variants of concerns have been identified, with Delta and Omicron being the subject of our analysis.
Objectives: We aimed to compare baseline characteristics and outcomes of patients hospitalized during the Delta and Omicron predominance in Poland.
Patients and methods: The study population consisted of 2225 patients divided into 2 groups depending on the variant with which they were infected during the corresponding period of the pandemic.
Results: During the Delta wave, the median age of patients was significantly lower (65 vs 73 years; P <0.001), and the cohort was significantly less burdened with comorbidities than during the Omicron surge. The Omicron‑infected patients presented significantly less often in an unstable symptomatic state with SpO2 equal to or below 90% on admission (49.9% for Delta vs 29.9% for Omicron; P <0.001). Regardless of the pandemic period, the 2 most common early symptoms of COVID‑19 were fever and cough. In‑hospital treatment consisted of antiviral drugs, more frequently used in the Omicron wave, and immunomodulatory drugs, more frequently used during the Delta wave. The risk of mechanical ventilation was significantly lower in the patients infected with the Omicron variant (7.2% for Delta vs 3.1% for Omicron; P <0.001). For the age group above 80 years old, the risk of death was significantly higher during the Delta wave than during the Omicron wave. The risk of death was significantly lower in the patients treated with antiviral drugs regardless of the pandemic wave.
Conclusions: The Delta variant is associated with a more severe clinical course of the disease and a higher risk of death than the Omicron variant.
What's new?
In our study, we documented, based on objective indicators, a milder course of COVID‑19 in patients hospitalized in the first half of 2022 during the dominance of the Omicron variant of SARS‑CoV‑2, as compared with the second half of 2021 dominated by the Delta variant. Additionally, during the Omicron wave greater use of antiviral drugs and lower use of immunomodulators was observed.
Introduction
COVID‑19 is a global public health problem caused by severe acute respiratory syndrome coronavirus 2 (SARS‑CoV‑2). The virus was identified in December 2019 in Wuhan, China. Due to its quick and uncontrolled spread across the world, COVID‑19 was declared a pandemic in March 2020 by the World Health Organization (WHO).1 Globally, by the end of July 2022, more than 580 million confirmed cases had been documented, of which more than 40% had been diagnosed in Europe, and more than 6 million people had died worldwide due to COVID‑19.2 In about 80% of cases, the overall clinical course of SARS‑CoV‑2 infection is asymptomatic or mild. However, the virus can lead to severe progressive pneumonia with respiratory failure and multiple organ dysfunction. The overall mortality rate is around 2%, although some populations have been shown to have a higher risk of severe COVID‑19.3-5
Predictors of worse clinical presentation are associated with older age, male sex, obesity, chronic cardiovascular, respiratory, or renal diseases, cancer, and immunosuppression.6,7 The clinical course of SARS‑CoV‑2 infection and outcomes of COVID‑19 are also affected by the evolution of the virus and the emergence of new variants.8-10 In order to monitor and evaluate this evolution, WHO signals 2 main groups: variants of interest (VOIs) and variants of concern (VOCs). To date, 5 variants of concern have been identified, Alpha, Beta, Gamma, Delta, and Omicron.
The Delta variant (B.1.617.2 lineage) was first detected in India in October 2020.11 Compared with the originally identified COVID‑19 strain, there were 27 mutations, and 9 of them involved the spike protein.12 Patients infected with this variant have been shown to have a higher risk of being admitted to the hospital or presenting to the emergency room than those infected with the Alpha variant, which was the most dominant strain on the globe until May 2021.13,14 Due to the rapid increase in infections with the Delta variant worldwide, the WHO designated it a VOC on May 11, 2021.15 However, a new variant called Omicron (B.1.1.529 lineage) was identified as early as in November 2021 and became a VOC shortly thereafter, turning into the dominant variant worldwide in December 2021.15,16 Numerous mutations in the spike gene have led to the Omicron variant being more transmissible than the previous variants, including the Delta one.16,17 Several Omicron subvariants soon appeared, such as 21K (BA.1) and 21L (BA.2), now displaced by subvariants 22A (BA.4) and 22B (BA.5), which are even more transmissible.18 Vaccination against SARS‑CoV‑2 showed reduced efficacy against the Omicron strain, as did some of the drugs used in COVID‑19 therapy, while others maintained their activity.19-22 The aim of the current analysis was to compare the epidemiological characteristics, symptomatology, laboratory parameters, overall clinical course, and outcome of the disease in patients hospitalized for COVID‑19 during the periods of predominance of the Delta and Omicron variants.
Patients and methods
We conducted a retrospective analysis using data from the nationwide SARSTer database, which is an ongoing observational register maintained by the Polish Association of Epidemiologists and Infectiologists. The project involves 44 Polish centers and aims to collect information on patients hospitalized for COVID‑19 since the beginning of the pandemic. We analyzed the data of 2225 adult patients who were hospitalized during 2 pandemic periods (from August 1 to December 31, 2021 and from January 1 to April 30, 2022), corresponding to the dominance of the Delta and Omicron variants, respectively. The patient consent was waived due to the retrospective design of the study.
According to the Global Initiative on Sharing All Influenza Data, the dominance of the Omicron SARS‑CoV‑2 variant in Poland began in early January 2022.23 The diagnosis of infection was based on a positive polymerase chain reaction or antigen test result; management and treatment followed current national recommendations for COVID‑19.24,25
The objective of the study was to compare the clinical characteristics of patients hospitalized during the dominance of the Delta or Omicron variants of SARS‑CoV‑2, such as sex, age, body mass index (BMI), and comorbidities. Vaccination status and history of previous SARS‑CoV‑2 infections were not analyzed. Based on the presence of symptoms and SpO2 when breathing room air at hospital admission, 4 categories of baseline clinical status were distinguished: 1) asymptomatic, 2) stable symptomatic with SpO2 above 95%, 3) unstable symptomatic with SpO2 between 91% and 95%, 4) unstable symptomatic with SpO2 equal to or below 90%, and acute respiratory distress syndrome. The clinical course of the disease was assessed upon admission to the hospital, and then after 7, 14, 21, and 28 days of hospitalization using an ordinal scale based on the WHO recommendation, which was modified to an 8‑score version to better suit the Polish health care system. The scores were defined as follows: 1) not hospitalized, no activity restrictions; 2) not hospitalized, no activity restrictions and / or required oxygen supplementation at home; 3) hospitalized, did not require oxygen supplementation and did not require medical care; 4) hospitalized, required no oxygen supplementation but required medical care; 5) hospitalized, required normal oxygen supplementation; 6) hospitalized, on noninvasive ventilation with high‑flow oxygen equipment; 7) hospitalized, on invasive mechanical ventilation or extracorporeal membrane oxygenation; 8) death.
Improvement of the patient’s condition throughout the course of the disease was defined as a reduction in the score by at least 2 points.
A comparative analysis was also made of the early symptoms of COVID‑19, with which the patients presented at the time of admission to the hospital, and the results of baseline laboratory tests, including parameters such as the concentration of C‑reactive protein (CRP), interleukin‑6 (IL‑6), procalcitonin (PCT), D‑dimer, alanine aminotransferase (ALT) activity, white blood cell (WBC) count, absolute lymphocyte, neutrophil, and platelet count.
End points, such as the need for oxygen therapy, the need for mechanical ventilation, and 28‑day mortality were compared between the 2 populations, with additional subdivision based on the use of antiviral therapy, and the age of the patients.
Statistical analysis
All statistical analyses were performed using Statistica v. 13 (StatSoft, Tulsa, Oklahoma, United States). Continuous data (age, BMI, time of oxygenation, and laboratory markers) were summarized by median, interquartile range (IQR), and minimum and maximum values for some variables. Group comparisons were performed using the nonparametric Mann–Whitney test, and as the data did not meet the Gaussian distribution, they were checked with the Shapiro–Wilk test. In the multiple comparison of baseline clinical status on hospital admission, the Bonferroni correction was applied. Frequencies and percentages described categorical data. Differences between the groups were assessed with the Pearson χ2 test. A P value below 0.05 was considered significant.
Results
Demographic characteristics of patients
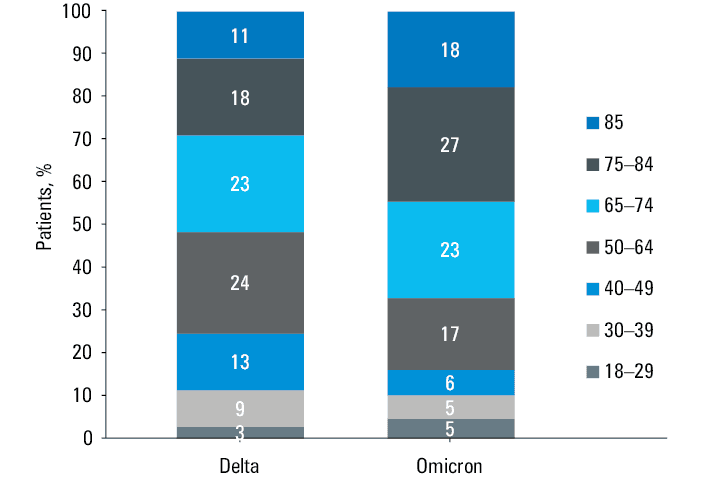
During the Delta wave of the pandemic, 1440 COVID‑19 patients were hospitalized with a slight predominance of men (52.3%), while in the Omicron surge the number was 785, and a slight predominance of women (51.8%) was observed (Table 1). Median age of the patients was lower during the Delta wave (65 vs 73 years; P <0.001), with women being older than men in both analyzed periods (Table 1). During the Delta predominance period, 52% of the hospitalized patients were 65 years and older, as compared with 68% during the Omicron wave (Figure 1). Majority of the hospitalized patients, regardless of the pandemic wave, had comorbidities, but a higher prevalence of coexisting diseases was demonstrated during the Omicron wave (93.6% vs 75.8%; P <0.001).
Parameter | Delta: all (n = 1440) | Omicron: all (n = 785) | P value | Delta: women (n = 687) | Omicron: women (n = 407) | P value | Delta: men (n = 753) | Omicron: men (n = 378) | P value |
Abbreviations: ARDS, acute respiratory distress syndrome; BMI, body mass index; COPD, chronic obstructive pulmonary disease; CVD, cardiovascular disease; IQR, interquartile range; MI, myocardial infarction; SpO2, oxygen saturation | |||||||||
Women / men, n (%) | 687 (47.7) / 753 (52.3) | 407 (51.8) / 378 (48.2) | 0.06 | – | – | – | – | – | – |
Age, y, median (IQR; min–max) | 65 (50–76; 18–99) | 73 (60–83; 18–98) | <0.001 | 68 (56–81; 19–99) | 75 (62–83; 19–97) | <0.001 | 62 (47–73; 18–98) | 71 (58–81; 18–98) | <0.001 |
BMI, kg/m2, median (IQR; min–max) | 26.77 (22.68–30.48; 14.2–62.5) | 25.39 (21.47–29.73; 13.8–49.6) | <0.001 | 26.77 (22.04–30.82; 15.2–62.5) | 25.24 (20.74–30.43; 14.9–44.1) | 0.01 | 26.75 (23.29–30.3; 14.2–55.8) | 25.71 (22.11–29.32; 13.8–49.6) | <0.001 |
Obesity (BMI ≥30 kg/m2), n (%) | 404 (32.9) | 190 (27.8) | 0.02 | 202 (34.1) | 110 (31.5) | 0.41 | 202 (31.7) | 80 (24) | 0.01 |
Comorbidities, n (%) | |||||||||
Any comorbidity | 1091 (75.8) | 735 (93.6) | <0.001 | 561 (81.7) | 381 (93.6) | <0.001 | 530 (70.4) | 354 (93.7) | <0.001 |
Hypertension | 726 (50.4) | 452 (57.6) | 0.001 | 384 (55.9) | 249 (61.2) | 0.09 | 342 (45.4) | 203 (53.7) | 0.01 |
Diabetes | 292 (20.3) | 199 (25.4) | 0.01 | 147 (21.4) | 103 (25.3) | 0.14 | 145 (19.3) | 96 (25.4) | 0.02 |
Stroke | 61 (4.2) | 82 (10.4) | <0.001 | 29 (4.2) | 33 (8.1) | 0.01 | 32 (4.2) | 13 (49) | <0.001 |
COPD | 61 (4.2) | 55 (7) | 0.01 | 31 (4.5) | 19 (4.7) | 0.90 | 30 (4) | 36 (9.5) | <0.001 |
MI | 51 (3.5) | 63 (8) | <0.001 | 25 (3.6) | 19 (4.7) | 0.40 | 26 (3.5) | 44 (11.6) | <0.001 |
Neoplastic diseases | 85 (5.9) | 116 (14.8) | <0.001 | 43 (6.3) | 60 (14.7) | <0.001 | 42 (5.6) | 56 (14.8) | <0.001 |
Ischemic heart disease | 148 (10.3) | 165 (21) | <0.001 | 79 (11.5) | 81 (19.9) | <0.001 | 69 (9.2) | 84 (22.2) | <0.001 |
Other CVDs | 273 (19) | 249 (31.7) | <0.001 | 157 (22.9) | 135 (33.2) | <0.001 | 116 (15.4) | 114 (30.2) | <0.001 |
Other respiratory diseases | 104 (7.2) | 85 (10.8) | 0.004 | 53 (7.7) | 46 (11.3) | 0.04 | 51 (6.8) | 39 (10.3) | 0.04 |
Other metabolic diseases | 150 (10.4) | 119 (15.2) | 0.001 | 77 (11.2) | 54 (13.3) | 0.31 | 73 (9.7) | 65 (17.2) | <0.001 |
Other diseases | 664 (46.1) | 563 (71.7) | <0.001 | 360 (52.4) | 293 (72) | <0.001 | 304 (40.4) | 270 (71.4) | <0.001 |
Baseline clinical status on hospital admission, n (%) | |||||||||
Asymptomatic | 29 (2) | 46 (5.9) | <0.001 | 18 (2.6) | 18 (4.4) | 0.02 | 11 (1.5) | 28 (7.4) | <0.001 |
Stable symptomatic, SpO2 >95% | 191 (13.3) | 246 (31.3) | <0.001 | 97 (14.1) | 129 (31.7) | <0.001 | 94 (12.5) | 117 (31) | <0.001 |
Unstable symptomatic, SpO2 at 91%–95% | 462 (32.1) | 250 (31.8) | 0.18 | 224 (32.6) | 129 (31.7) | 0.15 | 238 (31.6) | 121 (32) | 0.18 |
Unstable symptomatic, SpO2 ≤90% | 719 (49.9) | 235 (29.9) | <0.001 | 331 (48.2) | 130 (31.9) | <0.001 | 388 (51.5) | 105 (27.8) | <0.001 |
ARDS | 39 (2.7) | 8 (1) | 0.02 | 17 (2.5) | 1 (0.3) | 0.01 | 22 (2.9) | 7 (1.8) | 0.06 |
SpO2 at baseline, %, median (IQR) | 90 (86–93) | 94 (90–96) | <0.001 | 90 (87–94) | 93 (89–96) | <0.001 | 90 (86–93) | 94 (90–96) | <0.001 |
Baseline clinical status and laboratory parameters
During the Omicron period, the patients were more likely to be asymptomatic or in a symptomatic stable condition with SpO2 above 95% on admission, as compared with those hospitalized in the Delta predominance period. The percentage of patients admitted to the hospital with baseline SpO2 equal to or below 90% was higher during the Delta than the Omicron wave (49.9% vs 29.9%; P <0.001). More than 50% of the patients hospitalized during the Delta wave were 65 years old and older, while in the subsequent pandemic period, the patients of that age made up almost 70% of the cohort. The largest percentage difference between the 2 pandemic waves analyzed can be seen in 2 age groups, that is, those aged 75–84 years and those aged 85 years and over, representing 18% vs 27% and 11% vs 18% of the cohort, respectively (Figure 1).
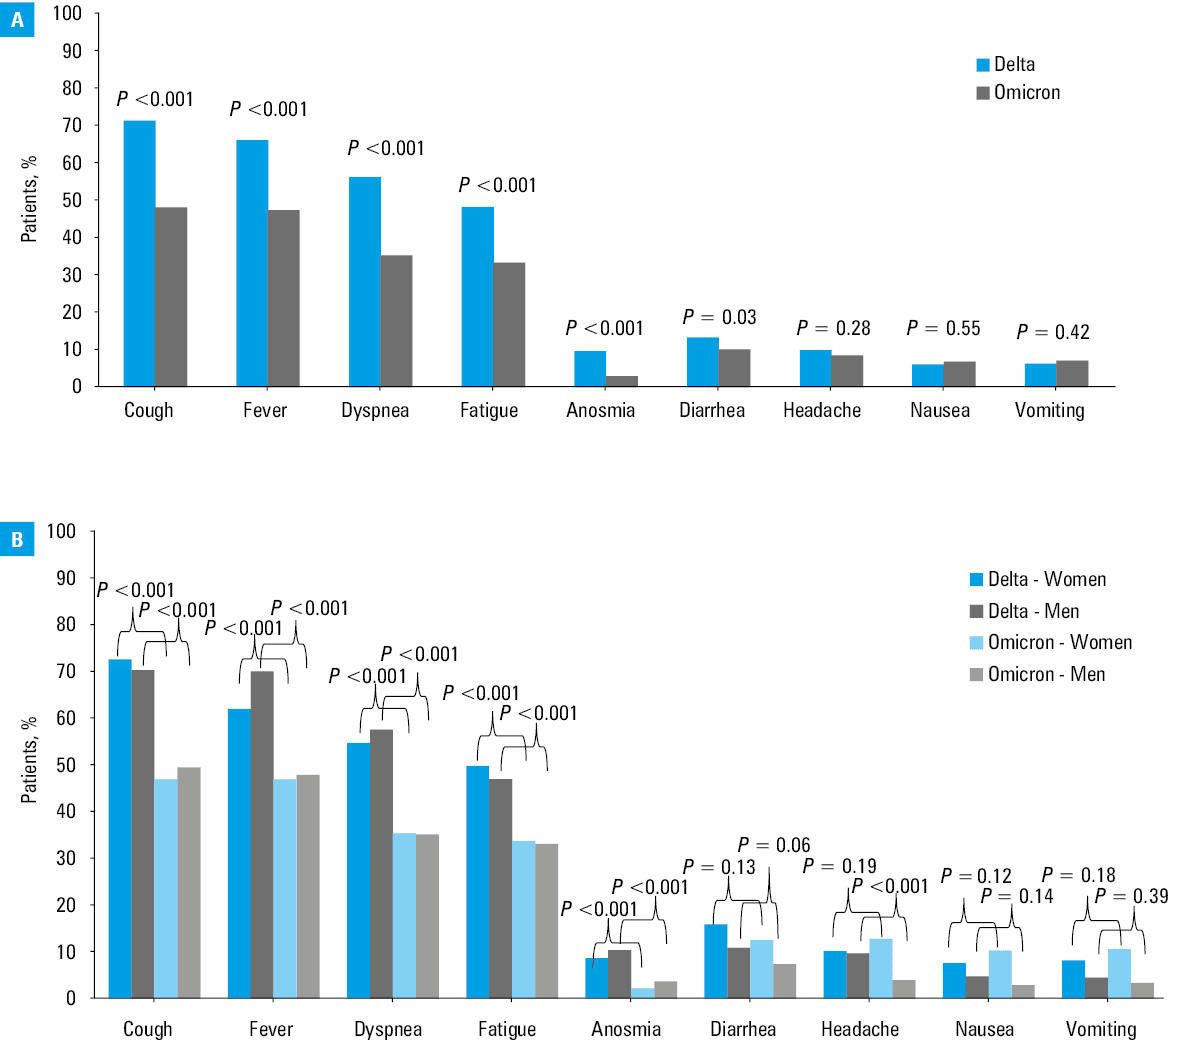
Regardless of the pandemic period, the most common early symptoms of COVID‑19 with which the patients presented to the hospital were fever, cough, shortness of breath, and fatigue (Figure 2A). In comparison with the Delta wave, the patients hospitalized during the Omicron surge had a significantly lower prevalence of cough (48.2% vs 71.4%), fever (47.4% vs 66.2%), shortness of breath (35.3% vs 56.3%), fatigue (33.4% vs 48.3%), and anosmia (2.9% vs 9.6%) (Figure 2B).
Among baseline laboratory parameters, significantly higher median WBC counts and lymphocyte counts were recorded in the patients hospitalized during the Omicron wave, while higher median IL‑6 levels, CRP levels, and ALT activity were documented in the Delta period. Differences between laboratory parameters in the 2 pandemic waves analyzed by sex are shown in Table 2.
Parameter | Delta | Omicron | P valuea |
Data are presented as median (interquartile range) and the number of patients.
SI conversion factors: to convert ALT and AST to μkat/l, multiply by 0.0167; D‑dimer to mmol/l, by 5.476.
a Differences were evaluated with the Mann–Whitney test.
Abbreviations: ALT, alanine aminotransferase; CRP, C‑reactive protein; IL‑6, interleukin‑6; PCT, procalcitonin; WBC, white blood cell | |||
All patients | |||
CRP, mg/l | 64.2 (26.4–121.3); n = 1432 | 36 (11–87); n = 781 | <0.001 |
PCT, ng/ml | 0.1 (0.1–0.2); n = 1183 | 0.1 (0.1–0.3); n = 715 | 0.32 |
WBC, × 103/µl | 6 (4.4–8.2); n = 1435 | 6.3 (4.7–8.9); n = 783 | 0.001 |
Lymphocytes, × 103/µl | 0.9 (0.7–1.2); n = 1403 | 1 (0.7–1.5); n = 761 | <0.001 |
Neutrophils, × 103/µl | 4.4 (2.9–6.4); n = 1404 | 4.4 (2.9–6.8); n = 761 | 0.41 |
Platelets, × 103/µl | 185 (141–246); n = 1435 | 199 (145–244); n = 783 | 0.08 |
IL‑6, pg/ml | 46.4 (19.1–94.2); n = 1065 | 27.2 (8.8–74.7); n = 659 | <0.001 |
D‑dimer, ng/ml | 950 (572–1623.5); n = 1412 | 960 (540–1976); n = 779 | 0.53 |
ALT, IU/l | 32 (21–52); n = 1395 | 25 (17–41); n = 782 | <0.001 |
Women | |||
CRP, mg/l | 53.3 (19.2–106.5); n = 682 | 25.6 (8–73.7); n = 405 | <0.001 |
PCT, ng/ml | 0.1 (0.1–0.2); n = 553 | 0.1 (0.1–0.2); n = 369 | 0.37 |
WBC, × 103/µl | 5.7 (4.1–7.6); n = 684 | 6.2 (4.6–8.7); n = 405 | <0.001 |
Lymphocytes, × 103/µl | 0.9 (0.7–1.2); n = 667 | 1.1 (0.7–1.5); n = 394 | <0.001 |
Neutrophils, × 103/µl | 4.1 (2.7–6); n = 667 | 4.3 (2.8–6.3); n = 394 | 0.16 |
Platelets, × 103/µl | 190 (146–242); n = 684 | 209 (161–258); n = 405 | 0.002 |
IL‑6, pg/ml | 37.1 (17–76.2); n = 494 | 20 (6.9–57.6); n = 347 | <0.001 |
D‑dimer, ng/ml | 961 (582–1644); n = 671 | 991.5 (555.7–1889); n = 406 | 0.62 |
ALT, IU/l | 28 (19–43); n = 664 | 22 (15–37); n = 405 | <0.001 |
Men | |||
CRP, mg/l | 72.3 (35–133.9); n = 750 | 46.7 (16–107.3); n = 376 | <0.001 |
PCT, ng/ml | 0.1 (0.1–0.3); n = 630 | 0.1 (0.1–0.3); n = 346 | 0.42 |
WBC, × 103/µl | 6.3 (4.6–8.7); n = 751 | 6.7 (4.9–9.2); n = 378 | 0.05 |
Lymphocytes, × 103/µl | 0.9 (0.6–1.2); n = 736 | 1 (0.7–1.5); n = 367 | 0.01 |
Neutrophils, × 103/µl | 4.6 (3.2–6.8); n = 737 | 4.6 (3.1–6.9); n = 367 | 0.99 |
Platelets, × 103/µl | 179 (137–247); n = 751 | 181.5 (136–231); n = 378 | 0.48 |
IL‑6, pg/ml | 54.3 (22.2–105); n = 571 | 34.4 (11.8–90.1); n = 312 | <0.001 |
D‑dimer, ng/ml | 930 (566–1596); n = 741 | 940 (530–2010); n = 373 | 0.72 |
ALT, IU/l | 36 (24–61); n = 731 | 28 (19–44); n = 377 | <0.001 |
In‑hospital treatment
As shown in Table 3, antivirals were used significantly more often in the patients hospitalized during the Omicron than during the Delta wave (51.7% vs 32.4%; P <0.001). Treatment with immunomodulatory drugs, baricitinib (BNB), tocilizumab (TCZ), and dexamethasone (DEX), administered during the cytokine storm phase, was more common in the patients hospitalized during the Delta than the Omicron wave (65% vs 35.2%; P <0.001). Antibiotics for the treatment of bacterial superinfection were more often used during the Omicron wave than in the patients hospitalized during the Delta wave (44.8% vs 37.5%; P <0.001). For all drugs analyzed, the time from symptom onset to treatment initiation was significantly longer during the Delta predominance than during the Omicron surge.
Parameter | Delta (n = 1440) | Omicron (n = 785) | P value | |
Data are presented as median (interquartile range) and the number of patients unless indicated otherwise.
a Two antiviral drugs were used simultaneously in 6 patients (2 with cancer, 2 on immunosuppressive therapy after kidney transplantation, 1 with acute leukemia, 1 with hypertension, chronic obstructive pulmonary disease, diabetes, and obesity)
b 11 patients with 3‑day course, 452 patients with 5‑day course, 2 patients with no data
c 40 patients with 3‑day course, 180 patients with 5‑day course, 1 patient with no data | ||||
Antivirals, n (%) | 467 (32.4) | 406 (51.7)a | <0.001 | |
Remdesivir, n (%) | 465 (32.3)b | 221 (28.2)c | 0.04 | |
Molnupiravir, n (%) | 2 (0.1) | 191 (24.3) | <0.001 | |
Immunomodulators, n (%) | 936 (65) | 276 (35.2) | <0.001 | |
Tocilizumab, n (%) | 233 (16.2) | 70 (8.9) | <0.001 | |
Dexamethasone, n (%) | 881 (61.2) | 253 (32.2) | <0.001 | |
Baricitinib, n (%) | 98 (6.8) | 26 (3.3) | 0.001 | |
Antibiotics, n (%) | 540 (37.5) | 352 (44.8) | <0.001 | |
Low‑molecular‑weight heparin, n (%) | Prophylactic dose | 80.8 (1164) | 58.6 (460) | <0.001 |
Therapeutic dose | 14.8 (213) | 20.4 (160) | <0.001 | |
Time between the onset of symptoms and the start of treatment, d | ||||
Antivirals | 5 (3–7); n = 456 | 3 (2–4); n = 397 | <0.001 | |
Remdesivir | 5 (3–7); n = 454 | 3 (2–5); n = 217 | <0.001 | |
Molnupiravir | 5 (5–6); n = 2 | 2 (1–4); n = 186 | 0.06 | |
Tocilizumab | 9 (7–12); n = 221 | 7 (4–10); n = 66 | <0.001 | |
Dexamethasone | 8 (5–11); n = 859 | 6 (3–10); n = 248 | <0.001 | |
Baricitinib | 12 (10–15); n = 98 | 9 (7–11); n = 26 | 0.001 | |
Time between the diagnosis and the start of treatment, d | ||||
Antivirals | 1 (0–2); n = 467 | 1 (1–2); n = 406 | <0.001 | |
Remdesivir | 1 (0–2); n = 465 | 1 (1–2); n = 221 | <0.001 | |
Molnupiravir | 1 (1–1); n = 2 | 1 (1–2); n = 191 | 0.75 | |
Tocilizumab | 3 (1–6); n = 233 | 3 (1–7); n = 70 | 0.82 | |
Dexamethasone | 1 (1–5); n = 881 | 2 (1–5); n = 253 | 0.01 | |
Baricitinib | 6 (3–9); n = 98 | 3 (1–7); n = 26 | 0.01 | |
The clinical course of the disease
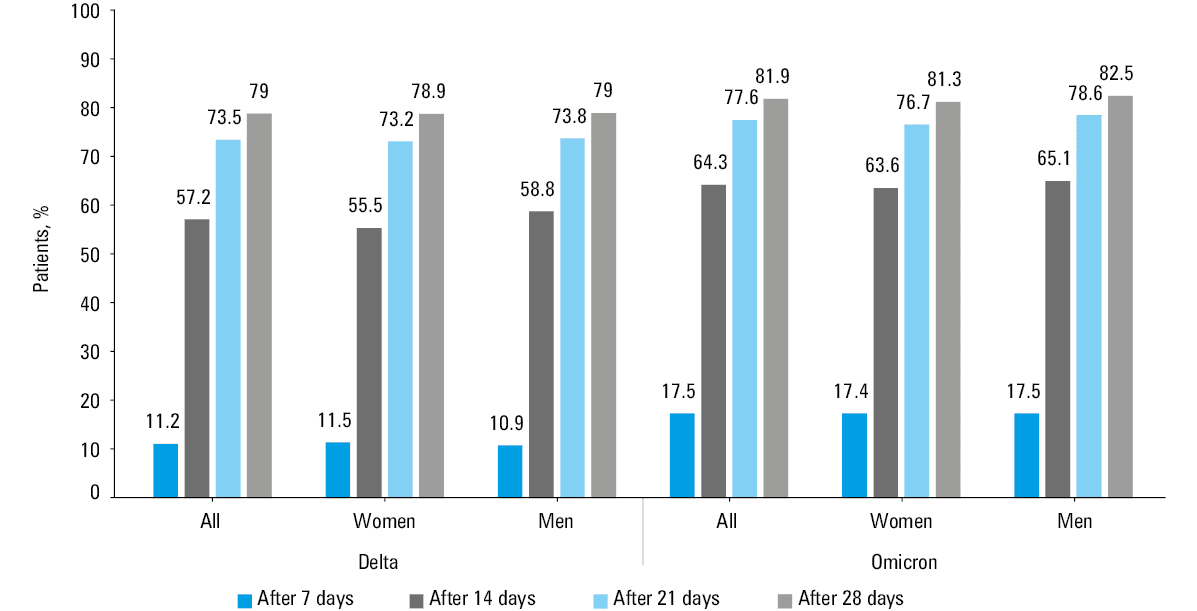
The clinical course of the disease varied between the 2 pandemic periods analyzed. After the first 7 days of hospitalization, the percentage of patients with a score reduction by at least 2 points on the ordinal scale was higher during the Omicron wave than the Delta wave (17.5% vs 11.2%, respectively; P <0.001) (Figure 3). The most marked improvement during both waves was seen after 14 days of treatment, where 64.3% and 57.2% (P = 0.001) of patients infected with Omicron and Delta, respectively, reported clinical improvement. After 21 and 28 days, the percentage of patients with improvement on the ordinal scale was high, regardless of the pandemic period, although the numbers were higher during the Omicron period (Figure 3).
Outcomes
Regardless of sex, a higher percentage of patients requiring oxygen therapy and mechanical ventilation was documented among those treated during the Delta wave than the later COVID‑19 wave (75.4% vs 47.4% and 7.2% vs 3.1%, respectively), and the difference was significant at P <0.001 for both end points (Table 4, Figure 4A). During the Delta predominance period, 214 patients (14.9%) had a fatal outcome, while 102 deaths (13%) occurred during the Omicron wave. A reduction in 28‑day mortality during the Omicron predominance period was observed only among women, while mortality in men was comparable in both waves (Table 4, Figure 4B).
Parameter | Delta: all (n = 1440) | Omicron: all (n = 785) | P value | Delta: women (n = 687) | Omicron: women (n = 407) | P value | Delta: men (n = 753) | Omicron: men (n = 378) | P value |
Abbreviations: see Table 1 | |||||||||
Need for oxygen supplementation, n (%) | 1086 (75.4) | 372 (47.4) | <0.001 | 500 (72.8) | 185 (45.5) | <0.001 | 586 (77.8) | 187 (49.5) | <0.001 |
Need for mechanical ventilation, n (%) | 103 (7.2) | 24 (3.1) | <0.001 | 45 (6.6) | 10 (2.5) | 0.003 | 58 (7.7) | 14 (3.7) | 0.01 |
Duration of oxygen supplementation, d, median (IQR) | 10 (6–15) | 8 (5–14) | 0.01 | 10 (7–14) | 9 (6–15) | 0.73 | 10 (6–15) | 8 (4–13) | <0.001 |
Mortality, n (%) | 214 (14.9) | 102 (13) | 0.23 | 112 (16.3) | 50 (12.3) | 0.07 | 102 (13.5) | 52 (13.8) | 0.92 |
Age of patients who died, y, median (IQR; min–max) | 79 (68–86; 30–99) | 81 (73–87; 25–98) | 0.23 | 81 (71–87; 30–99) | 82 (74–87; 37–97) | 0.62 | 76 (68–85; 34–98) | 80 (71–85; 25–98) | 0.17 |
Comorbidities in patients who died, n (%) | 198 (92.5) | 96 (94.1) | 0.6 | 107 (95.5) | 47 (94) | 0.68 | 91 (89.2) | 49 (94.2) | 0.31 |
Mortality depending on age, n (%) | |||||||||
<60 years | 21 (3.8) | 8 (4.2) | 0.81 | 4 (1.9) | 3 (3.3) | 0.47 | 17 (4.9) | 5 (5) | 0.97 |
60–80 years | 94 (15.4) | 42 (11.9) | 0.12 | 45 (15.2) | 19 (11.1) | 0.22 | 49 (15.7) | 23 (12.6) | 0.34 |
>80 years | 99 (35.9) | 52 (21.8) | <0.001 | 63 (34.8) | 28 (19.4) | 0.002 | 36 (37.9) | 24 (25.3) | 0.06 |
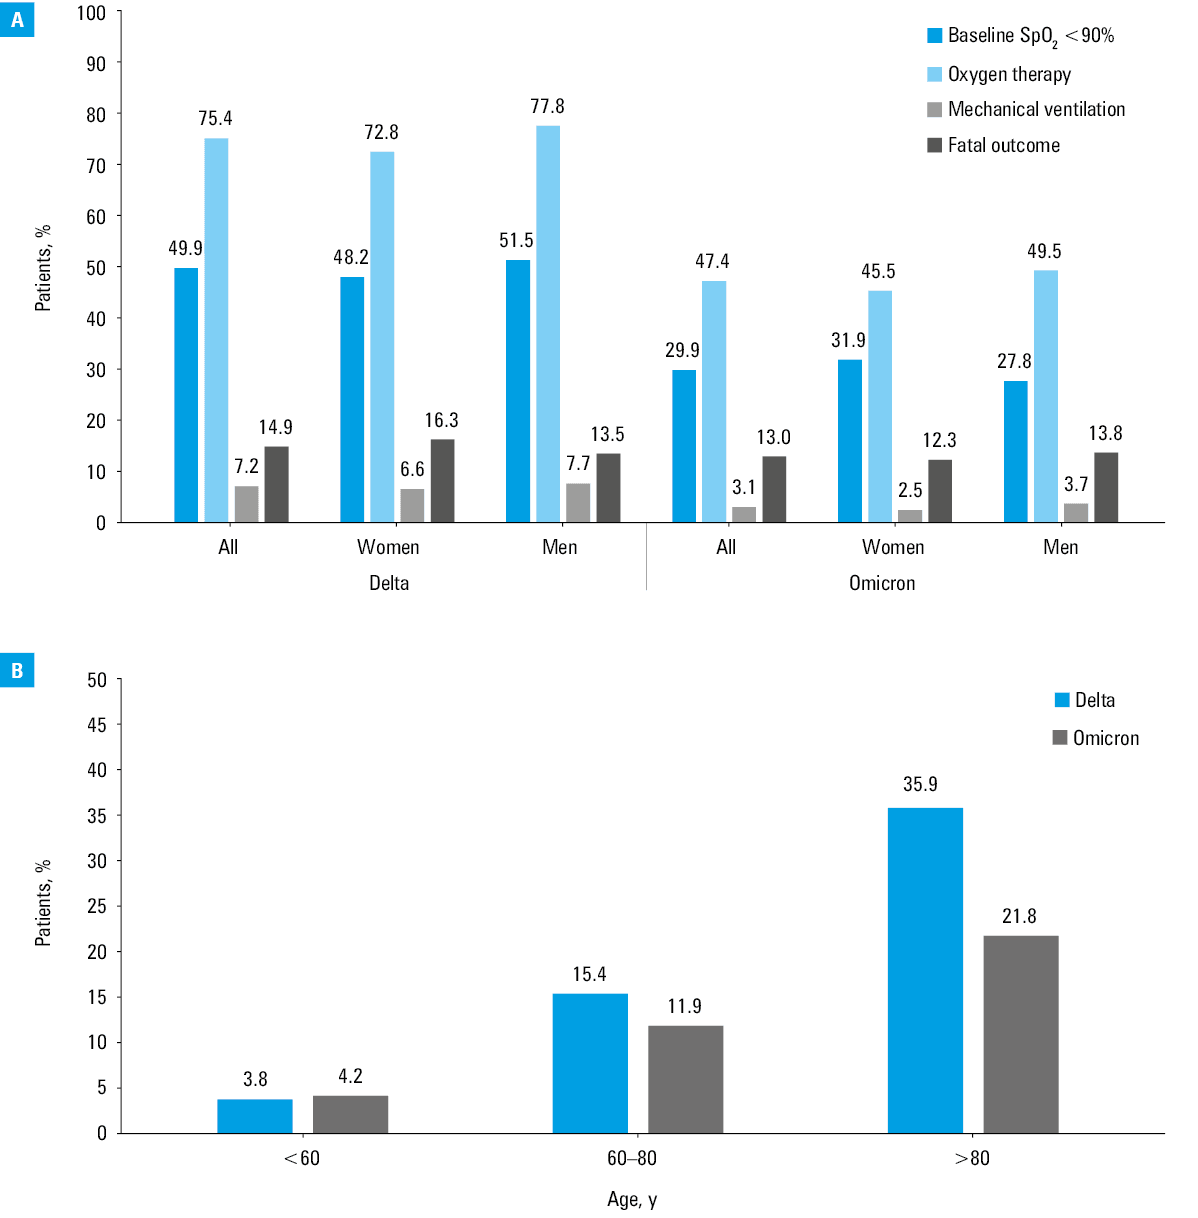
The median (IQR) age of the patients who died was higher during the Omicron wave (81 [73–87] years) than during the Delta predominance (79 [68–86] years). This difference was not significant but was observed in both men and women. A significant difference was noticed in the group over 80 years of age with 99 deaths (35.9%) documented during the Delta surge and only 52 (21.8%) during the Omicron dominance (P <0.001) (Table 4, Figure 4b). During both waves of the pandemic, the risk of death was significantly lower in the group treated with antiviral drugs. The frequency of mechanical ventilation was also lower in the patients treated with antivirals, but the difference was not significant in the 2 periods analyzed (Supplementary material, Table S1).
Discussion
We conducted a retrospective observational study using a nationwide database that collected data from dozens of medical centers across Poland. This allowed us to perform a thorough and detailed analysis of the 2225 Polish patients admitted to the hospital during 2 periods of the pandemic caused by the Delta and Omicron variants.
The patients requiring hospital treatment during the Omicron wave were significantly older, less frequently obese, and had a much higher burden of comorbidities than those hospitalized during the Delta variant’s predominant period. The results of retrospective observational studies conducted in the United States among hospitalized adults are consistent with our findings regarding the difference in the mean age of patients.26,27 This is not supported by an analysis from France, documenting lower age of patients infected with the Omicron variant than with the Delta one (54 vs 62 years).28 This study also found no difference in the prevalence of comorbidities in the patients from the 2 pandemic waves, but it should be noted that the analysis included the emergency department attendees, not hospitalized patients, which may explain such an outcome. A prospective observational study conducted at 21 centers in the United States among hospitalized patients showed not only a higher age of patients, but also a higher percentage of comorbidities, as well as a lower percentage of obese patients among hospital‑treated individuals during the Omicron wave, which confirmed our observations.29
In the current analysis, the symptomatic patients, regardless of the pandemic period, most frequently reported symptoms such as cough, fever, shortness of breath, and fatigue, although all of these were significantly more common in those infected with the Delta variant, which is consistent with the results of other real‑world studies.28,30 Interestingly, the prospective observational ZOE study from the United Kingdom, which included a population of COVID‑19 patients isolated at home and reporting their symptoms using the ZOE COVID mobile application, confirmed a significantly lower incidence of anosmia in the individuals infected with the Omicron variant (16.7% vs 52.7% during the Delta predominance), which we demonstrated in our analysis.30 The ZOE study also documented a lower rate of patients requiring hospital admission in those infected with the Omicron than the Delta variant, which was explained by a milder course of the disease. Observations indicating a less severe clinical course of the Omicron than the Delta variant have been reported in numerous studies.31-35 This is also the conclusion of our study, in which we showed a significantly higher percentage of stable patients with baseline SpO2 above 95% among those hospitalized during the Omicron wave than during the Delta wave (31.3% vs 13.3%; P <0.001), while the percentage of unstable patients with baseline SpO2 equal to or below 90% was significantly lower (29.9% vs 49.9%, respectively; P <0.001).
Consistent with the more severe baseline clinical status of the patients infected with the Delta variant, the investigated individuals presented higher levels of inflammatory parameters, such as CRP and IL‑6, and this trend was supported by other studies.36,37 Although CRP and IL‑6 levels were lower in the patients hospitalized during the Omicron period, total leukocyte count was higher. Also, the patients infected with the Omicron variant were older (≥65 years; 68% vs 52% in the Delta wave), and more susceptible to bacterial superinfections, which corresponds with the fact that antibiotics were used more often during the Omicron dominance than during the Delta wave (44.8% vs 37.5%; P <0.001).
The more severe baseline clinical status of the patients infected with the Delta strain, correlating with the disease progression to cytokine storm, translated into a higher rate of use of all immunomodulatory drugs, TCZ, DEX, and BNB in this subpopulation than in the Omicron‑infected one (65% vs 35.2%). Our findings regarding more frequent administration of DEX during the Delta than the Omicron wave agree with results from a study conducted in California (72.3% vs 48.8%).26 During the Omicron surge, on the other hand, the patients were significantly more often treated with antivirals than during the Delta predominance period (51.7% vs 32.4%; P <0.001). The difference was due to the fact that these patients had a milder course of the disease but also were admitted to the hospital earlier, in the replication phase of the virus. This allowed for the use of antiviral drugs, which, as recommended, can be started within the first 5 days of the onset of symptoms.24,25
The time from the disease onset to treatment initiation was longer for all analyzed drugs in the Delta than in the Omicron wave. However, we obtained different results when evaluating the time from diagnosis to implementation of pharmacotherapy. Both antivirals and immunomodulators were started in a shorter time from a positive test for SARS‑CoV‑2 infection during the Delta wave. It indicates that during this wave the patients were diagnosed and referred for hospital treatment not only in a worse clinical condition but possibly also after a longer time from the onset of the first symptoms. We have no objective explanation for this finding but based on our observations from the clinical practice, we can suggest several plausible reasons for it. One of them may be attempts to self‑medicate at home due to difficult access to primary health care and overloaded hospitals. The emergence and increasing availability of an oral antiviral therapy from the beginning of 2022, along with the information propagated in the media that it can be administered only in the first few days after the onset of the disease, were also important. Finally, the widespread availability of self‑testing with antigen tests may also have contributed.
Regardless of the pandemic wave, the use of antiviral drugs was associated with a significant reduction in mortality rates. Their impact on reducing the rate of mechanical ventilation was also documented, but in this case the difference was not significant. Such findings support the results of clinical trials and real‑world analyses of early antiviral drug administration in COVID‑19.22,38-42
End points, such as the need for oxygen supplementation and the need for mechanical ventilation assessed in the current study were significantly less frequent in the patients hospitalized during the Omicron wave, supporting the conclusions of many other analyses.26,43-45 As in the studies cited above, we also reported a difference regarding higher mortality rate in the patients hospitalized during the Delta wave, but significance was achieved only for the group of patients over 80 years of age (35.9% vs 21.8%; P <0.001, for the Delta and Omicron waves, respectively). This may be due to the fact that although the Delta variant caused more severe course of the disease and the patients were more often admitted to the intensive care unit for mechanical ventilation, the cohort infected during the Omicron surge was older and more burdened with comorbidities, therefore more likely to die.46
In our study, we did not consider the effect of vaccination on the course of infection and outcomes of COVID‑19. This is a major weakness of this work, given that according to available data, 3 doses of mRNA vaccine provided neutralizing protection against the Omicron variant, and regardless of the variant type, vaccination was associated with a reduced risk of mechanical ventilation and death.29,47-49 Noteworthy, however, is the fact that during the period of the Delta variant dominance, the booster dose was introduced only for selected groups of patients at a high risk of severe disease, while during the Omicron period it was available to the entire population. The status of a person vaccinated with 2 doses is different from that of a person who received a booster dose. In addition, it would be necessary to consider the interval between the last dose of the vaccine and the onset of the disease, and we did not collect such information in the SARSTer database. Prior SARS‑CoV‑2 infection in unvaccinated individuals, as well as the time at which it occurred, were also of importance. With so many confounding factors, we felt that comparing patients using a simple stratification of vaccinated vs unvaccinated would not yield reliable results. Another limitation of the study is the lack of sequencing data to identify the SARS‑CoV‑2 variant; the comparison was based on genomic surveillance indicating the period of dominance of the Delta or Omicron variant in Poland. In addition, some patients may have been admitted to the hospital for a medical reason other than COVID‑19, and have been incidentally diagnosed with SARS‑CoV‑2 infection. This was more common during the Omicron variant dominance period, when the asymptomatic patients accounted for 5.9% vs 2% during the Delta dominance period.
It is important to mention the strongest point of our study, that is, the collection of data from a real, geographically diverse population, which allows us to make more general conclusions. The real‑life settings of the study enabled us to obtain an accurate and unique picture of the course of the disease. The results not only highlighted the differences between the 2 consecutive pandemic periods regarding the baseline parameters on admission, but also allowed us to follow the patient condition during their hospital stay and to follow them up after discharge until the day 28 from the start of hospitalization, as visualized in Figure 3.
Conclusions
Our comparative analysis of the patients hospitalized during the last 2 waves of the COVID‑19 pandemic confirmed a different clinical picture of the disease with a more severe course and a worse outcome in the Delta wave. In both waves of the pandemic, caused by the Delta and Omicron variants, the use of antiviral drugs was associated with an improved prognosis.
- WHO Director‑General’s opening remarks at the media briefing on COVID‑19 ‑ 11 March 2020. https://www.who.int/director‑general/speeches/detail/who‑director‑general‑s‑opening‑remarks‑at‑the‑media‑briefing‑on‑covid‑19–-11‑march‑2020. Accessed July 31, 2022.
- WHO Coronavirus (COVID‑19) dashboard. https://covid19.who.int/. Accessed July 31, 2022.
- Day M. Covid‑19: four fifths of cases are asymptomatic, China Figures indicate. BMJ. 2020; 369: m1375. | Crossref
- Wu Z, McGoogan JM. Characteristics of and important lessons from the Coronavirus disease 2019 (COVID‑19) outbreak in China: summary of a report of 72 314 cases from the Chinese center for disease control and prevention. JAMA. 2020; 323: 1239‑1242. | Crossref
- Li J, Huang DQ, Zou B, et al. Epidemiology of COVID‑19: a systematic review and meta‑analysis of clinical characteristics, risk factors, and outcomes. J Med Virol. 2021; 93: 1449‑1458. | Crossref
SUPPLEMENTARY MATERIAL
ARTICLE INFORMATION