The prevalence of diabetes and prediabetes: a population-based study
Key words: diabetes, general population, prediabetes, prevalence


 CC BY-NC-SA 4.0
The prevalence of diabetes and prediabetes: a population-based study
Introduction: Diabetes remains one of the top public health care priorities. Over 6% of the world’s population is affected by type 2 diabetes; however, a similar number of individuals may be unaware of this diagnosis.
Objectives: Our population‑based study aimed to investigate the true prevalence of diabetes and prediabetes in the general population of a medium‑sized city in Poland.
Patients and methods: The analysis included 1051 participants of the Bialystok PLUS population‑based cohort study. In those who did not report a history of diabetes, the oral glucose tolerance test (OGTT) was performed. Medical history data were gathered using standardized questionnaires, and anthropometric as well as body composition measurements were performed.
Results: According to the medical history data, a total of 75 participants had diabetes (7.14%). Prediabetes (impaired fasting glycemia [IFG] or impaired glucose tolerance [IGT]) was identified in 410 individuals, including 241 participants with IFG (22.9%) and 169 patients with IGT (16.1%). Moreover, there were 71 individuals (6.75%) who were newly diagnosed with diabetes based on OGTT results. Overall, 146 patients with diabetes (13.8%) were identified. The ratio of lean mass to fat mass differed significantly between the patients with newly diagnosed diabetes and those without impaired glucose metabolism.
Conclusions: Our cohort study demonstrated a high prevalence of undiagnosed diabetes in the Białystok population. In addition, we showed that a large group of patients still remains undiagnosed for other hyperglycemic disorders. Abdominal obesity as well as imbalance between the fat and lean mass may predispose to diabetes.
What's new?
Recently, there have been limited data on the prevalence of diabetes and prediabetes in the general population. Our cohort study demonstrates a notable prevalence of diabetes and prediabetes in the study population. Moreover, we showed that a substantial number of patients with hyperglycemic disorders remains undiagnosed. Despite the financial resources allocated to education and prevention programs, many people are unaware that they have diabetes or prediabetes. In our study, we identified a large group of patients with prediabetic states. We also showed that a parameter derived from densitometry, the lean mass to fat mass ratio, can be useful in assessing the predisposition to glucose metabolism disturbances. Our results could help clinicians identify individuals who are particularly likely to develop disturbances in glucose metabolism.
Introduction
Diabetes remains one of the foremost priorities of the public health care system due to a steady increase in its prevalence. Well over 6% of the global population, which corresponds to approximately 537 million individuals, are affected by type 2 diabetes.1 Although the disease is typically diagnosed in middle‑aged people (aged 45–64 years), its incidence is increasing in all age groups.1 No apparent reduction in the rate of its growth has been observed despite significant investments in the research, inpatient and outpatient care, and public health interventions. Type 2 diabetes was ranked as the 18th leading cause of death in 19902; unfortunately, it moved up to the 9th place in 2017.1,2 This increase does not necessarily account for the severe diabetic complications, such as cardio- and neurovascular diseases as well as neoplasms, which have been increasingly associated with diabetes and prediabetic states.3 Despite growing public awareness of the complications caused by hyperglycemia, diabetes often remains mildly symptomatic and, therefore, undiagnosed. According to a previous study in Polish patients with chronic coronary syndrome, the prevalence of dysglycemia, both diagnosed and undiagnosed, was very high.4 The authors demonstrated that as many as 43% of the participants had a history of diabetes, 5.6% of whom (27 patients) were diagnosed after hospitalization due to cardiovascular reasons. Undiagnosed diabetes occurred in 5.1% of the respondents. Prediabetes (found in 72.4% of the participants) emerged as an alarming concern and was identified in 29.5% of those with impaired glucose tolerance (IGT).4
The aim of our population‑based study was to assess the prevalence of diabetes and prediabetes in the general population of a medium‑sized city in Poland. We indicated the number of individuals who were unaware of their diabetes and presented the typical characteristics of patients with this condition. Additionally, we identified the parameters that significantly differed between the patients with and without glucose metabolism disorders.
Patients and methods
Study population
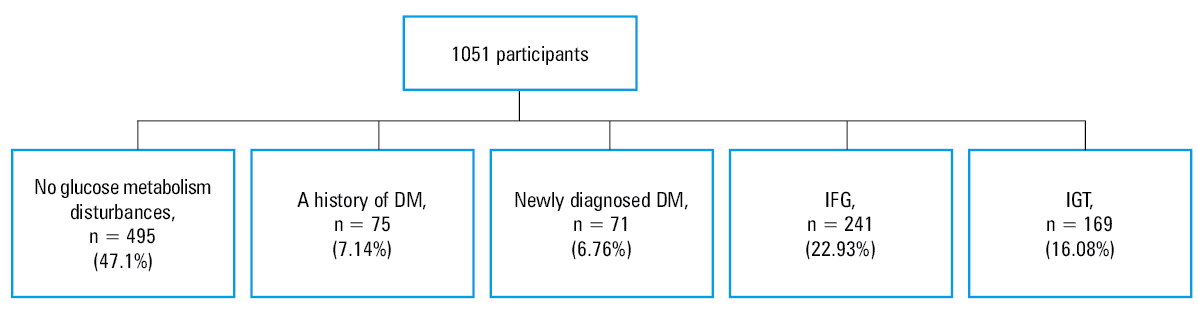
This study is a part of the Bialystok PLUS cohort study that has been ongoing since 2018. Residents of Białystok were randomly selected from the Municipal Office database and invited to participate in the study. Our sample was drawn in such a way so as to reflect the age and sex structure of the city. A total of 1051 participants responded and were subsequently examined in a specially equipped research center. Then, they were divided into groups according to their diabetes or prediabetes status (Figure 1).5,6
Abbreviations: DM, diabetes mellitus; IFG, impaired fasting glycemia; IGT, impaired glucose tolerance
Data collection
Medical history data were collected through standardized questionnaires and included the following: 1) a history of diabetes and cardiovascular events, 2) patients’ medications, and 3) cardiovascular risk factors. Anthropometric measurements were performed according to the World Health Organization (WHO) guidelines by qualified medical personnel. The measurements were taken using a SECA 201 tape (SECA, Hamburg, Germany) and included height and waist circumference. The weight measurement was performed on an InBody 770 device (InBody, Eschborn, Gernamy). Body mass index (BMI) was calculated as weight in kilograms divided by height in meters squared and is expressed in units of kg/m2. Blood pressure measurements were taken using the oscillometric method with an Omron M3 Comfort device (Omron Healthcare Co., Ltd.).7,8 Dual‑energy X‑ray absorptiometry (DEXA; Lunar iDXA, GE Healthcare, United States) was used for body composition measurements, with total body mass divided into 3 compartments: bone, fat mass, and lean mass.9,10
Peripheral intravenous blood samples were collected during the visit in the morning after at least 8 hours of fasting. The patients also declared that they had slept through the night. The samples were then centrifuged and stored at −70 °C until further analysis. Using the homogeneous enzymatic colorimetric method on a Cobas c111 device (Roche Diagnostics, Meylan, France), the concentrations of low- and high‑density lipoprotein cholesterol were determined. Total cholesterol and triglyceride levels were assessed using the enzymatic colorimetric method on the Cobas c111 device. Fasting glucose levels and the 120‑minute glucose levels in the oral glucose tolerance test (OGTT) were measured using the enzymatic reference method with hexokinase on the Cobas c111 device. Serum insulin was determined by the electrochemiluminescence immunoassay (ECLIA) on a Cobas e411 device (Roche Diagnostics). The level of glycated hemoglobin A1c (HbA1c) was determined using ion‑exchange high‑performance liquid chromatography on a D‑10 device (Bio‑Rad, Hercules, California, United States). The levels of N‑terminal pro–B‑type natriuretic peptide and high‑sensitivity troponin T were determined using ECLIA on the Cobas e411 device.
Oral glucose tolerance test
As recommended by the WHO, we performed OGTT in all patients who did not report a history of diabetes. The patients who underwent the examination had been fasting for 8 to 12 hours before the test and declared that they had slept through the night. Then, 75 g of glucose dissolved in water was administered orally. The diagnosis of diabetes or prediabetes was made in accordance with the WHO criteria6 (Table 1). The patients who did not report a history of diabetes and had a fasting glucose level above 126 mg/dl and a blood glucose level in the range of 140 to 200 mg/dl after 2 hours of oral glucose loading were included in the IGT group (n = 10). The HbA1c level was not considered in the diagnosis of diabetes.
Condition | Fasting glucose, mmol/l (mg/dl) | 2 h post glucose load, mmol/l (mg/dl) |
a In our study diabetes was not diagnosed based on fasting glucose due to availability of a single measurement only.
Abbreviations: see Figure 1 | ||
Diabetes | ≥7 (126)a | 11.1 (200) |
IFG | No previous diabetes diagnosis; 5.6–6.9 (100–125) | <7.8 (140) |
IGT | No previous diabetes diagnosis | ≥7.8 (140) and <11.1 (200) |
Trial registration and ethical issues
The study was registered on ClinicalTrials.gov (identifier NCT03197363). Ethical approval for the study was provided by the local Ethics Committee (R‑I‑002/108/2016).
Statistical analysis
Descriptive statistics for continuous variables were presented as medians and interquartile ranges, and for quantitative variables as counts and frequencies. The Shapiro–Wilk test was used for checking the normality of data distribution. Comparisons between the subgroups were performed using the Kruskal–Wallis test for continuous variables and the χ2 test for quantitative variables. Post‑hoc testing was done using the Dunn–Bonferroni test. Statistical analysis was performed using the Python Software Foundation (version 3.9, http://www.python.org) and STATA 16 (StataCorp, College Station, Texas, United States). The level of statistical significance was set at a P value below 0.05.
Data shown in Figure 2 are based on the age and sex structure of the city of Białystok. Statistical data on sex and age were obtained from the database of the local Municipal Office during the initial random draw. When extrapolating the results of this study to the Białystok population, the estimated number of people living in the city was calculated as a weighted sum, where each person in the study cohort was assigned a weight proportional to the number of people of the same age and sex in the Białystok population, and inversely proportional to the number of people of the same age and sex in the study cohort. For the purpose of this analysis, the age variable was divided into 5‑year strata. Figures 1, 3, and 4 represent our raw data, without recalculation to the population of Białystok.
Abbreviations: see Figure 1
Abbreviations: see Figure 1
Results
Prevalence of diabetes and prediabetes
Our analysis included 1051 participants enrolled in the Bialystok PLUS cohort study. According to the medical history data, 75 patients (7.14%) had diabetes. Based on the laboratory test results, prediabetes was found in 410 participants (approximately 40%). We also distinguished a subgroup without glucose metabolism disturbances, which accounted for 47.1% of the total cohort (n = 495). The participants with impaired fasting glycemia (IFG) constituted 22.93% of the study group (n = 241), and those with IGT constituted 16.1% (n = 169). Among the prediabetic patients, we identified 104 individuals with both IGT and IFG (25.37% of all patients with prediabetes). Moreover, 71 individuals (6.76%) were diagnosed with diabetes for the first time after undergoing OGTT in our study. A total of 44 patients in this group (62%) had a fasting glucose level below 126 mg/dl, suggesting that OGTT should have been performed routinely to diagnose glucose metabolism disorders. Fasting glucose levels exceeded 126 mg/dl in 65 participants. Overall, 146 patients with diabetes (13.8%) were found in the study population (Figure 1).
Characteristics of the study population by subgroups
Baseline characteristics of patients with particular diagnoses are listed in Tables 2 and 3. Men represented 47.8% of the group with newly diagnosed diabetes and 38.7% of the patients with known diabetes. The same trend could be observed in the group with IGT, of which approximately half were men (47.3%). In the participants with IFG, men accounted for 59.3%. We also observed differences in BMI values between the individuals without impaired glucose metabolism and the patients with diabetes. The median age in the group without glucose metabolism disturbances was 40 years, and in the patients with diabetes it was 65 years. A noticeable trend toward fewer smokers in the group without impaired glucose metabolism was observed, and diabetic patients presented higher blood pressure values on average.
Parameter | No glucose metabolism disturbances (n = 495) | Known diabetes (n = 75) | Newly diagnosed diabetes (n = 71) | IFG (n = 241) | IGT (n = 169) | P value |
Data are shown as number (percentage) of patients or median (interquartile range). Differences were assessed using the Dunn–Bonferroni post‑hoc test, the level of significance was set at P = 0.05.
a Reference ranges: AST, 8–33 IU/l; ALT, 4–36 IU/l; CRP, <10 mg/l
SI conversion factors: to convert ALT and AST to μkat/l, multiply by 0.0167; CRP to nmol/l, by 9.524.
Abbreviations: ALT, alanine aminotransferase; AST, aspartate aminotransferase; CRP, C‑reactive protein; DBP, diastolic blood pressure; MI, myocardial infarction; PAD, peripheral artery disease; SBP, systolic blood pressure; others, see Figure 1 | ||||||
Male sex | 172 (35.1) | 29 (38.7) | 33 (47.8) | 143 (59.3) | 80 (47.3) | <0.001 |
Age, y | 40 (31.5–52) | 65 (57–71.5) | 64 (58.5–69.5) | 51 (38–62) | 57 (43–66) | <0.001 |
SBP, mm Hg | 115.5 (106.5–127) | 132.5 (122.8–143.3) | 135 (122–149.5) | 127 (116.3–138.3) | 129 (118.5–141) | <0.001 |
DBP, mm Hg | 78.5 (72.5–84) | 82 (78.3–89.8) | 84 (79–90.3) | 83 (77–90.3) | 83 (78–91.1) | <0.001 |
Ever smoker | 263 (54) | 47 (64.4) | 46 (65.7) | 146 (62.1) | 87 (52.7) | 0.054 |
Current smoker | 102 (21) | 1 (23.3) | 17 (24.3) | 56 (23.9) | 26 (15.8) | 0.35 |
History of MI | 4 (0.81) | 6 (8) | 0 | 5 (2.1) | 3 (1.8) | <0.001 |
History of PAD | 1 (0.2) | 3 (4) | 0 | 1 (0.42) | 4 (2.4) | 0.002 |
ASTa, IU/l | 19.7 (17.3–23.8) | 22.3 (17.7–27.2) | 22.4 (19.3–27.9) | 23.3 (19.2–27.1) | 21.3 (18.9–25.4) | <0.001 |
ALTa, IU/l | 17.9 (12.7–23.2) | 23.1 (17.6–31.1) | 22.8 (16.7–33.4) | 22 (16.9–31.8) | 20.1 (16–28) | <0.001 |
CRPa, mg/l, | 0.58 (0.27–1.27) | 1.46 (0.82–3.3) | 1.4 (0.7–2.7) | 0.75 (0.35–1.66) | 1 (0.48–2.15) | <0.001 |
Troponin T, μg/l | 4.33 (1.5–6.1) | 8.8 (5.8–13.9) | 7 (5.2–10.3) | 5.1 (3.1–7.4) | 5.8 (3.7–9.2) | <0.001 |
Parameter | No glucose metabolism disturbances (n = 495) | Known diabetes (n = 75) | Newly diagnosed diabetes (n = 71) | IFG (n = 241) | IGT (n = 169) | P value |
Data are shown as median (interquartile range). Differences were assessed using the Dunn–Bonferroni post‑hoc test, the level of significance was set at P <0.05.
a Reference range <200 mg/dl
SI conversion factors: to convert HDL‑C, LDL‑C, and TC to mmol/l, multiply by 0.0259; glucose to mmol/l, by 0.0555.
Abbreviations: BMI, body mass index; HbA1c, glycated hemoglobin; HDL‑C, high‑density lipoprotein cholesterol; HOMA‑IR, Homeostatic Model Assessment of Insulin Resistance; LDL‑C, low‑density lipoprotein cholesterol; N/D, not determined; TC, total cholesterol; others, see Figure 1 | ||||||
BMI, kg/m2 | 24.3 (21.9–27) | 31.5 (28.3–35.1) | 30 (26–34) | 27.2 (24.3–30.6) | 28.1 (24.8–31.6) | <0.001 |
Body weight, kg | 70.2 (61.5–80.45) | 86.1 (73.3–97.5) | 82.3 (72.7–95) | 81.8 (70.4–92.5) | 79.3 (79.3–90.6) | <0.001 |
TCa, mg/dl | 184.5 (160.3–209) | 178 (144.5–207.5) | 190 (175.5–230) | 199 (169–224) | 193 (167–218) | <0.001 |
LDL‑C, mg/dl | 116.7 (95.8–1018) | 107 (78.1–144.7) | 125 (104–158) | 131 (107.6–157) | 128.3 (101.6–150) | <0.001 |
HDL‑C, mg/dl | 63 (52.4–74) | 55 (44.7–63) | 54 (47.3–69.3) | 59.9 (49–73.3) | 57.9 (49–67) | <0.001 |
Fasting glucose, mg/dl | 92 (87–96) | 126 (112–146.5) | 117 (106–128) | 104 (102–109) | 103 (96–108) | <0.001 |
Serum glucose 2 h after oral dose of glucose, mg/dl | 105 (90–119) | N/D | 212.5 (200–235.3) | 115 (102–127) | 156 (146–174) | <0.001 |
HbA1c, mmol/mol; % | 58 (55–60); 5.3 (5–5.5) | 71 (65–78); 6.5 (5.9–7.1) | 64 (62–68); 5.9 (5.7–6.2) | 60 (58–62); 5.5 (5.3–5.7) | 60 (57–63); 5.5 (5.2–5.8) | <0.001 |
HOMA‑IR | 1.94 (1.4–2.6) | 4.7 (3–7.4) | 4.2 (2.8–6.6) | 3.1 (2.3–4.3) | 3 (2.1–4.5) | <0.001 |
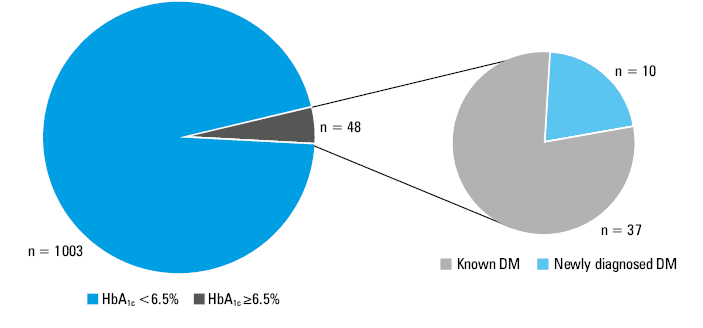
In Figure 3, we showed the distribution of HbA1c levels in the groups stratified according to the glucose metabolism. HbA1c values equal to or greater than 6.5% were only found in the patients with known diabetes. We did not consider HbA1c values in the diagnosis of diabetes; however, had this parameter been considered, our results would not have changed. Most patients with undiagnosed diabetes (n = 61 [85.92%]) had HbA1c values below 6.5%, which highlights the importance of OGTT in the diagnosis of diabetes. Moreover, 90 participants had an HbA1c level equal to or greater than 6% but lower than 6.5%. Interestingly, 45.6% of the patients in this group were diagnosed with prediabetes.
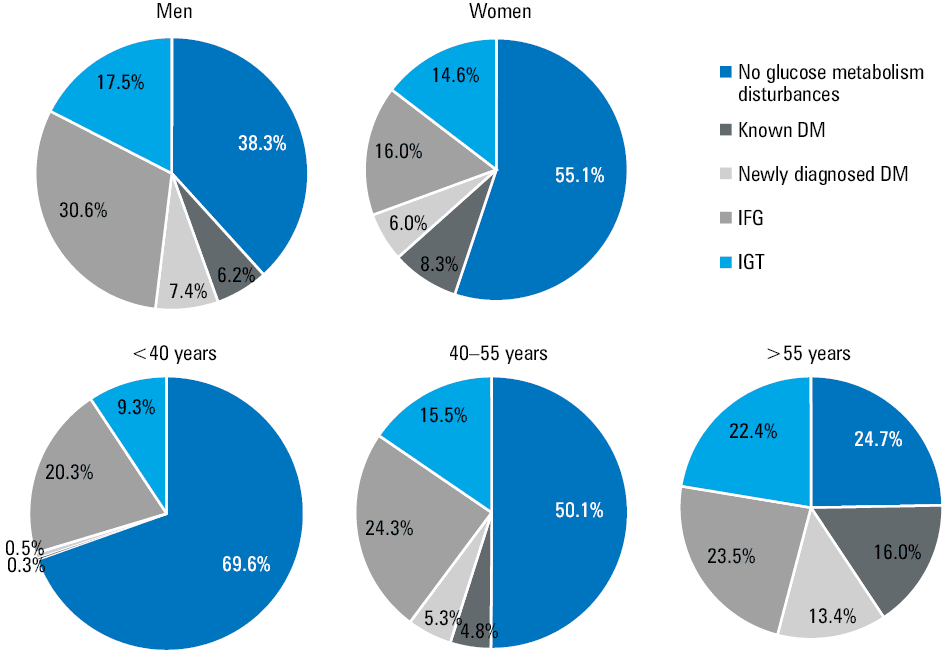
Figure 2 illustrates the numerical distribution of the diagnoses of dysglycemia in the Białystok population stratified by sex and age. In our study, dysglycemia was more prevalent among men. Remarkably, the rate of newly diagnosed diabetes was the same in both men and women. We demonstrated that the impaired glucose metabolism characterized by IFG was twice more frequent in men than in women. The prevalence of any type of glucose metabolism disturbances increased with age. The highest prevalence of both diagnosed and undiagnosed diabetes was found in the patients over the age of 55 years; however, a notable increase in the frequency of diabetes was already seen in the participants older than 40 years.
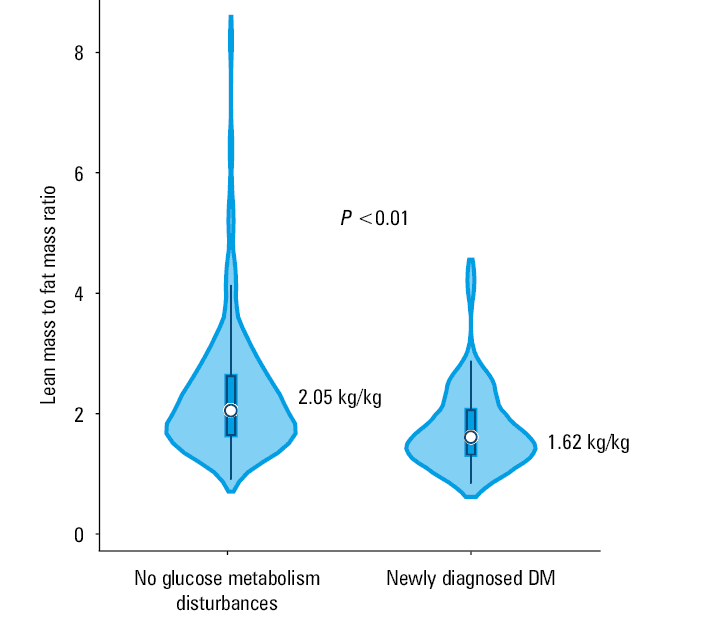
One of the aims of our study was to identify the parameters that differed between the patients with newly diagnosed diabetes and those without glucose metabolism disorders. As mentioned before, BMI may be used as an indicator that differentiates the patients with diabetes from those with normal glucose metabolism. Moreover, it appears that parameters of body composition (waist‑to‑hip ratio [WHR]), as well those obtained based on DEXA, could enable clinicians to identify the patients with an increased predisposition to diabetes or prediabetes (Figure 4, Supplementary material, Table S1). We compared the groups without impaired glucose metabolism and with previously undiagnosed diabetes (diabetes diagnosed during our study) to identify the parameters that should be of particular interest to physicians when examining apparently healthy patients for the presence of metabolic disorders. The ratio of total lean mass to fat mass was significantly different between the patients with newly diagnosed diabetes and those with normal glucose metabolism (P <0.05). No such differences were found between the same groups when these parameters were calculated only for the lower limbs. We also found an association between WHR and type 2 diabetes (Supplementary material, Table S1).
Discussion
Our analysis revealed a high prevalence of diabetes, with almost half of the cases being previously undiagnosed. Diabetes has become a global epidemic over the past decade, particularly in the countries with high rates of obesity. According to the WHO data, trends in diabetes prevalence across all continents are rising.6 The latest data (2021) from the International Diabetes Federation (IDF) show that 537 million adults (20–79 years old) worldwide have diabetes, and this number is expected to rise to 784 million by 2045.2 Moreover, 81% of patients with diabetes come from low- or middle‑income countries.2,8 At the top of the podium in terms of diabetes prevalence are China, India, and the United States of America (USA).8 In Europe, the burden of the disease is not much lower, accounting for 7.3% of the population.6 Our data confirm that disturbances in glucose metabolism are extremely prevalent. In our study, the rate of known diabetes was similar to that observed in the European population (7.3%). Moreover, inclusion of OGTT in the diagnostic workup of resulted in a significant growth in the number of diagnosed diabetes cases, up to 13.8%. We also found other glucose metabolism disorders (prediabetes) in 39% of the patients.
In the Multicenter Polish Population Health Status Study (WOBASZ), conducted from 2003 to 2005, 6.8% of the participants were diagnosed with diabetes, and the disease incidence was slightly higher in men.10 In our study, diabetes occurred with a similar frequency in both sexes. In the WOBASZ II study (2013–2014),11 6% of the respondents declared having diabetes, and 2.8% were diagnosed with the disease after a single fasting glucose measurement. The number of patients with a history of diabetes identified in WOBASZ II is in line with our results. The discrepancy in the rate of new diagnoses may be due to differences in methodology—in our study OGTT was used. According to the Polish guidelines on diabetes,12 dual measurements of fasting glucose, OGTT, and HbA1c should be used to confirm the diagnosis. In the present study, we did not perform a repeated measurement of the fasting glucose level. A total of 10 participants with a fasting glucose concentration greater than 126 mg/dl and a glucose level of 140 to 200 mg/dl 120 minutes after the OGTT were included in the IGT group. In the remaining 55 patients with fasting glucose values greater than 126 mg/dl, diabetes was diagnosed based on the glucose concentration exceeding 200 mg/dl after 120 minutes of glucose loading in the OGTT. Therefore, the real number of patients with newly diagnosed diabetes may be even higher than shown in our results. In the NATPOL 2011 study,13 the prevalence of diabetes was 6.7%, based on medical history and a single fasting glucose measurement. In summary, differences between the dysglycemia prevalence suggest that a single fasting glucose measurement in the general population is not sufficient to confirm glucose metabolism disturbances, and OGTT should be performed.
Despite the high prevalence of diabetes and the risk of mortality associated with the disease, the number of people being diagnosed has not significantly improved—it is estimated that in the USA nearly half of all patients with diabetes are unaware of their condition.2 European studies show that 1 in 3 people with diabetes are undiagnosed.2 As mentioned above, a previous study conducted in the Polish population showed that 2.8% of the participants had not been previously diagnosed with diabetes.10 Another Polish study showed that over one‑quarter of the study participants were not aware of having diabetes.11 Our findings support the thesis that many patients remain unaware of their health condition. Moreover, awareness of dysglycemia in the patients with diabetes remains low. It has been shown that there is a significant difference in knowledge about diabetes among various age groups, but no association with sex or educational level has been found.14 Consequently, more funding and public health resources should be allocated to diagnosing diabetes in the general population and to the education of both the patients with diabetes and those without dysglycemia.
The problem of undiagnosed diabetes affects the health care system in various ways, despite the fact that diabetes is a preventable and effectively treatable disease. It is well documented that in recent years the financial effort toward the education of patients with diabetes has increased considerably.15,16 However, as highlighted by our results, the support for a more efficient diagnosis of patients, especially younger individuals, is insufficient.17 According to the Polish National Institute of Public Health, PLN 3247.5 million were spent in 2017 on the treatment of diabetes‑related complications alone due to more severe comorbidities and higher overall morbidity in diabetic patients.18 The evidence presented above suggests that it is necessary to invest in preventive programs to facilitate diagnosis for the primary care physician and to broaden the research on the parameters that can be used in distinguishing patients at high risk of developing diabetes. At the public education level, preventive classes should be introduced in schools to spread knowledge about the disease.
Prediabetes refers to blood glucose levels that are higher than normal but not high enough to diagnose type 2 diabetes.19 Although this state dramatically enhances the possibility of diabetes, the disease will not develop in everyone who is diagnosed with prediabetes.20 Prediabetes is also becoming a public health concern because of its close association with increased risk of cardiovascular diseases.3 The epidemiology of prediabetes varies widely within the literature, depending on the selected definition and methodology. According to the IDF, 541 million adults around the world have IGT.2 Only 4 years earlier, the same institution estimated the prevalence of IGT at 7.3% of the global population, which corresponded to 352.1 million individuals.15 Moreover, there is no significant difference in the number of individuals with prediabetes between sex groups, and approximately half of the patients with prediabetic conditions are younger than 50 years.3,15 The prevalence of prediabetes in the WOBASZ II study was considerably higher than in WOBASZ I—there was an increase in the IFG rate from 9.3% to 18.4%.10,11 The total incidence of IFG in another Polish population‑based study was 15.6%.13 Our results based on the OGTT suggest that the frequency of both IGT and IFG is higher than previously reported. It is worth noting that the patients were repeatedly educated about how to prepare for the fasting glucose measurement, and the information about overnight fasting prior to the blood collection was confirmed again during the follow‑up interview. Furthermore, the patients with prediabetes had higher HbA1c values than the participants without glucose metabolism disturbances.
We aimed to identify parameters that distinguish the patients with undiagnosed diabetes from those without impaired glucose metabolism. It is well known that overweight and obesity, physical inactivity, hypertension, polycystic ovary syndrome, and genetic factors increase the risk for diabetes.21 In our study, we also confirmed the importance of abdominal obesity, evaluated by means of WHR. According to our results, assessment of the lean mass to fat mass ratio by means of DEXA in the patients with close to abnormal or abnormal body weight based on BMI could be useful in clinical practice. Moreover, these results suggest that predisposition to diabetes is not merely due to increased fat content, but also diminished lean mass, with these 2 phenomena being synergistically detrimental. The identification of such parameters and their clusters is crucial during the COVID‑19 pandemic since both diabetes and obesity have been found to increase the COVID‑19 mortality.22,23 Moreover, a recent study24 indicated that diabetes was associated with elevated in‑hospital and long‑term mortality rates after myocardial infarction, which also highlights the importance of early diagnosis of diabetes for risk reduction.
The main limitation of the study is the single fasting glucose measurement, which made it impossible for us to diagnose diabetes based on the fasting glucose level. Also, not all invited participants were evaluated.
Conclusions
The current cohort study demonstrated a high prevalence of diabetes, with nearly 50% of the disease cases being previously undiagnosed. The group of patients requiring close follow‑up for hyperglycemia was heterogeneous. Detailed medical history data, BMI, and parameters of body composition, such as the ratio of lean mass to fat mass, are factors to which physicians should pay particularly close attention when considering OGTT for the diagnosis of diabetes.
- Khan MAB, Hashim MJ, King JK, et al. Epidemiology of type 2 diabetes – global burden of disease and forecasted trends. J Epidemiol Glob Health. 2020; 10: 107‑111. | Crossref
- International Diabetes Federation: IDF Diabetes Atlas 2021. https://diabetesatlas.org/atlas/tenth‑edition/. Accessed February 2022.
- Huang Y, Cai X, Qiu M, et al. Prediabetes and the risk of cancer: a meta‑analysis. Diabetologia. 2014; 57: 2261‑2269. | Crossref
- Drobek N, Sowa P, Jankowski P, et al. Undiagnosed diabetes and prediabetes in patients with chronic coronary syndromes‑an alarming public health issue. J Clin Med. 2021; 10: 1981. | Crossref
- Chlabicz M, Jamiołkowski J, Łaguna, W, et al. Effectiveness of lifestyle modification vs. therapeutic, preventative strategies for reducing cardiovascular risk in primary prevention—a cohort study. J Clin Med. 2022; 11: 688. | Crossref
SUPPLEMENTARY MATERIAL
ARTICLE INFORMATION