Predictors of treatment response to serotonin and noradrenaline reuptake inhibitors in fibromyalgia
Key words: anxiety, depression, fibromyalgia, insulin resistance, treatment resistance


 CC BY-NC-SA 4.0
Predictors of treatment response to serotonin and noradrenaline reuptake inhibitors in fibromyalgia
Introduction: Fibromyalgia (FM) is often comorbid with anxiety and depression. Serotonin and noradrenaline reuptake inhibitors (SNRIs) are used in the treatment of FM, depression, and anxiety, but they are ineffective in a substantial number of patients. Recently, it has been reported that FM is associated with impaired glucose metabolism.
Objectives: The aim of the study was to explore the associations between insulin resistance, psychiatric comorbidities, and treatment response to SNRIs in patients with FM.
Patients and methods: A total of 59 patients with FM and 30 healthy controls (HCs) were recruited. The study patients were classified as treatment‑nonresponsive if the SNRI treatment resulted in a reduction in reported pain by less than 30%. All participants were examined by a physician and completed self‑report questionnaires. Blood samples were drawn to assess fasting glucose and insulin levels and to calculate the Homeostatic Model Assessment of Insulin Resistance (HOMA‑IR) values. Multivariable logistic regression models were constructed to analyze the associations between insulin resistance, psychiatric comorbidies, and the lack of response to treatment with SNRIs.
Results: The SNRI nonresponders (FM [T–]) had higher body mass index (BMI), fasting insulin level, and HOMA‑IR values than the responders (FM [T+]) and HCs. The FM [T+] patients did not significantly differ from HCs in terms of BMI, levels of fasting glucose and fasting insulin, and HOMA‑IR values. Depression, anxiety, and personality disorders were significantly more prevalent in the FM [T–] than in the FM [T+] group. Insulin resistance, depression, anxiety, and personality disorders were identified as the predictors of nonresponse to SNRI treatment. The effect of BMI on the lack of response to SNRIs was fully mediated by insulin resistance.
Conclusions: Increased values of certain clinical and metabolic parameters (BMI, fasting glucose, fasting insulin, HOMA‑IR) as well as the presence of psychiatric comorbidities could affect the response to treatment with SNRIs in the patients with FM.
What's new?
Patients with fibromyalgia (FM) are heterogenous in terms of their metabolic status. Contrary to the previously published data, our study shows that only a subgroup of FM patients is characterized by insulin resistance. In patients with FM who are responsive to treatment with serotonin and noradrenaline reuptake inhibitors (SNRIs), the levels of fasting glucose and insulin, insulin resistance, and body mass index (BMI) are similar, as compared with healthy controls. However, the FM patients who are not responsive to treatment with SNRIs are characterized by higher fasting glucose and fasting insulin levels, as well as greater insulin resistance and BMI than both healthy controls and the FM patients responsive to SNRIs. The SNRI nonresponders present greater prevalence of depression, anxiety, and personality disorders than the individuals responsive to SNRI treatment. Insulin resistance, depression, anxiety, and personality disorders are predictors of the lack of response to treatment with SNRIs in FM.
Introduction
Fibromyalgia (FM) is a fairly prevalent chronic pain syndrome—it is estimated to affect between 2% and 5% of the general population.1,2 However, little is known about the pathophysiology of this disorder. The few studies investigating the biological underpinnings of FM symptoms linked the condition to neuroinflammation, central sensitization,3 oxidative stress,4 and diurnal rhythm disruptions.5 Recently, it has been reported that FM is associated with impaired glucose metabolism. Kim et al6 showed that patients with FM were more likely to have impaired fasting glucose levels than healthy individuals. In a small cross‑sectional study, Pappola et al7 observed a link between FM and insulin resistance. Zetterman et al8 reported that FM patients showed a higher glucose load at 1 and 2 hours after an oral glucose tolerance test, as compared with healthy controls (HCs). However, these differences were explained by a higher body mass index (BMI) and greater percentage of smokers among the FM patients. Furthermore, Hassan et al9 used a reserpine‑induced FM model in rats to check the efficacy of an antidiabetic drug (pioglitazone) in FM symptom relief. They showed that pioglitazone significantly reduced some of the FM symptoms, namely fatigue and increased muscle performance.
The pharmacological treatment of FM is challenging, as the majority of analgesics, that is, nonsteroid anti‑inflammatory drugs (NSAIDs) or opioids, are either ineffective10 or reduce the pain but also impair the functioning of the patients.11 Among the few drugs that were found to be significantly more effective than placebo in reducing pain in FM are serotonin and noradrenaline reuptake inhibitors (SNRIs): duloxetine, milnacipran, and an α2 calcium channel blocker, pregabalin. These drugs are also effective in the treatment of depression and anxiety.12 Psychiatric comorbidities are common in FM patients—studies report that between 21% and 80% of these patients suffer from depression or anxiety,13 and between 8.7% and 96.7% display symptoms of personality disorders.14 We previously performed a pilot study in a group of 21 patients with FM.15 The results indicated that mean Homeostatic Model Assessment of Insulin Resistance (HOMA‑IR) values were higher in the FM patients resistant to SNRI treatment than in those responsive to the treatment. Further analyses in a sample of 19 participants compared the FM patients responsive and nonresponsive to SNRIs using the subscales of the Fibromyalgia Impact Questionnaire (FIQ) in order to identify the differences in their clinical presentation. The results showed significant links between the levels of depression and anxiety,16 as well as other psychiatric symptoms, such as cognitive impairment and sleep disorders,17 and the response to treatment with SNRIs.
The primary aim of the present study was to examine the relationship between insulin resistance and treatment response to SNRIs in FM. We also assessed the prevalence of psychiatric comorbidities in patients with FM and their association with the response to SNRI treatment.
Patients and methods
This was an observational, cross‑sectional study. The participants were recruited between December 2020 and March 2022. Individuals treated at the Department of Rheumatology and Immunology and the Department of Psychiatry of the University Hospital in Kraków, Poland were enrolled if they met the inclusion criteria: 1) age of 18 to 65 years, 2) diagnosis of FM based on the 2016 American College of Rheumatology criteria confirmed by a rheumatologist,18 and 3) a history of treatment with SNRIs: duloxetine (60–120 mg/d), venlafaxine (150–225 mg/d), or milnacipran (100–200 mg/d). The exclusion criteria comprised: 1) diabetes (according to the World Health Organization criteria19) or pharmacotherapy with antidiabetic drugs (including metformin), 2) other severe, acute, or chronic neuropathic musculoskeletal pain and other nonpsychiatric disorders, 3) substance use disorder (other than smoking), 4) severe personality disorders (the severity of personality disorders was assessed according to the criteria proposed by Tyrer et al20), 5) a history of psychosis, 6) no history of SNRI treatment, a history of taking suboptimal SNRI doses, or a history of taking an SNRI for less than 8 weeks, and 7) concomitant use of other antidepressants. The patients were examined by a rheumatologist before enrolment. Those who showed signs and symptoms of any disorders other than FM were further assessed to rule out metabolic, endocrine, infectious, chronic inflammatory, or autoimmune diseases. Given that psychiatric comorbidities are common in the FM population, the patients were included even if they had depression (International Statistical Classification of Diseases and Related Health Problems, Tenth Revision [ICD‑10] codes F32–F33 or F34.1), anxiety (ICD‑10 codes F41), or a mild or moderate personality disorder (ICD‑10 codes F60–F61). Each patient was assessed by a psychiatry specialist, and the psychiatric comorbidity was reported in the results. The patients were only excluded if the FM symptoms first occurred and later resolved simultaneously with the treatment and remission of depressive symptoms, as this would suggest that in these cases FM was secondary to depression. We included participants with comorbidities, such as asthma, allergic diseases, dermatoses (ie, lichen planus, contact dermatitis, vitiligo), thyroid insufficiency, mitral valve prolapse, hyperlipidemia, and hypertension, provided that these conditions were appropriately treated and well controlled. The participants with any nonpsychiatric diseases were asked to provide test results or documents confirming adequate control of their illnesses (eg, laboratory test results of thyroid hormone levels, a medical certificate from their family doctor or a specialist). All patients were educated on the treatment modalities recommended in FM management, including, among others, physical activity, psychotherapy, or pharmacotherapy. The patients who expressed willingness were referred to a psychotherapist after the psychiatric consultation. Given that the study was cross‑sectional in design, the choice of an SNRI was at the discretion of the attending physician, based on the clinical presentation and potential contraindications or drug interactions.
A group of HCs was also enrolled. The HCs were recruited from among the families and acquaintances of the researchers, using the same age criteria as in the study group. The exclusion criteria for this group were: 1) severe, acute, or chronic psychiatric disorders, 2) severe, acute, or chronic nonpsychiatric disorders, and 3) substance use disorders (other than smoking). All HCs were interviewed by a physician, and a physical examination was performed to rule out any diseases. Each HC completed self‑report questionnaires, including the Hospital Anxiety and Depression Scale, Mood Disorder Questionnaire, State and Trait Anxiety Inventory, Pittsburgh Sleep Quality Index, and Oxford‑Liverpool Inventory of Feelings and Experiences to rule out any psychiatric comorbidities that could have been overlooked otherwise. The inclusion criteria for HCs with nonpsychiatric comorbidities were the same as those applied in the study group.
All participants provided a written informed consent to be included in the study. The study was approved by the local Bioethical Committee (1072.6120.172.2021).
All participants were interviewed by a physician and asked to fill out the self‑administered questionnaires. Data on the disease and treatment duration, current pharmacotherapy, history of trauma (assessed with and open question about events that the patients described as subjectively traumatic; the participants reported traumas such as emotional, physical, and sexual violence, death of a relative, traffic accident, being attacked by a dog, mobbing in the workplace, etc), and smoking were collected. Data on anthropometric parameters were obtained during the interview and were verified using the electronic health records. If they were not available, the measurements were performed during the assessment by the physician. The patients were asked to evaluate the magnitude of pain relief experienced after at least 8 weeks of SNRI treatment on the Numeric Rating Scale (score range, 0–10 with 0 indicating no pain relief and 10 indicating complete pain relief). The criteria of treatment response were based on the recommendations of the Initiative on Methods, Measurement, and Pain Assessment in Clinical Trials (IMMPACT), which define at least 30% relief of pain as a moderate and at least 50% relief of pain as a substantial clinical outcome. Our aim was to distinguish individuals with any clinically meaningful pain relief after SNRI treatment from those without such an outcome; therefore, we set the criteria of treatment response at the level of greater than or equal to a 30% reduction of pain after treatment with SNRIs.21 The patients were then divided into 2 groups of the responders (FM [T+]) and nonresponders (FM [T–]) to treatment with SNRIs.
The severity of FM was assessed with the FIQ. The questionnaire is composed of 20 items assessing 7 domains: physical functioning, well‑being, work‑related, pain, fatigue / sleep, stiffness, and psychological symptoms. All FIQ items refer to the week preceding the evaluation. The first question assesses the ability to perform muscle tasks, it consists of 11 items rated on a 4‑point Likert scale. In questions 2 and 3, the patient is asked to mark the number of days they felt well and the number of days they were unable to work because of FM. Questions 4 to 10 are linear scales (marked 0–10) rating work difficulty, pain, fatigue, morning tiredness, stiffness, anxiety, and depression.22 Furthermore, to measure the severity of FM, we used parameters included in the FM diagnostic criteria, namely the Widespread Pain Index (WPI), Symptom Severity Scale (SSI), and Fibromyalgia Severity (FS), which is the sum of WPI and SSI scores, to assess the severity of FM.18
Venous blood samples were drawn from the participants after at least 12 hours of fasting. Each sample was assessed for serum levels of glucose and insulin by a certified diagnostic laboratory. Next, the HOMA‑IR value was calculated to assess the level of insulin resistance.23 The fasting glucose levels were considered increased if they equaled or exceeded 5.6 mmol/l. The fasting insulin levels were considered increased if they equaled or exceeded 15 µU/ml. The participants were classified as insulin resistant if their HOMA‑IR value exceeded 2.1. Given that HOMA‑IR values may vary among different populations,24 the cutoff point of 2.1 was established based on the literature reporting HOMA‑IR levels in the general Polish population.25 A Cobas PRO analyzer (Roche Diagnostics, Rotkreuz, Switzerland) was used to assess the levels of glucose via the enzymatic method with hexokinase, and a Cobas 8000 analyzer (Roche Diagnostics) was used to measure insulin levels via the electrochemiluminescence (ECLIA) method.
Statistical analysis
The χ2 test was used to analyze the differences between the qualitative variables. If the data did not fulfill the assumptions for the χ2 test, the Fisher exact test was applied. The post hoc analyses were based on the adjusted residuals with the Bonferroni correction for multiple comparisons. The Shapiro–Wilk test was performed to evaluate the distribution of the quantitative data. The Mann–Whitney test was used to analyze the non‑normally distributed data. The Levene and Brown–Forsythe tests were used to verify the homogeneity of variances in the demographic and metabolic data of the analyzed groups. For the demographic parameters that showed homogenous variances, a 1‑way analysis of variance with the Bonferroni correction for multiple comparisons was conducted. Due to the nonhomogeneous variances of the metabolic parameters, the Kruskal–Wallis test on ranks with the Bonferroni correction for multiple comparisons was performed. The Spearman analysis of correlations was used to assess the associations between the severity of FM and metabolic variables. To test the relationships between insulin resistance and the lack of response to treatment with SNRIs, we built a basal 1‑factor logistic regression model. We selected the other factors for the model based on the existing literature reporting associations between insulin resistance and depression, personality disorders, and smoking.26-30 The abovementioned factors were evaluated and the collinearity of logits was ruled out. We chose to include further covariates in the model on the condition that their introduction resulted in an increase in the likelihood of the lack of response to SNRI treatment. Mediation analysis was performed to estimate the indirect effect of BMI on resistance to treatment with SNRIs through insulin resistance as a mediator (measured by HOMA‑IR). Statistical significance required a 2‑sided P value below 0.05. The IBM SPSS software package (version 28; SPSS Inc., Chicago, Illinois, United States) was used to perform the statistical analyses. The PROCESS tool (extension to SPSS) was used to perform the mediation analysis.31
Sample size calculation
An a priori power analysis was conducted to evaluate the effect size needed to detect differences in the median HOMA‑IR levels in the analyzed groups, with at least 80% power (α <0.05). Because the data needed to calculate the effect size were not available for the general Polish population, we used data from a study on the Slovak population, which is similar to the Polish one both ethnically and socio‑economically.24,32,33 Due to the lack of epidemiological data on the levels of HOMA‑IR among Polish FM patients or individuals with FM from countries ethnically and socio‑economically similar to Poland, we used data obtained in the preliminary phase of this study for the power analysis (data were presented during the poster session of the 2021 Virtual Congress of the International Association for the Study of Pain)15. The minimal clinically relevant difference between the median values of HOMA‑IR was assumed to be 0.9. Our results showed that the minimal of number participants in each group that would allow for the detection of clinically relevant differences in the median HOMA‑IR value would be 21 HCs, 25 FM [T+] patients, and 25 FM [T–] patients.
Results
General characteristics
A total of 89 individuals took part in this study, including 30 patients in the FM [T+] group, 29 patients in the FM [T–] group, and 30 HCs. Originally, 92 consecutive FM patients were invited to participate; however, 32 were not enrolled due to the lack of consent or meeting the exclusion criteria. One other patient showed significantly increased levels of fasting glucose and was later diagnosed with diabetes; therefore, he was excluded from further analyses.
The characteristics of the study groups and the control group are displayed in Tables 1, 2, 3. There were no significant differences in the age or sex between the analyzed groups. As compared with HCs, the patients with FM had a higher BMI, and more often reported smoking and a history of trauma. The prevalence of comorbid diseases (hypertension, hyperlipidemia, asthma, allergic diseases, dermatoses, mitral valve prolapse) was similar among the HCs and patients with FM (Table 1).
Parameter | Group | P value | |
HC (n = 30) | FM (n = 59) | ||
Data are presented as number (percentage) of patients unless indicated otherwise.
Differences were considered significant at P <0.05.
a χ2 test; b t test; c Mann–Whitney test; d Fisher exact test
Abbreviations: BMI, body mass index; FM, fibromyalgia; HC, healthy controls; IQR, interquartile range | |||
Female sexa | 27 (90) | 51 (86.44) | 0.7 |
Ageb, y, mean (SD) | 43.63 (12.51) | 44.97 (11.36) | 0.62 |
BMIc, kg/m2, median (IQR) | 23.2 (20.42–26.13) | 26.77 (22.76–30.11) | 0.009 |
History of traumaa | 12 (40) | 51 (86.44) | <0.001 |
Smokingd | 1 (3.33) | 14 (23.73) | 0.02 |
Hypertensiona | 5 (16.67) | 10 (16.95) | 0.97 |
Hyperlipidemiad | 4 (13.33) | 2 (3.39) | 0.77 |
Thyroid insufficiencya | 5 (16.67) | 16 (27.11) | 0.27 |
Asthmad | 1 (3.33) | 5 (8.47) | 0.36 |
Allergic diseasesd | 1 (3.33) | 5 (8.47) | 0.33 |
Dermatosesd | 0 | 5 (8.47) | 0.34 |
Statinsd | 2 (6.66) | 1 (1.69) | 0.26 |
Hypertensive medicationa | 5 (16.67) | 10 (16.95) | 0.97 |
β-Blockersd | 4 (6.67) | 5 (8.47) | 0.48 |
L‑Thyroxinea | 5 (16.67) | 15 (25.42) | 0.35 |
Parameter | Group | P value | ||
HC (n = 30) | FM [T+] (n = 30) | FM [T–] (n = 29) | ||
Data are presented as number (percentage) of patients unless indicated otherwise.
Differences were considered significant at P <0.05.
a χ2 test; b ANOVA; c Kruskal–Wallis test; d Fisher exact test; e HC vs FM [T+];
f HC vs FM [T–]; g FM [T+] vs FM [T–]
Abbreviations: FM [T+], patients with fibromyalgia responsive to treatment with serotonin and noradrenaline reuptake inhibitors; FM [T–], patients with fibromyalgia nonresponsive to treatment with serotonin and noradrenaline reuptake inhibitors; others, see Table 1 | ||||
Female sexa | 27 (90) | 25 (83.33) | 27 (93.1) | 0.68 |
Ageb, y, mean (SD) | 43.63 (12.51) | 44.1 (12.39) | 45.86 (10.32) | 0.75 |
BMIc, kg/m2, median (IQR) | 23.2 (20.42–26.13) | 24.34 (21.71–28.38) | 29.07 (25.77–32.13) | 0.79e; <0.001f; 0.005g |
History of traumaa | 12 (40) | 26 (86.67) | 25 (86.21) | 0.06e; <0.001f; 0.09g |
Smokingd | 1 (3.33) | 3 (10) | 11 (37.93) | 0.69e; <0.001f; 0.06g |
Hypertensiond | 5 (16.67) | 3 (10) | 7 (24.14) | 0.35 |
Hyperlipidemiad | 4 (12) | 1 (3.33) | 1 (3.45) | 0.13 |
Thyroid insufficiencya | 5 (16.67) | 9 (30) | 7 (24.14) | 0.5 |
Asthmad | 1 (3.33) | 2 (6.66) | 3 (10.34) | 0.29 |
Allergic diseasesd | 1 (3.33) | 3 (10) | 2 (6.9) | 0.58 |
Dermatosesd | 0 | 1 (3.33) | 4 (13.79) | 0.48e; 0.06f; 0.09g |
Statinsd | 2 (6.66) | 0 | 1 (3.45) | 0.36 |
β-Blockersd | 4 (12) | 2 (6.66) | 3 (10.34) | 0.7 |
Hypertensive medicationd | 5 (16.67) | 3 (10) | 7 (24.14) | 0.35 |
L‑Thyroxinea | 5 (16.67) | 8 (26.67) | 7 (24.14) | 0.63 |
Parameter | Group | P value | |
FM [T+] (n = 30) | FM [T–] (n = 29) | ||
Data are presented as number (percentage) of patients unless indicated otherwise.
Differences were considered significant at P <0.05.
a Mann–Whitney test
b Fisher exact test
c χ2 test
d 57.63% of all patients with FM
e 54.24% of all patients with FM
f 47.46% of all patients with FM
| |||
FIQa, median (IQR) | 48.43 (26.99–62.77) | 60.9 (55.05–68.61) | 0.01 |
Treatment durationa, mo, median (IQR) | 8.5 (4–16.5) | 6 (3–16.5) | 0.36 |
Disease durationa, y, median (IQR) | 9.5 (5–15) | 14 (7–21.5) | 0.37 |
Duloxetineb | 26 (86.67) | 20 (68.97) | 0.21 |
Venlafaxinec | 4 (13.33) | 8 (27.57) | |
Milnacipranc | 0 | 1 (3.45) | |
NSAIDsb | 2 (6.67) | 2 (6.9) | 0.97 |
Opioidsc | 0 | 1 (3.45) | 0.49 |
Pregabalinc | 12 (40) | 17 (58.62) | 0.15 |
Depressionc,d | 11 (36.67) | 23 (79.31) | 0.001 |
Anxietyc,e | 10 (33.33) | 22 (75.86) | 0.001 |
Personality disordersc,f | 7 (23.33) | 21 (72.41) | 0.001 |
There were no differences in the mean BMI values between the HC and FM [T+] groups; however, the patients from the FM [T–] group showed higher mean BMI than those from the HC and FM [T+] groups. The groups were comparable in terms of the prevalence of hypertension, hyperlipidemia, thyroid insufficiency, asthma, allergic diseases, or dermatoses. Smoking was more prevalent among the FM [T–] patients than HCs, while there were no differences in the percentage of smokers in the FM [T+] patients vs HCs or the FM [T+] vs FM [T–] individuals (Table 2).
A greater severity of FM symptoms and their impact on functioning were observed in the FM [T–] than in the FM [T+] group. We found no difference in the percentages of patients treated with duloxetine, venlafaxine, or milnacipran as well as in the prevalence of NSAID, pregabalin, or opioid users between the FM [T+] and FM [T–] groups (Table 3).
In comparison with the FM [T+] group, the patients from the FM [T–] group significantly more often suffered from depression, anxiety, and personality disorders (Table 3).
Assessment of metabolic parameters
The results of metabolic parameter assessments are displayed in Table 4. The levels of fasting glucose (assessed as a continuous variable) were similar in all FM patients and HCs (P = 0.89), the FM [T+] patients and HCs (P = 0.2), and the FM [T–] patients and HCs (P = 0.3). The fasting glucose levels were significantly higher in the FM [T–] than in the FM [T+] patients (P = 0.002)(Figure 1A, Table 4).
Metabolic variables | Group | |||
HC (n = 30) | FM [T+] (n = 30) | FM [T–] (n = 29) | FM (n = 59) | |
Data are presented as number (percentage) of patients unless indicated otherwise.
a Fasting insulin level ≥15 µU/ml
b Fasting glucose level ≥5.6 mmol/l
c HOMA‑IR >2.1
| ||||
Fasting glucose, mmol/l, median (IQR) | 5.2 (4.85–5.37) | 4.8 (4.51–5.33) | 5.34 (5.08–5.52) | 5.15 (4.72–5.41) |
Insulin, µU/mmol, mean (SD) | 6.81 (2.42) | 7.5 (2.56) | 12.41 (3.24) | 9.91 (3.8) |
HOMA‑IR, mean (SD) | 1.55 (0.52) | 1.63 (0.63) | 2.94 (0.81) | 2.28 (0.97) |
Increased fasting insulina | 0 | 0 | 6 (20.69) | 6 (10.17) |
Increased fasting glucoseb | 4 (13.33) | 2 (3.67) | 6 (20.69) | 8 (13.56) |
Insulin resistancec | 4 (13.33) | 9 (30) | 25 (86.21) | 34 (57.63) |
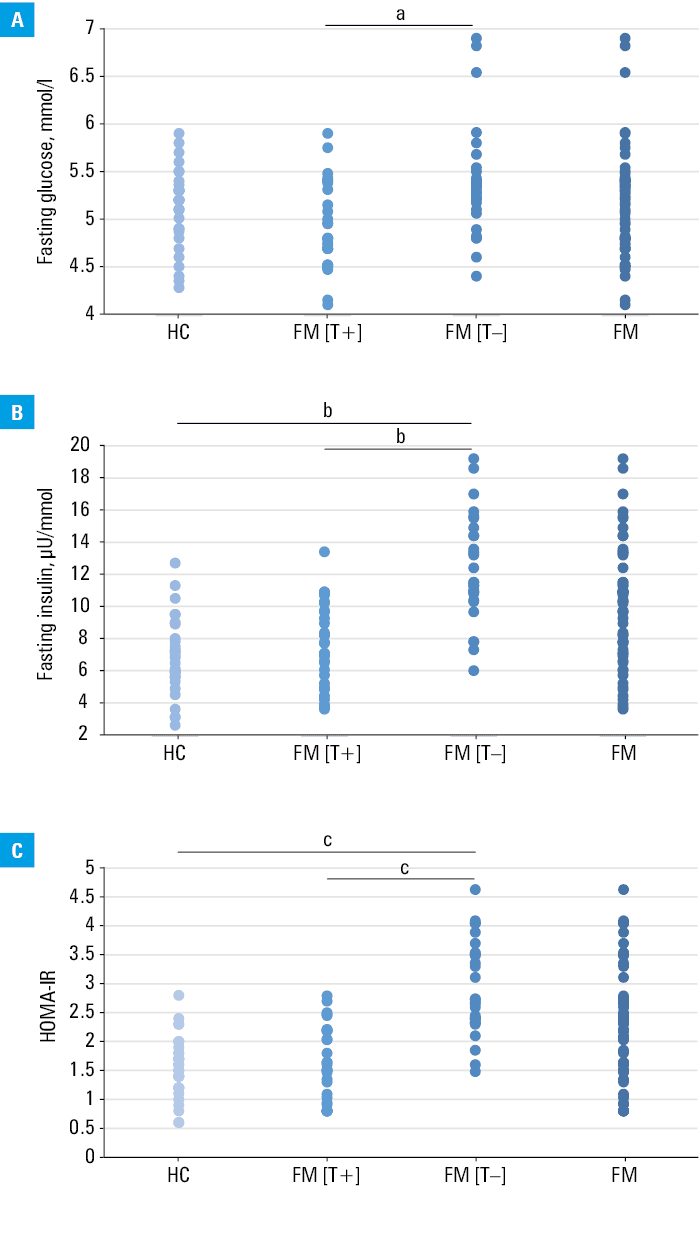
The insulin levels (assessed as a continuous variable) were significantly higher in the patients with FM assessed as a whole (P <0.001) and in the FM [T–] patients (P <0.001), as compared with HCs; however, there were no differences in the insulin levels between the FM [T+] patients and HCs (P >0.99). The FM [T–] patients showed significantly higher insulin levels than the individuals from the FM [T+] group (P <0.001) (Figure 1B, Table 4).
The HOMA‑IR values (assessed as a continuous variable) were significantly higher in the participants with FM than in HCs (P <0.001). No differences in the HOMA‑IR values were noted between the FM [T+] patients and HCs (P >0.99). The patients from the FM [T–] group showed significantly higher HOMA‑IR levels than both HCs (P< 0.001) and the FM [T+] patients (P <0.001) (Figure 1C, Table 4). Similarly, the whole FM group showed higher prevalence of increased insulin resistance (assessed as a dichotomous variable) than HCs (P <0.001). The FM [T–] patients showed increased insulin resistance more often than HCs (P <0.001) or the FM [T+] patients (P <0.001); however, there were no differences in the prevalence of insulin resistance between the FM [T+] and the HC group (P = 0.21) (Table 4). No differences were found among all analyzed groups in the prevalence of increased fasting glucose (assessed as a dichotomous variable) (P = 0.27). The elevated levels of insulin were equally prevalent in the total FM group as in HCs (P = 0.09), there was also no difference between the FM [T+] patients and HCs (P = 0.67). The increased fasting insulin level (assessed as a dichotomous variable) was significantly more common among the FM [T–] patients than the FM [T+] individuals (P <0.001) or HCs (P <0.001) (Table 4).
Associations between the severity of fibromyalgia and metabolic parameters
The Spearman analysis of correlations was performed to assess the relationships between the FIQ sum, FIQ subdomains (physical functioning, well‑being, work‑related, pain, fatigue / sleep, stiffness, psychological symptoms), WPI, SSS, FS, and the metabolic parameters (fasting glucose, fasting insulin, HOMA‑IR). When all patients with FM were assessed as a single group, week correlations between the FIQ psychological symptoms subdomain and fasting glucose (Rs = 0.29, P = 0.04), fasting insulin (Rs= 0.28, P = 0.03), as well as HOMA‑IR (Rs = 0.29, P = 0.03) were noted. FIQ work‑related subdomain moderately correlated with BMI (Rs = 0.36, P = 0.005). SSS weakly correlated with the fasting insulin levels (Rs = 0.32, P = 0.01), HOMA‑IR (Rs = 0.28, P = 0.03), and BMI (rs = 0.33, P = 0.01). The analysis performed separately for the FM [T+] and FM [T–] patients revealed that in the FM [T+] group FIQ work‑related (Rs = 0.49, P = 0.006) and pain (Rs = 0.41, P = 0.03) subdomains moderately correlated with BMI. In the FM [T–] group, the FIQ stiffness subdomain moderately correlated with BMI (Rs = 0.52, P = 0.004). No other significant correlations were found.
Associations between insulin resistance and the lack of response to treatment with serotonin and noradrenaline reuptake inhibitors
A logistic regression model was built to explore the relationship between the lack of response to treatment with SNRIs and insulin resistance (HOMA‑IR), BMI, age, depression, anxiety, personality disorders, and smoking. The basal model consisted of insulin resistance and showed good predictive power for the lack of response to SNRI treatment (P <0.001). Further analyses were conducted to test the influence of other biologically plausible covariates. BMI, age, and smoking did not significantly influence the basal model. The model that best fit the data included HOMA‑IR and anxiety (P <0.001). It demonstrated a higher predictive power than the basal model (Nagelkerke R2 = 0.76 vs Nagelkerke R2 = 0.6). The increase in the likelihood of the lack of response to treatment with SNRIs due to anxiety (odds ratio [OR], 27.73; 95% CI, 3.28–234.11) was comparable to the risk associated with the HOMA‑IR value (OR, 27.32; 95% CI, 4.72–157.7; P <0.001). Two other models consisting of 1) HOMA‑IR and depression and 2) HOMA‑IR and personality disorders showed higher predictive power than the basal model (Nagelkerke R2 = 0.67 vs Nagelkerke R2 = 0.6 and Nagelkerke R2 = 0.67 vs Nagelkerke R2 = 0.6, respectively). The increased likelihood of the lack of response to treatment with SNRIs due to HOMA‑IR was higher than the risk due to depression (OR, 20.35 vs OR, 7.3) or personality disorders (OR, 13.75 vs OR, 6.23) (Supplementary material, Table S1). Complete separation of the variables was excluded. Analysis of residuals was performed, and no outliers or influential cases were detected.
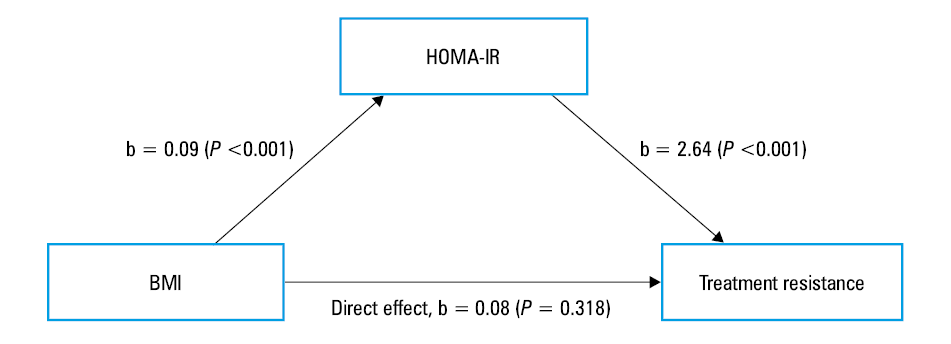
Mediation analysis was used to estimate the indirect effects. We wanted to determine the extent to which the association between BMI and resistance to treatment with SNRIs was mediated by insulin resistance in the patients with FM. The diagram of the mediation analysis (Figure 2) shows that after inclusion of the mediator (HOMA‑IR), the direct effect of BMI on resistance to treatment is no longer significant. There was a significant indirect effect of BMI on resistance to treatment with SNRIs through HOMA‑IR (b = 0.242, 95% BCa CI, 0.106–0.644).
Discussion
To the best of our knowledge, this is the first study to assess patients with FM not only as a whole but also divided according to their response to SNRI treatment, and to compare both the total FM group and the subgroups with HCs. Previous studies examined the patients with FM as a homogenous group fulfilling the diagnostic criteria6-8; however, based on significant clinical differences between the FM patients, we decided to separately analyze the FM patients who responded to SNRI treatment and those who did not. Due to the abovementioned methodology, our study is the first to reveal that insulin resistance is linked to the lack of response to SNRIs in FM. Interestingly, our results indicate that the metabolic abnormalities previously reported in FM, that is, increased fasting glucose levels,6 higher BMI,8 and insulin resistance measured with HOMA‑IR7 were only observed in the subgroup of FM [T–] patients. Individuals from the FM [T+] subgroup did not significantly differ from HCs with respect to BMI or insulin resistance. What is more, in contrast with the results reported by Kim et al,6 fasting glucose levels of the FM [T+] patients were lower than those of HCs. We also noted several significant differences between the FM subgroups: 1) higher BMI in the FM [T–] vs the FM [T+] group, 2) higher fasting insulin level in the FM [T–] vs the FM [T+] group, and 3) higher prevalence of comorbid depression, anxiety, and personality disorders among the FM [T–] vs the FM [T+] patients. These differences may facilitate the possibility to define a unique phenotype of FM patients nonresponsive to SNRI therapy. A logistic regression model revealed that HOMA‑IR was a significant predictor of the lack of response to SNRI treatment. Further analyses also highlighted the significance of depression, anxiety, and personality disorders. The model consisting of HOMA‑IR combined with anxiety showed the highest power in predicting the lack of response to SNRI treatment. Zetterman et al8 stated that patients with FM displayed alterations in glucose metabolism as compared with HCs, and that these alterations were due to their higher BMI and smoking rate. However, in the present work, we observed that the relationship between BMI and the lack of response to treatment with SNRIs was fully mediated by the level of insulin resistance (HOMA‑IR), which highlights the importance of impaired glucose metabolism in the lack of response to SNRIs in FM. The relationship between the lack of response to SNRI treatment in FM and insulin resistance might be of growing importance in the context of the Polish population. A recent study showed that the prevalence of impaired carbohydrate metabolism in Poles (elevated fasting glucose level or diabetes) has risen from 13.4% to 22.1% in women and from 18.9% to 34.9% in men.34
It is known that monoaminergic transmission in the central nervous system is impaired in FM,35-37 and that SNRIs most likely exert their analgesic effect through the potentiation of the serotonin- and noradrenaline‑dependent descending neuronal pathways.38,39 However, our results suggest that there are other pathologies in pain processing in the subgroup of FM [T–] patients, which are related to insulin resistance. The literature data describe several possible mechanisms explaining the links between impaired insulin signaling and pain processing. García et al40 reported results of an animal study indicating that despite normoglycemia, insulin resistance was linked to nociceptive hypersensitivity. They showed that fructose‑induced hyperinsulinemia was linked to neuropathic pain through 1) modulation of γ-aminobutyric acid A receptors, which regulate pain inhibitory pathways, 2) increased representation of acid‑sensing ion channels 3, which stimulate nociceptors in response to changing pH, and 3) reduction of TWIK‑related acid sensitive K+ channel expression and increase in the expression of anoctamin‑1 channels, both of which lead to neuronal hyperexcitability.40 Furthermore, insulin receptors, together with transient receptor potential vanilloid 1 (TRPV1) channels, are present on the dorsal root ganglia and peripheral neurons, and both of them act in a synergistic manner. In an in vitro study, Hotta et al41 described the pain‑sensitizing role of insulin via the decrease of the TRPV1 activation threshold. Similarly, Rosta et al41 reported that insulin stimulated the TRPV1 receptors in animal studies.42
In our study, the overall comparison between the FM patients and HCs revealed a higher mean BMI, as well as a higher prevalence of trauma history and smoking in the former group. The patients with FM were also characterized by a higher median fasting insulin and HOMA‑IR values than HCs, and they manifested insulin resistance (HOMA‑IR >2.1) and hyperinsulinemia more often than the control group. We also observed a seemingly high burden of psychiatric comorbidities among the FM patients, of which 57.63% were diagnosed with depression, 54.24% with anxiety, and 47.46% with personality disorders. Our results are comparable to those of Hauser et al,13 who reported a greater prevalence of trauma history and depression in the FM patients, as compared with the general population.13 In line with the available literature, we noted a much higher occurrence of personality disorders among the FM patients than among HCs.14 A comparison between the FM [T+] and the FM [T–] patients showed that the latter were significantly more often suffering from depression, anxiety, and personality disorders, and reported a greater severity of FM symptoms and a greater impact of the disease on their functioning.
Our work should be seen in the context of its limitations. The study was adequately powered to detect significant differences in the HOMA‑IR values; however, these results should be considered preliminary since the study group was relatively small. This was a cross‑sectional study, and in accordance with its design, it only allows for the exploration of associations and not causality. No assessment of metabolic parameters and the psychiatric state of the patients were conducted prior to the enrolment. Furthermore, all participants were recruited from among the Polish population, and the results need to be replicated in further studies.
In conclusion, the results showed that the FM [T+] and FM [T–] patients are heterogenous in terms of their clinical presentation, metabolic status, and prevalence of psychiatric comorbidities. In contrast with the previously published data,7 our work shows that insulin resistance is not characteristic of all patients with FM but only of the FM subgroup resistant to SNRI treatment. We hypothesize that the FM [T–] patients are burdened with distinct or added pathophysiological mechanisms associated with insulin signaling. We believe that instead of analyzing the patients with FM as a homogenous group, further research should rather include subgroups of patients whose clinical and physiologic characteristics are similar. Logistic regression analysis showed that insulin resistance, depression, anxiety, and personality disorders were the predictors of the lack of response to SNRI treatment in FM. Given the high variability of HOMA‑IR among populations that vary ethnically and socio‑economically, these results need to be replicated in other populations. Clinical assessment of and care for the patients with FM should also focus on their mental health, since depression, anxiety, and personality disorders are fairly prevalent in this group of patients and predict the lack of response to SNRI treatment.
- Cabo‑Meseguer A, Cerdá-Olmedo G, Trillo‑Mata JL. Fibromyalgia: prevalence, epidemiologic profiles and economic costs. Med Clin (Barc). 2017; 149: 441‑448. | Crossref
- Häuser W, Sarzi‑Puttini P, Fitzcharles M. Fibromyalgia syndrome: under-, over- and misdiagnosis. Clin Exp Rheumatol. 2019; 37 (Suppl 116): 90‑97.
- Chinn S, Caldwell W, Gritsenko K. Fibromyalgia pathogenesis and treatment options update. Curr Pain Headache Rep. 2016; 20: 1‑10. | Crossref
- Rus A, Robles‑Fernandez I, Martinez‑Gonzalez LJ, et al. Influence of oxidative stress‑related genes on susceptibility to fibromyalgia. Nursing Research. 2021; 70: 44‑50. | Crossref
- Caumo W, Hidalgo MP, Souza A, et al. Melatonin is a biomarker of circadian dysregulation and is correlated with major depression and fibromyalgia symptom severity. J Pain Res. 2019; 12: 545‑556. | Crossref
SUPPLEMENTARY MATERIAL
ARTICLE INFORMATION