New insights into diversity of the upper respiratory tract microbiota and its relationship with SARS-CoV-2 viral load in the nasopharyngeal epithelial cells in patients with COVID-19
Key words: COVID-19, nasopharynx, next generation sequencing, SARS-CoV-2, upper respiratory tract microbiota


 CC BY-NC-SA 4.0
New insights into diversity of the upper respiratory tract microbiota and its relationship with SARS-CoV-2 viral load in the nasopharyngeal epithelial cells in patients with COVID-19
Introduction: The effects of SARS‑CoV‑2 infection on the composition of the upper respiratory tract microbiota are yet to be established, and more attention to this topic is needed.
Objectives: The study aimed to assess the bacterial profile and the possible association between the URT microbiota composition and the SARS‑CoV‑2 viral load.
Patients and methods: Nasopharyngeal swabs were taken from 60 adult patients with SARS‑CoV‑2 infection who were divided into 3 groups based on the quantification cycle (Cq) value in the quantitative polymerase chain reaction test: group I (n = 20), Cq lower than or equal to 31 (high replication rate); group II (n = 20), Cq greater than 31 and lower than 38 (low replication rate), and group III (n = 20), Cq higher than or equal to 38 (virus eliminated from the nasopharyngeal epithelial cells). The obtained genetic libraries of 16S rRNA were sequenced and taxonomic diversity profiling was performed to determine the α- and β-biodiversity in each group.
Results: A significantly lower abundance of Prevotella species was noted in group I, as compared with groups II and III. Akkermansia muciniphila, Faecalibacterium prausnitzii, Fusicatenibacterium saccharivorans, and Bacteroides dorei abundance was characteristic of and significantly greater in group I than in groups II and III. Overall, the microbiota composition was the most diverse in group I, whereas groups II and III were more homogenous in terms of taxonomic diversity.
Conclusions: The arbitrary division of patients according to the SARS‑CoV‑2 viral load was reflected in diverse composition of their bacterial microbiota, which implies an association between these 2 factors. The patients with a low viral replication rate and those who eliminated the virus from the epithelial cells belonged to a group with a less diverse microbiota community than the patients with a high viral replication rate.
What's new?
SARS‑CoV‑2 viral load kinetics and duration of SARS‑CoV‑2 viral elimination are important determinants of COVID‑19 transmission and its transmissibility. In this study, we characterized the viral load dynamics and its relationship with nasopharyngeal bacterial microbiota composition in 3 cohorts of patients, classified according to the viral load in the nasopharyngeal epithelial cells. Our study provides important insight into the associations between nasopharyngeal microbiota composition and viral load. The patients were divided according to the qualitative and semiquantitative differences in the composition of bacterial microbiota. The patients with low SARS‑CoV‑2 replication rate and those who eliminated the virus from the epithelial cells formed a group with less diverse microbiota. Broadening the knowledge on the microbiota composition and the interactions between the microbiota and their metabolites influencing the SARS‑CoV‑2 infection might be useful for implementation of a more individualized care, which may improve patient prognosis.
Introduction
The composition of human microbiota has been studied for many years. Implementation of the next generation sequencing (NGS) in research on the human microbiome made it possible to obtain more accurate and detailed information than before, when classic microbiologic methods based on bacterial culture had been used.1 To date, the best‑known and the most widely investigated niche of the human body, both in a healthy state and in the course of various diseases (eg, type 2 diabetes mellitus, inflammatory bowel disease, and obesity) is the microbiota of the gastrointestinal (GI) tract.2-6
Until now, the microbiota of other human body niches, such as the upper respiratory tract (URT), have been less widely investigated. Nevertheless, recent studies have shown that in healthy individuals, the URT microbiota protects the mucosal surface from pathogens and plays an immunomodulating role.7,8 However, the association between microbiota composition, viruses, and host physiology is complex and should be examined. Some studies claim the URT commensal microbiota could be altered or undergo dysbiosis by pathogenic respiratory viruses, resulting in higher susceptibility of the host to respiratory infections.9,10 Variation in the microbiome structure and function impacts antiviral immunity. To date, only changes in the URT microbiota in the course of influenza have been described.11
The effects of SARS‑CoV‑2 infection on the human URT and GI microbiota have been thoroughly studied.12,13 Nevertheless, the exact changes that occur in the URT microbiota composition during COVID‑19 are still unknown, and more attention to this topic is needed.14
Determining the composition of a patient’s microbiota and its interactions with the virus may help estimate the risk of severe COVID‑19. Detecting indicator bacteria accompanying a severe SARS‑CoV‑2 infection could be of diagnostic importance and result in implementation of a more personalized therapy. The rate of viral replication in the epithelial cells of the URT varies and depends on the immune status of the patient and the functionality of the nasopharynx‑associated lymphoid tissue,15 which has been shown to be influenced by the microbiota.16
The study aimed to assess the bacterial taxonomic profile of the URT microbiota, and its possible association with the SARS‑CoV‑2 viral load in the nasopharyngeal epithelial cells.
Patients and methods
Patients
The main inclusion criterion for the study was a clinical diagnosis of COVID‑19. A total of 60 adult patients (age range, 18–70 years) were subjected to testing procedures (based on the result of the quantitative polymerase chain reaction [qPCR] test, with a clinical course requiring hospitalization) from January to March 2021 at the University Hospital in Kraków, Poland. The samples were taken from the patients immediately after admission to the hospital and before the initiation of any pharmacologic treatment, including antibiotic therapy. Informed consent was obtained from all participants involved in the study.
Samples and nucleic acid isolation
Samples for qPCR diagnostics were collected following the guidelines of the European Centre for Disease Prevention and Control.17 Afterward, the samples were placed in a NUCLISWAB standard transport medium (Innovative Biotechnology Organization Ltd., Istanbul, Turkey) and delivered deeply frozen to the Department of Molecular Medical Microbiology, Division of Microbiology, Jagiellonian University Medical College, where they were kept at –80 °C until nucleic acid extraction. Before the microbiological analysis, all samples were thawed and shaken vigorously in 1 ml of sterile distilled water. Next, 400 µl of the solution were used for RNA isolation to detect SARS‑CoV‑2, and the same volume was used for microbial DNA isolation for microbiota assessment by NGS using an automated nucleic acid extraction instrument CroBEE (GeneProof, Brno, Czech Republic). For DNA analysis, 20 µl of lysozyme (50 mg/ml; Sigma‑Aldrich, Saint Louis, Missouri, United States), 15 µl of lysostaphin (1 mg/ml; A&A Biotechnology, Gdańsk, Poland), and 5 µl of mutanolisin (10 U/µl; Sigma‑Aldrich) were added to each sample as part of the preisolation protocol. Next, the samples were vortexed, homogenized in FastPrep FP 120 (MPBiomedicals, Milford, Massachusetts, United States) (60 s, 4.5 m/s), and incubated for 30 minutes at 37 °C in a thermoblock (Eppendorf, Hamburg, Germany).5
Quantitative polymerase chain reaction for SARS‑CoV‑2 detection
After isolation, the obtained RNA isolates were amplified by qPCR (CFX96 thermocycler, BioRad, Hercules, California, United States) using the Vitassay qPCR SARS‑CoV‑2 kit (Vitassay Healthcare S.L.U., Huesca, Spain) according to the manufacturer’s protocol. The qPCR results were interpreted based on the quantification cycle (Cq) threshold values. The Cq threshold value of a reaction is defined as the cycle number by which the fluorescence of a PCR product can be detected above the background signal. Depending on the Cq value, the tested samples were assigned into 1 of 3 arbitrarily established groups: group I (n = 20), Cq lower than or equal to 31 (high replication rate), group II (n = 20), Cq greater than 31 and lower than 38 (low replication rate), and group III (n = 20), Cq higher than or equal to 38 (virus eliminated from the body).
16S rRNA next generation sequencing
After extraction, the isolates of bacterial DNA were amplified by PCR (the V3–V4 region of the 16S rRNA subunit was strengthened). The obtained amplicons were used to prepare a genomic library for NGS sequencing in the MiSeq sequencer (Illumina, San Diego, California, United States) according to the Illumina protocol described by Sroka‑Oleksiak et al5 and Salamon et al.18
Bioinformatics and statistical analysis
The α- and β-biodiversity
The taxonomic diversity profiling was performed at 6 taxonomic levels (phylum [L2], class [L3], order [L4], family [L5], genus [L6], and species [L7]), according to the appropriate annotations. The α-diversity was established based on the common diversity indices: Observed, ACE, Chao1, Shannon, Simpson, and Fisher. The t test was used to compare the α-diversity between the groups. The standard t test was also applied to compare the abundance profiles at different taxonomic levels between the study groups. Statistical significance was assessed using either a parametric (2‑sample t test) or a nonparametric test (Wilcoxon rank‑sum test). The nonparametric test was used to identify significant differences in operational taxonomic units (OTUs), and differences in relative abundance at different taxonomic levels. The β-diversity was established using 3 common distance measures (Bray–Curtis, Jensen–Shannon, and Jaccard). The results for each group at the 6 analyzed taxonomic levels were illustrated by means of 2‑dimensional ordination plots based on the principal coordinate analysis. The corresponding statistical significance was assessed based on the permutational multivariate analysis of variance (PERMANOVA) method. PERMANOVA was used to analyze both inter- and intragroup β-diversity.
Nonparametric tests, such as the Kruskal–Wallis rank‑sum test, Wilcoxon rank‑sum test, and linear discriminant analysis, were used to detect differences between the abundance of particular taxonomic units, and to estimate the effect size for each detected bacterial indicator. In all statistical analyses, the P value below 0.05 was assumed to validate the study hypothesis.
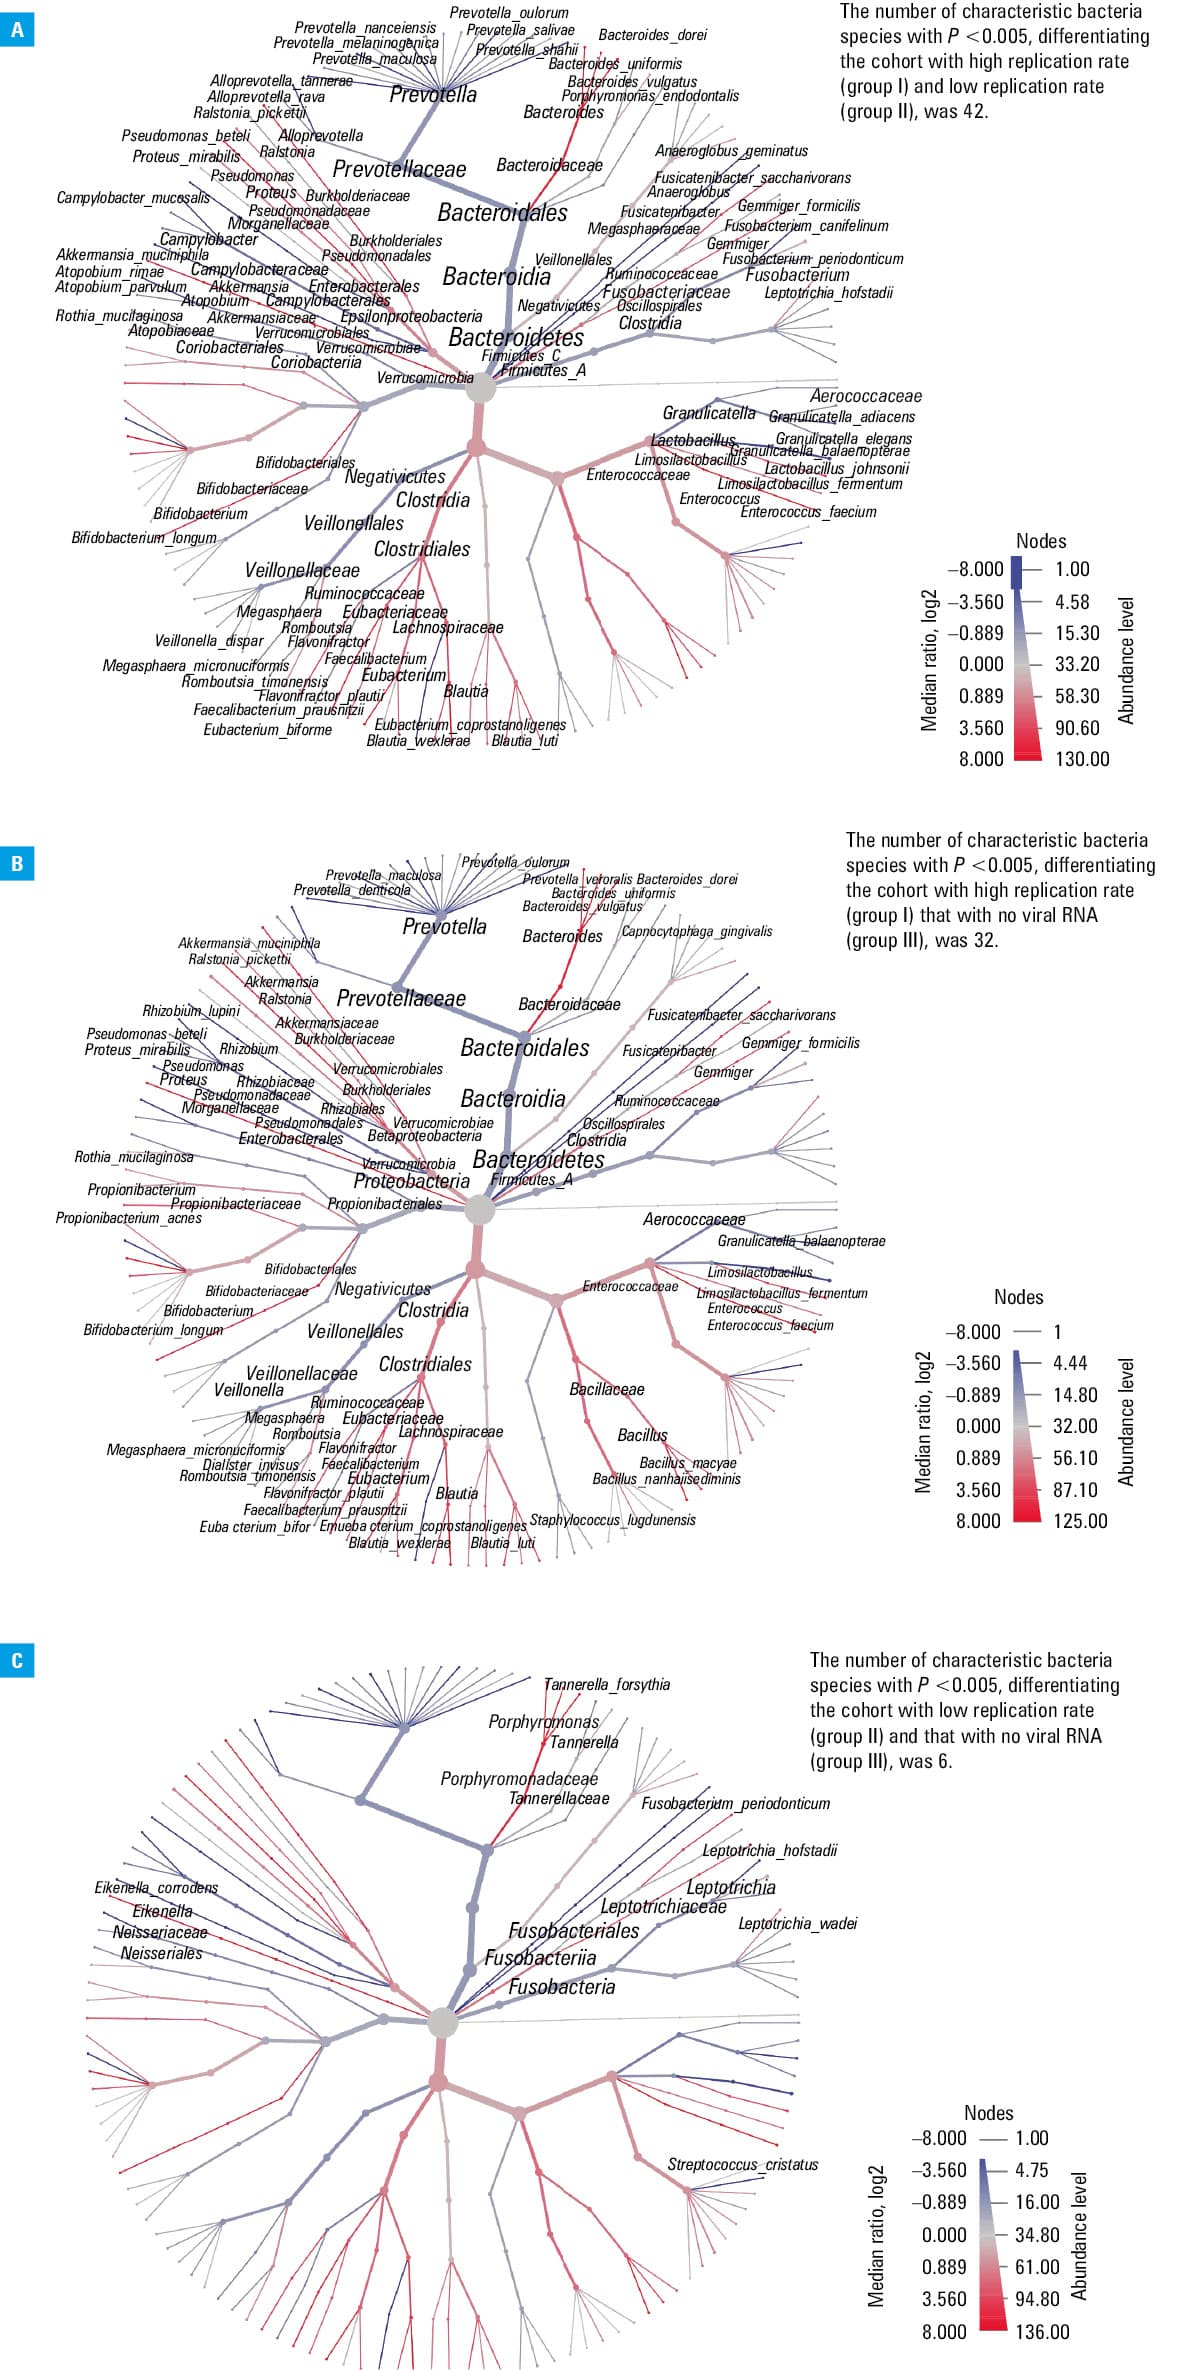
Heat tree analysis
A heat tree analysis was performed based on the hierarchical structure of taxonomic classifications to depict significant taxonomic differences (using the nonparametric Wilcoxon rank‑sum test) between microbial communities in the groups stratified according to SARS‑CoV‑2 viral load. The heat trees (Figure 1) that were built for each intergroup comparison visualize the taxonomic hierarchy and show the distribution of parameters throughout the tree. The terminal nodes correspond to the bacterial species. Taxa are represented as nodes, whereas colors and sizes are used to depict parameters associated with taxa, such as abundance.
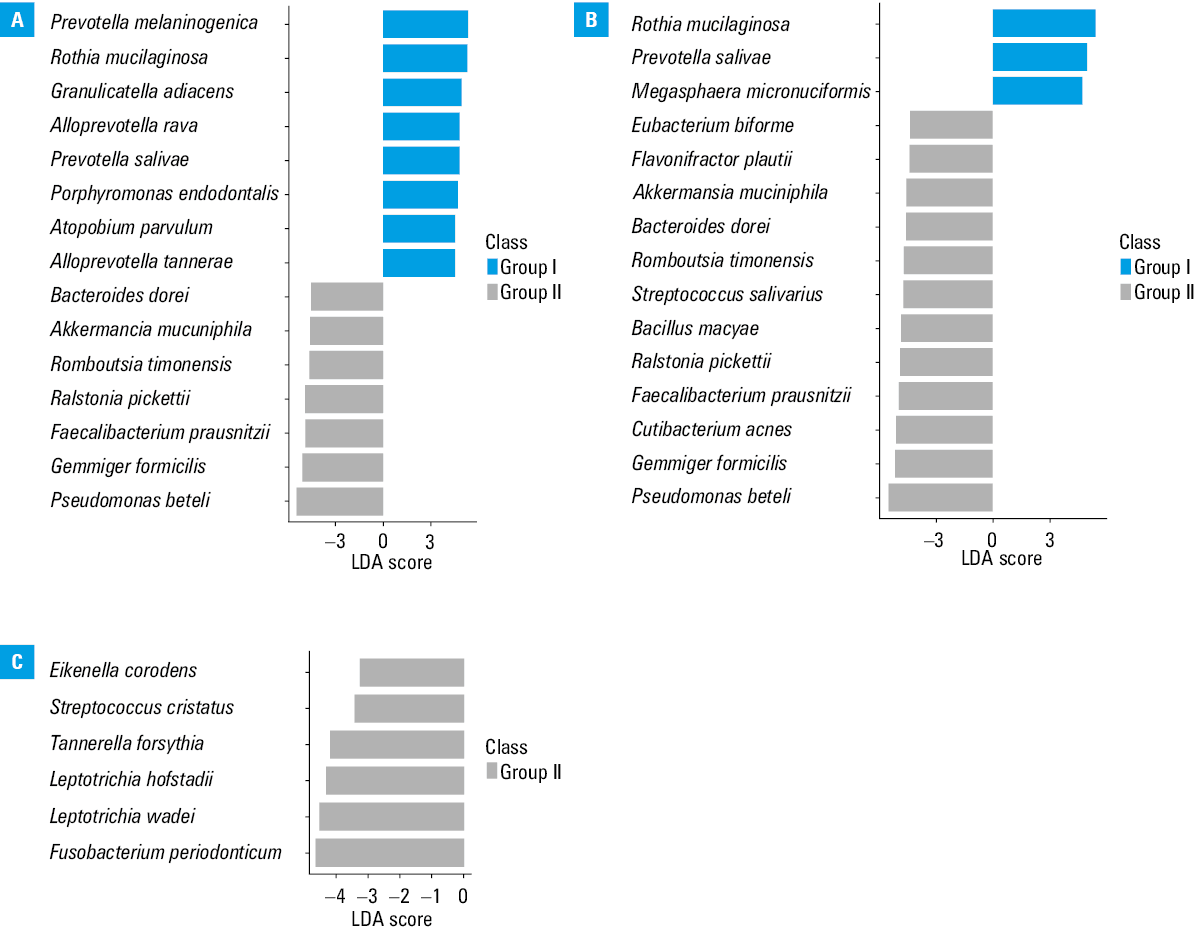
Linear discriminant analysis effect size method
A high‑dimensional class comparison was performed using the linear discriminant analysis (LDA) effect size (LEfSe) method. This method was used to determine the functional features and explain the differences between the study groups. Each identified feature was represented by a positive‑value vector expressed as the abundance in the samples. Each sample was associated with values describing its group. The factorial Kruskal–Wallis rank‑sum test was applied to each feature that was discriminative for each group. According to the Kruskal–Wallis rank‑sum test, all features that did not violate the null hypothesis of identical value distribution among the groups (with a default P value of 0.05) were excluded from further analysis. Only the features with P values below 0.05 underwent further examination. Next, the pairwise Wilcoxon test was used to distinguish the discriminative features of the study groups. Only the features that passed the pairwise Wilcoxon test were considered functional indicators. In the next step of the analysis, an LDA model was built with class as the dependent variable. The LDA score for each indicator was calculated using the logarithm base 10 of this value after being scaled in the interval and regardless of the absolute values of the LDA score. The results were visualized as histograms of LDA logarithmic scores.
Statistical analysis was performed using the STATISTICA v13 package (Tulsa, Oklahoma, United States).
Ethics
The study was approved by the Jagiellonian University Ethical Committee (1072.6120.333.2020 of December 7, 2020). All participants provided their written informed consent for examination.
Results
Characteristics of the study participants
A total of 60 adult patients (median age, 62.9 years; 66.6% men) were included in the study. In each study group, there were more men than women (men‑to‑women ratios of 13:7, 16:4, and 11:9 in groups I, II, and III, respectively). In addition, the groups differed with respect to age—the median (min–max) age was 65.1 (45–81) years in group I, 62.2 (32–86) years in group II, and 61.6 (35–83) years in group III.
Taxonomic and biodiversity analysis
Briefly, NGS sequencing of 60 nasopharyngeal swabs gave a total of 941 803 reads, with an average of 15 696 reads per sample. The minimum number of reads per sample was 771, and the maximum was 81 110. No sample was excluded from the final analysis.
The α- and β-biodiversity
The α-diversity was the highest when assessed using the Observed and Fisher indices, and these differences were significant for OTU taxonomic levels L5 (family) and L6 (genus) for all groups (Table 1). The β-diversity assessed using the Bray–Curtis, Jaccard, and Jensen–Shannon indices presented a significantly higher distance between OTUs on taxonomic levels L5, L6, and L7 in all groups (Table 2).
Taxonomic level | P values for α-diversity metrics (group I vs group II vs group III) | |||||
Observed | ACE | Chao1 | Shannon | Simpson | Fisher | |
The significance level was set at P <0.05.
a Group I, high replication rate; group II, low replication rate; group III, no viral RNA | ||||||
L2 (phylum) | 0.24 | 0.71 | 0.3 | 0.33 | 0.4 | 0.18 |
L3 (class) | 0.3 | 0.76 | 0.45 | 0.22 | 0.48 | 0.28 |
L4 (order) | 0.49 | 0.62 | 0.36 | 0.15 | 0.4 | 0.13 |
L5 (family) | 0.008 | 0.8 | 0.85 | 0.6 | 0.17 | 0.01 |
L6 (genus) | 0.009 | 0.5 | 0.34 | 0.07 | 0.15 | 0.007 |
L7 (species) | 0.7 | 0.75 | 0.94 | 0.8 | 0.18 | 0.08 |
Taxonomic level | β-Diversity indices (group I vs group II vs group III) | ||||||||
Bray–Curtis | Jensen–Shannon | Jaccard | |||||||
F | R2 | P value | F | R2 | P value | F | R2 | P value | |
The significance level was set at P <0.05.
a Group I, high replication rate; group II, low replication rate; group III, no viral RNA
Abbreviations: F, variation within samples; R2, measurement of the proportion of variation in the dependent variable that can be attributed to the independent variable | |||||||||
L2 (phylum) | 2.0887 | 0.068282 | 0.06 | 3.33 | 0.10462 | 0.03 | 1.7937 | 0.059209 | 0.07 |
L3 (class) | 1.6566 | 0.054932 | 0.1 | 2.5742 | 0.082842 | 0.05 | 1.5385 | 0.051219 | 0.1 |
L4 (order) | 1.6821 | 0.055732 | 0.1 | 2.0974 | 0.068548 | 0.09 | 1.5463 | 0.051465 | 0.08 |
L5 (family) | 2.0557 | 0.067277 | 0.04 | 2.7023 | 0.086605 | 0.04 | 1.752 | 0.057912 | 0.03 |
L6 (genus) | 2.0577 | 0.067339 | 0.04 | 2.6852 | 0.086105 | 0.03 | 1.7452 | 0.057701 | 0.03 |
L7 (species) | 1.7924 | 0.059171 | 0.02 | 2.3315 | 0.075622 | 0.01 | 1.499 | 0.049969 | 0.02 |
Since there were significant differences between the 3 groups at the family level (L5), we performed an additional analysis concerning β-diversity, comparing differences between the pairs of groups individually from the family level (L5) to the species level (L7) (Tables 3 and 4).
Taxonomic level | β-Diversity indices (group I vs group II) | ||||||||
Bray–Curtis | Jensen–Shannon | Jaccard | |||||||
F | R2 | P value | F | R2 | P value | F | R2 | P value | |
The significance level was set at P <0.05.
a Group I, high replication rate; group II, low replication rate
Abbreviations: see Table 2 | |||||||||
L5 (family) | 2.4287 | 0.060073 | 0.03 | 3.4262 | 0.082706 | 0.02 | 2.0332 | 0.050787 | 0.03 |
L6 (genus) | 2.4333 | 0.060181 | 0.03 | 3.3882 | 0.081864 | 0.02 | 2.022 | 0.050521 | 0.03 |
L7 (species) | 1.9032 | 0.047694 | 0.03 | 2.6055 | 0.064166 | 0.02 | 1.5858 | 0.040059 | 0.03 |
Taxonomic level | β-Diversity indices (group I vs group III) | ||||||||
Bray–Curtis | Jensen–Shannon | Jaccard | |||||||
F | R2 | P value | F | R2 | P value | F | R2 | P value | |
The significance level was set at P <0.05.
a Group I, high replication rate; group III, no viral RNA
Abbreviations: see Table 2 | |||||||||
L5 (family) | 2.9429 | 0.071879 | 0.01 | 3.8748 | 0.092533 | 0.01 | 2.3948 | 0.059285 | 0.01 |
L6 (genus) | 2.9672 | 0.072428 | 0.01 | 3.9236 | 0.093589 | 0.01 | 2.3882 | 0.059131 | 0.01 |
L7 (species) | 2.3514 | 0.058274 | 0.006 | 3.222 | 0.078162 | 0.006 | 1.8317 | 0.045987 | 0.007 |
Due to the large amount of data, only significant differences are presented in this paper. Our analysis showed significant differences concerning β-diversity at all taxonomic levels for groups I vs II (Table 3) and II vs III (Table 4), but not for group I vs III. With respect to α-diversity, significant differences were found at taxonomic levels L5 (family) and L6 (genus) when comparing all 3 groups together (group I vs group II vs group III; Table 1) for the Observed and Fisher indices only.
The taxonomic composition analysis
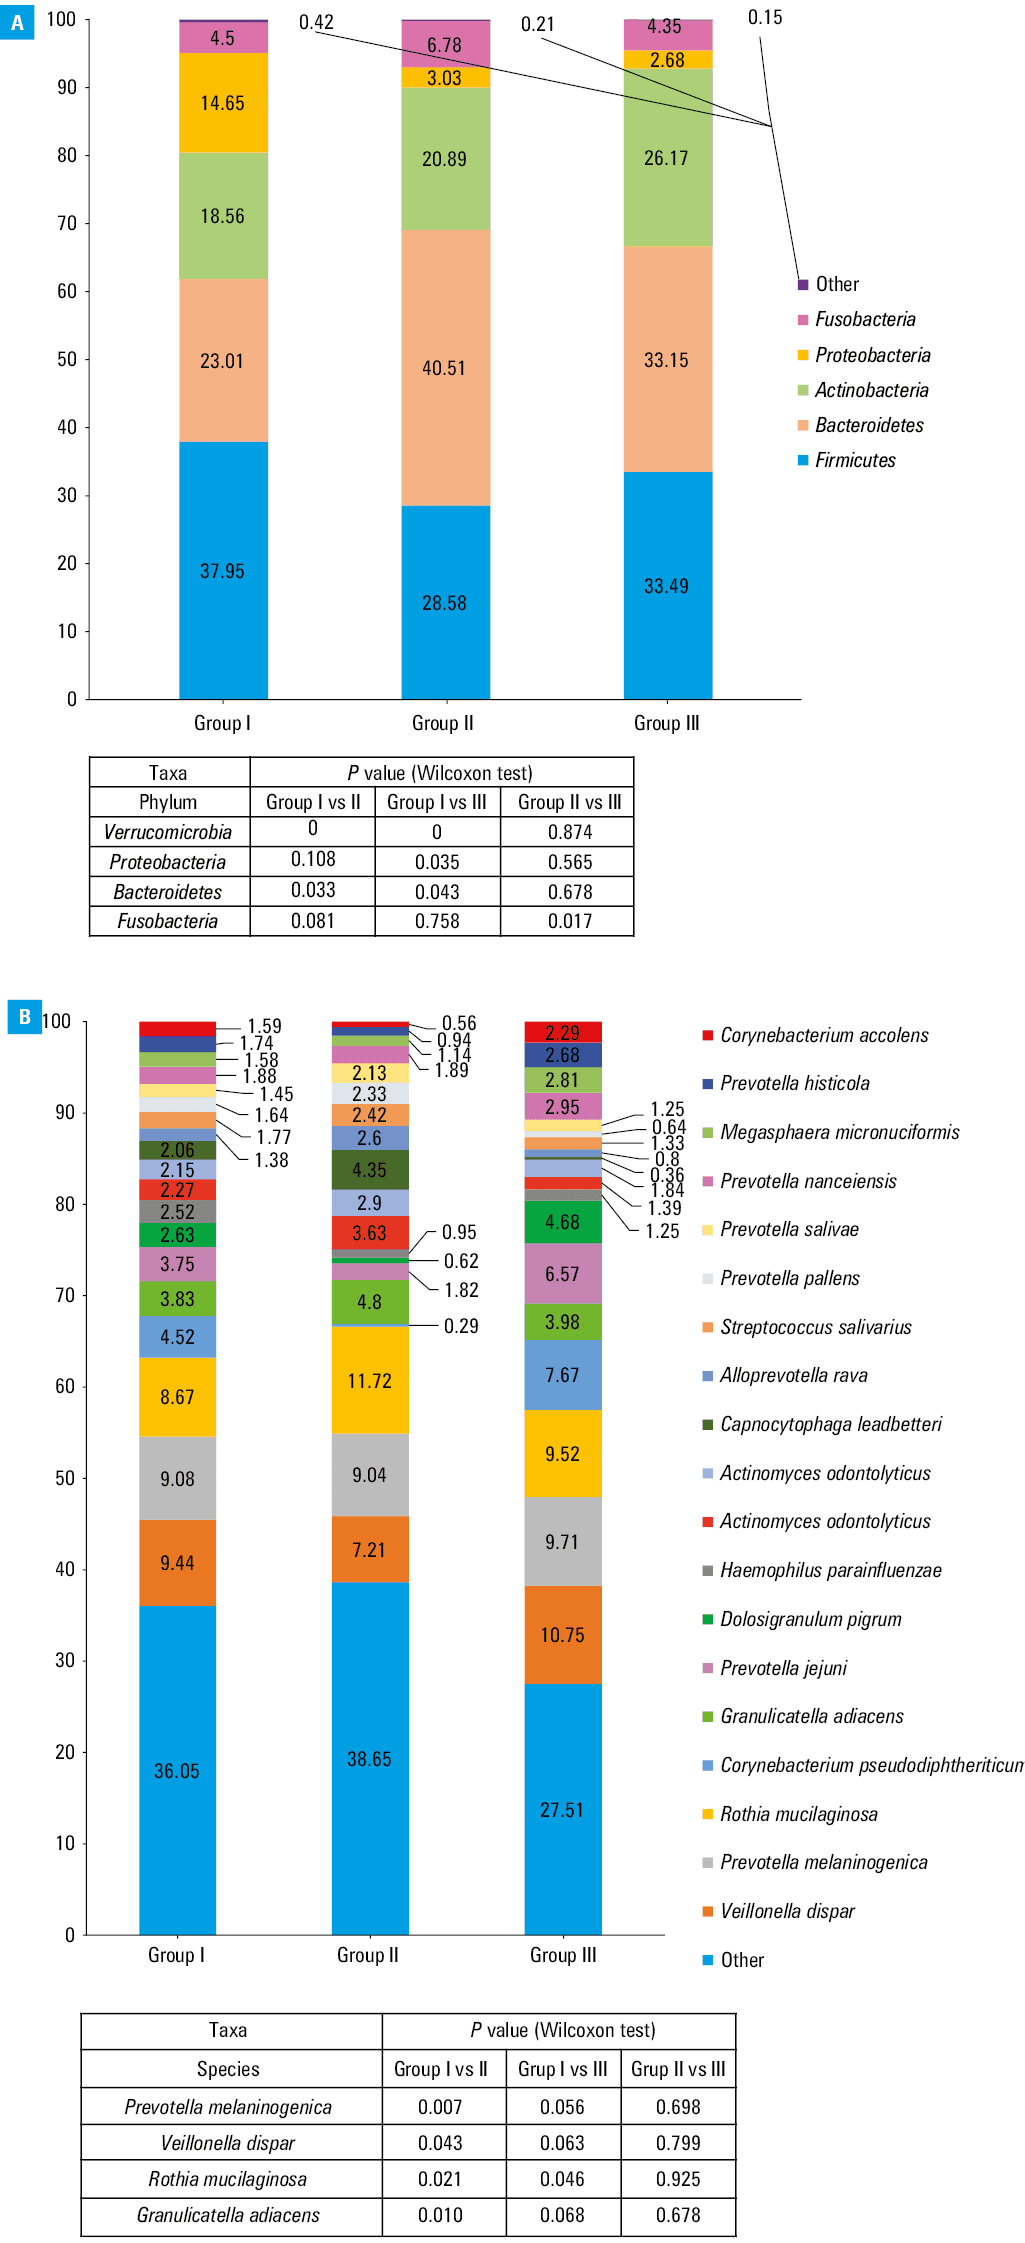
The taxonomic composition was analyzed on the phylum (L2) and species (L7) levels in the studied groups (Figure 2A and 2B). A total of 42 species differentiated group I from group II, 32 species differentiated group I from group III, and 6 species of bacteria were found to differentiate group II from group III (Figure 1A–1C). A downward (from group I to II to III) dependency in the percentage of the bacterial phylum Proteobacteria was observed as the SARS‑CoV‑2 viral load decreased. The opposite dependency was observed for the Actinobacteria phylum. Fusobacteria and Bacteroidetes phyla were the most numerous in group II, which was in contrast with the results observed for the Firmicutes phylum (Figure 2A). Comparing the percentage of total abundance at the species level (L7) in all 3 groups, Veillonella dispar, Prevotella melaninogenica, and Rothia mucilaginosa were predominant (Figure 2B). Species with the abundance below 2% were grouped together as “other” and were not subjected to a detailed analysis.
Heat tree analysis
In the heat trees analysis, a higher number of alterations in the nasopharyngeal microbiota was found across many phyla when comparing groups I vs II and I vs III (Figure 1A and 1B, respectively). One of our findings was a lower abundance of Prevotella species in group I than in groups II and III. A reverse dependence we observed for Clostridia, Bacteroidaceae, and Bifidobacteriales families. Moreover, we showed that the abundance of Akkermansia muciniphila, Ralstonia picketii, Pseudomonas beteli, Bifidobacterium longum, Faecalibacterium prausnitzii, Geminger formicilis, Fusicatenibacterium saccharivorans, Bacteroides dorei, B. uniformis and B. vulgatus was higher in group I than in groups II and III. Furthermore, the relative abundance of Enterococcus faecium and Pseudomonas beteli tended to be higher in group I vs II and in group II vs III. Fewer differences were detected between groups II and III (Figure 1C). The number of bacterial species that significantly differed in abundance between the compared groups was 42, 32, and 6, respectively, for groups I vs II, I vs III, and II vs III (Figure 1A–1C, Supplementary material, Table S1).
Linear discriminant analysis effect size method
The LDA score analysis revealed functional indicator bacteria that were characteristic of each cohort (Figure 3A–3C). In the comparisons of groups I vs II and I vs III, we presented the top 15 indicator bacteria, whereas in the comparison of group II vs III, we showed 6 indicator bacteria with the greatest relative abundance.
Discussion
SARS‑CoV‑2 viral load kinetics and duration of SARS‑CoV‑2 viral elimination are important determinants of COVID‑19 transmission.19 In this study, we aimed to characterize viral load dynamics and its interplay with nasopharyngeal bacterial microbiota composition in 3 groups of patients distinguished depending on their viral load quantity in the nasopharyngeal epithelial cells. There is scientific evidence of a positive correlation between SARS‑CoV‑2 viral load and its transmissibility.20 SARS‑CoV‑2 can be transmitted airborne in aerosol particles or larger droplets released by an infected individual during breathing, sneezing, or coughing, as well as through contact with contaminated objects.15,21 Even though there is a lot of research focused on SARS‑CoV‑2, the role of the nasal microbiota in COVID‑19 etiopathogenesis is still to be investigated. Bacterial microbiota of the nasopharynx may protect from SARS‑CoV‑2 infection through several mechanisms, including competition for space, nutrients, and antimicrobial peptides.14 When SARS‑CoV‑2 enters the airways, it meets the mucosal barrier, including resident microbiota.15 It is known that high biodiversity of bacterial microbiota is connected with protective effects and good health status.22 In our study, the biodiversity analysis generally showed a similar α-biodiversity among the 3 studied groups (each of the 3 groups was internally homogeneous) (Table 1). This is in line with the study by Engen et al,23 who examined SARS‑CoV‑2–positive and negative patients; however, their results were not significant. On the other hand, in the study by Rosas‑Salazar et al,24 the α-biodiversity when expressed by the Observed species index was significantly different between SARS‑CoV‑2–infected and noninfected adults. The comparison of β-diversity in the 3 groups in our study showed a significantly lower taxonomic similarity of bacteria among the tested groups from the family to the species level, which means that the study groups were significantly different in terms of taxonomic composition (Table 2). To go further in‑depth, when comparing the β-diversity for pairs of groups, the taxonomic similarity turned out to be significantly lower in group I vs II and in group I vs III, but not in group II vs III (groups II and III were more homogenous) for all 3 analyzed distance indices (Tables 3 and 4). These findings could be due to the significantly lower SARS‑CoV‑2 replication rate in groups II and III than in group I, which is related to the initiation of the process of microbiota restoration after viral infection. In contrast with our results, Rosas‑Salazar et al24 showed no significant differences in β-diversity when comparing SARS‑CoV‑2–infected and noninfected adults. Of note, the participants included in that study were younger than our population (median age, 30 vs 63 years, respectively), and age may correlate with the microbiota diversity. De Maio et al25 compared patients with mild COVID‑19 and healthy controls, and noted that neither α- nor β-biodiversity differed significantly between the groups. The authors suggested that SARS‑CoV‑2 could not induce alterations in the microbiota composition at the early stage of infection. In this context, it is worth noting that the comparison of data obtained from different studies is challenging due to the differences in group sizes and criteria for group selection. For instance, the study by Rosas‑Salazar et al24 included 38 symptomatic patients with mild‑to‑moderate COVID‑19 and 21 noninfected controls, whereas Engen et al23 analyzed 9 SARS‑CoV‑2–positive individuals and 10 controls without the infection. In our study, we did not include patients without COVID‑19, and the participants were not classified according to the symptoms and disease severity but to the viral load.
To further describe the differences among the 3 cohorts, we focused on the taxonomic differences in the bacterial microbiota depending on the SARS‑CoV‑2 viral load. Generally, we showed that the patients classified into group I (ie, those with a higher viral replication level) developed the most diverse bacterial microbiota community (Figure 1A and 1B; Figure 3A and 3B). Among the patients with low viral replication rate (group II) and those who eliminated SARS‑CoV‑2 from the epithelial cells (group III) the microbiota communities were more homogeneous (Figure 1C and 3C). This finding was confirmed in individual analyses of the relative percentage distribution. At the L2 level, the percentage of Verrucomicrobia, Bacteroidetes, and Proteobacteria was significantly different in group I than in the 2 other cohorts (ie, I vs II and I vs III), whereas it was similar in groups II and III (Figure 2A). It stands to reason that the group with a lower viral load and the group with no virus in the cells did not differ significantly with respect to the abundance of bacteria belonging to these taxa. These taxa included pathogens and opportunistic pathogens that might take advantage of a microbial dysbiosis of the nasopharynx, as well as bacterial species known to be part of the commensal bacterial microbiota of the URT. Relative percentage distribution at the L7 level and heat trees, along with the analyses mentioned earlier, indicate that group I was more heterogeneous than the other groups. It is confirmed, among other things, by divergences in the Prevotella genus abundance. We observed a lower total abundance of Prevotellaceae when the SARS‑CoV‑2 viral load was the highest, and the abundance increased when the virus was eliminated from the epithelial cells (Figure 1A–1C; Figure 2B). The Prevotellaceae family is one of the “core” microbiome components in the respiratory tract under the conditions of homeostasis.26,27 On the other hand, the overrepresentation of Prevotella genus was previously linked with inflammation and increased severity of COVID‑19, also in acute and chronic respiratory diseases.28,29 Moreover, we showed that the abundance of A. muciniphila, F. prausnitzii, and B. vulgatus, which are well‑known components of the gut microbiota, was higher in group I, as compared with groups II and III. These bacterial species deserve special attention, as they are responsible for mucin degradation,30-33 which might lead to direct contact of mucosa with microorganisms and induce inflammation. The respiratory and GI tracts share a common mucosal immune system known as the gut–lung axis.34 The microbiota of both tracts consists of similar phyla; nevertheless, they may differ in composition and density at the level of species.35 Of note, the gut–lung axis was found to play a role in the balance and recovery of gut microbiota after the clearance of SARS‑CoV‑2 RNA from the URT and the resolution of clinical symptoms.36 The abundance of A. muciniphila and B. dorei was elevated in the gut mucosa of COVID‑19 patients,37 while the abundance of F. prausnitzii and some species of Bifidobacteria was found to be decreased in patients infected with SARS‑CoV‑2.38 The reduced abundance of these bacterial species during SARS‑CoV‑2 replication in the epithelial cells may be related to the inflammation, and possibly be a marker of SARS‑CoV‑2 infection. We also detected the elevation of A. muciniphila and B. dorei in the nasopharyngeal mucosa, but in the URT tract, we observed the elevation of F. prausnitzii (Figure 1A).
Notably, in the groups with low SARS‑CoV‑2 replication rate and with no virus replication, there were only a few alterations in the bacterial microbiota composition, as confirmed by the relative percentage distribution, heat tree visualization, and the LDA score (Figures 1C and 3C). This means that in these 2 groups the microbiota communities were more homogenous. This might be associated with bacterial microbiota restoration after SARS‑CoV‑2 infection. Among the bacteria identified as indicators in patients with low SARS‑CoV‑2 replication (Figure 3C), the relative abundances tended to be higher for periodontopathic bacteria (Eikenella corrodes, Tannerella forsythia, Fusobacterium periodontium) in group II vs III. The periodontopathic bacteria may increase the expression of angiotensin‑converting enzyme‑2 cell protein, which is a receptor for SARS‑CoV‑2 binding to the host epithelial cells.38 Among these bacteria, F. peridonticum deserves special attention due to its involvement in the surface sialylation process.39 It is known that SARS‑CoV‑2 can use sialic acids as receptors to bind to the epithelium of the respiratory tract, promoting the accumulation of virus particles and infection development.39 Nardelli et al39 found a significant relative abundance of F. peridonticum in SARS‑CoV‑2–positive patients.
Commensal microbiota of the nasopharynx protects from pathogenic bacteria by competing for space and nutrients, and also by producing bacteriocins.40 A reduction in the abundance of the physiological bacterial microbiota of the URT is often associated with increased susceptibility to pathogenic bacteria and excessive proliferation of opportunistic pathogens. In our study, the relative abundance of Enterococcus faecium (belonging to the group of pathogens responsible for hospital‑acquired infections) and Pseudomonas beteli tended to be higher in the patients with high and decreased viral load (Figure 1A and 1B). It might be associated with an altered URT bacterial community and a differential induction of secondary bacterial infections due to colonization in the patients during hospitalization for COVID‑19. In agreement with our data, recent studies also reported the presence of opportunistic species with pathogenic potential during SARS‑CoV‑2 infection.41,42
Microbiota composition profiling during SARS‑CoV‑2 infection could be of significant prognostic value thanks to identification of indicator bacteria associated with an increased risk of severe disease. It may also be important for treating SARS‑CoV‑2 infection by tailoring the therapeutic strategy to the individual patient. Fewer differences in the microbiota composition were detected between groups II and III (Figure 1C and 3C). This is because groups I and II included patients with active viral replication, so they were very similar in terms of immunological profile or phase of COVID‑19. Although the SARS‑CoV‑2 viral load was associated with less or more significant alterations in the nasopharyngeal microbiota on various taxonomic levels, the LDA score indicated the indicator bacteria that were characteristic of each group (Figure 3A–3C).
Our study has numerous strengths; nevertheless, we should also acknowledge several limitations. First, this was a single‑center study. In the future, a larger group of patients should be tested in a multicenter study to check if our findings could be generalized to other populations. In addition, the URT microbiota composition could be affected by geographical location and host genetics, among others.43,44 Second, we classified the participants according to the SARS‑CoV‑2 viral load, and not COVID‑19 severity, which made it difficult to directly compare our results with those of other studies that mainly focused on the analysis of clinical factors associated with severe disease. Another limitation of our study is the lack of a control group without SARS‑CoV‑2 infection. However, we recruited the patients during the lockdown period, which precluded the possibility of recruiting healthy individuals. Moreover, our results may vary from those reported in other studies due to the differences in NGS methodology. Other authors used different sequences of primers targeting different regions of 16S rRNA, which may result in a quantitative shift of some bacterial taxa. Therefore, it may be difficult to make a simple comparison of the results. For example, Nardelli et al39 targeted variable regions V1–V2–V3 of the 16S rRNA genes. In contrast, De Maio et al25 targeted regions V5–V6, whereas Braun et al45 performed a cross‑sectional 16S rRNA sequencing study targeting only region V4, similarly to Engen et al.23
Our study is important in terms of exploring the link between the nasopharyngeal microbiota composition and SARS‑CoV‑2 viral load. The arbitrarily established division of cohorts reflected the diversified qualitative and semiquantitative composition of the bacterial microbiota. The patients with low viral replication rate (group II) and those who eliminated the SARS‑CoV‑2 virus from the epithelial cells (group III) developed less diverse microbiota communities. More extensive knowledge on the microbiota composition and a better understanding of the interactions between the microbiota and their metabolites influencing the SARS‑CoV‑2 infection might serve as a novel therapeutic target for improving the prognosis of patients.
- Rapin A, Pattaroni C, Marsland BJ, Harris NL. Microbiota analysis using an Illumina MiSeq platform to sequence 16S rRNA genes. Curr Protoc Mouse Biol. 2017; 7: 100‑129. | Crossref
- Noce A, Marrone G, Di Daniele F, et al. Impact of gut microbiota composition on onset and progression of chronic non‑communicable diseases. Nutrients. 2019; 11: 1073. | Crossref
- Leocádio PCL, Oriá RB, Crespo‑Lopez ME, Alvarez‑Leite JI. Obesity: more than an inflammatory, an infectious disease? Front Immunol. 2020; 10: 3092. | Crossref
- Finlay BB; CIFAR Humans; Microbiome. Are noncommunicable diseases communicable? Science. 2020; 367: 250‑251. | Crossref
- Sroka‑Oleksiak A, Młodzińska A, Bulanda M, et al. Metagenomic analysis of duodenal microbiota reveals a potential biomarker of dysbiosis in the course of obesity and type 2 diabetes: a pilot study. J Clin Med. 2020; 9: 369. | Crossref
SUPPLEMENTARY MATERIAL
ARTICLE INFORMATION